Two-body gravitational interactions will occasionally lead to a stellar-mass compact object entering a very highly eccentric orbit around a massive black hole at the center of a galaxy. Gravitational radiation damping will subsequently result in an extreme mass ratio inspiral. Much of the inspiral time of these events is spent with the compact object on a long-period orbit, with a brief burst of gravitational wave emission at periapsis firmly in the mHz band. Burst orbits have been previously modeled as parabolic, with a focus on extreme examples that could be detectable by space-based gravitational wave detectors. This work focuses on the recurring bursts called "peeps." Peeps are not likely to be individually resolvable; however, it is also important to consider them as possible sources of signal confusion noise because they do generate a signal within the Laser Interferometer Space Antenna (LISA) band with every pericenter passage. To account for peeps, we must utilize estimates for extreme mass ratio inspiral (EMRI) capture parameters along with tracking the massive black hole population out to a redshift of 3 using the Illustris Project. Then, this population is combined with an EMRI formation rate to estimate the number of EMRI events per unit volume for LISA. In this study, we model four different assumptions for the gravitational wave background produced by these highly eccentric peeps. We find that with our two most likely backgrounds, the signal may result in a slight rise of the LISA noise floor (SNR 0.3-2.4); however, in two more abundant cases, the background generated by these sources would be detectable on their own and likely obscure many potentially detectable sources (SNR 77-145).
In a series of papers published in the course of his dissertation work in the mid 1950's, Andrzej Trautman drew upon the slow motion approximation developed by his advisor Infeld, the general covariance based strong conservation laws enunciated by Bergmann and Goldberg, the Riemann tensor attributes explored by Goldberg and related geodesic deviation exploited by Pirani, the permissible metric discontinuities identified by Lichnerowicz, O'Brien and Synge, and finally Petrov's classification of vacuum spacetimes. With several significant additions he produced a comprehensive overview of the state of research in equations of motion and gravitational waves that was presented in a widely cited series of lectures at King's College, London, in 1958. Fundamental new contributions were the formulation of boundary conditions representing outgoing gravitational radiation the deduction of its Petrov type, a covariant expression for null wave fronts, and a derivation of the correct mass loss formula due to radiation emission. Ivor Robinson had already in 1956 developed a bi-vector based technique that had resulted in his rediscovery of exact plane gravitational wave solutions of Einstein's equations. He was the first to characterize shear-free null geodesic congruences. He and Trautman met in London in 1958, and there resulted a long-term collaboration whose initial fruits were the Robinson-Trautman metric, examples of which were exact spherical gravitational waves.
Scattering events around the center of massive galaxies will occasionally toss a stellar-mass compact object into an orbit around the massive black hole (MBH) at the center, beginning an extreme mass ratio inspiral (EMRI). The early stages of such a highly eccentric orbit are not likely to produce detectable gravitational waves (GWs), as the source will only be in a suitable frequency band briefly when it is close to periapsis during each long-period orbit. This repeated burst of emission, firmly in the millihertz band, is the GW peep. While a single peep is not likely to be detectable, if we consider an ensemble of such subthreshold sources, spread across the Universe, together they may produce an unresolvable background noise that could obscure sources otherwise detectable by the Laser Interferometer Space Antenna. Previous studies of the extreme mass ratio signal confusion background focused either on parabolic orbits near the MBH or events closer to merger. We seek to improve this characterization by implementing numerical kludge waveforms that can calculate highly eccentric orbits with relativistic effects. Our focus is on orbits at the point of capture that are farther away from the MBH. Here we present the waveforms and spectra of peeps generated from recent calculations of EMRIs/extreme mass ratio bursts capture parameters and discuss how these can be used to estimate the signal confusion noise generated by such events. We demonstrate the effects of changing the orbital parameters on the resulting spectra as well as showing direct comparisons to parabolic orbits and why the GW 'peep' needs to be studied further. The results of this study will be expanded upon in a further paper that aims to provide an update on the EMRI signal confusion noise problem.
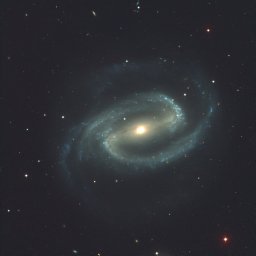
ABSTRACT Quasi-stationary density wave theory predicts the existence of an age gradient across the spiral arms with a phase crossing at the corotation radius. We have examined evidence for such age gradients using star formation history (SFH) maps derived from lightning, a spectral energy distribution fitting procedure, and by using spatially resolved stellar clusters. Three galaxies from the LEGUS survey were used to analyse the azimuthal offsets of spatially resolved stellar clusters. Kernel density estimation plots of azimuthal cluster distance offsets reveal prominent central peaks and secondary peaks on the positive side, relative to the density wave for NGC 5194 and NGC 5236. These secondary downstream peaks in the cluster distributions show overall evidence for an age gradient. NGC 628 shows secondary peaks on both sides of the density wave. The cluster distributions also show an increasing spatial spread with age, consistent with the expectation that they were born in the density wave. SFH maps of 12 nearby galaxies were analysed using spirality, a matlab-based code, which plots synthetic spiral arms over FITS images. The SFH maps reveal a gradual decrement (tightening) in pitch angles with increasing age. By analysing the pitch angle differences between adjacent age bins using the error function, the average of the probabilities shows a $69{{\ \rm per\ cent}}\pm 25{{\ \rm per\ cent}}$ chance that the pitch angle values decrease (tighten) with increasing age. Thus, we see a tightening of the spiral pattern in galaxies, both when segregating stellar populations specifically by age or more generally by colour, as was shown in our previous studies.
We present an analysis of the pitch angle distribution function (PADF) for nearby galaxies and its resulting black hole mass function (BHMF) via the well-known relationship between pitch angle and black hole mass. Our sample consists of a subset of 74 spiral galaxies from the Carnegie-Irvine Galaxy Survey with absolute B-band magnitude MB>−19.12 mag and luminosity distance DL≤25.4 Mpc, which is an extension of a complementary set of 140 more luminous (MB≤−19.12 mag) late-type galaxies. We find the PADFs of the two samples are, somewhat surprisingly, not strongly dissimilar; a result that may hold important implications for spiral formation theories. Our data show a distinct bimodal population manifest in the pitch angles of the Sa–Sc types and separately the Scd–Sm types, with Sa–Sc types having tighter spiral arms on average. Importantly, we uncover a distinct bifurcation of the BHMF, such that the Sa–Sc galaxies typically host so-called “supermassive” black holes (M•≳106M⊙), whereas Scd–Sm galaxies accordingly harbor black holes that are “less-than-supermassive” (M•≲106M⊙). It is amongst this latter population of galaxies where we expect fruitful bounties of elusive intermediate-mass black holes (IMBHs), through which a better understanding will help form more precise benchmarks for future generations of gravitational wave detectors.
We present the MATLAB code Spirality, a novel method for measuring spiral arm pitch angles by fitting galaxy images to spiral templates of known pitch. Computation time is typically on the order of 2 min per galaxy, assuming 8 GB of working memory. We tested the code using 117 synthetic spiral images with known pitches, varying both the spiral properties and the input parameters. The code yielded correct results for all synthetic spirals with galaxy-like properties. We also compared the code’s results to two-dimensional Fast Fourier Transform (2DFFT) measurements for the sample of nearby galaxies defined by DMS PPak. Spirality’s error bars overlapped 2DFFT’s error bars for 26 of the 30 galaxies. The two methods’ agreement correlates strongly with galaxy radius in pixels and also with i-band magnitude, but not with redshift, a result that is consistent with at least some galaxies’ spiral structure being fully formed by z=1.2, beyond which there are few galaxies in our sample. The Spirality code package also includes GenSpiral, which produces FITS images of synthetic spirals, and SpiralArmCount, which uses a one-dimensional Fast Fourier Transform to count the spiral arms of a galaxy after its pitch is determined. All code is freely available.
In a letter in the June 2020 issue of Physics Today (page 12), Robert McAdory posed the question of whether photographic plates taken at earlier solar eclipses might have been of use to the famous British eclipse expeditions of 1919. Those expeditions tested Albert Einstein’s prediction that the positions of stars seen near the Sun are affected by the gravitational deflection of light. Deborah Kent’s article about the solar eclipse of 1869 (Physics Today, August 2019, page 46) discussed very early photographic plates of the Sun. Because we have both written about astronomers’ testing of Einstein’s theory of general relativity, we wanted to expand on that interesting discussion. The great prominence visible here is from the famous 1919 eclipse. The photo was taken by Arthur Stanley Eddington using an Astrographic lens on the island of Principe. This image was worthless for testing Einstein’s light deflection effect. Clouds occluded the stars near the Sun but prevented overexposure of the bright prominence. (Courtesy of Charlie Johnson.) PPT|High-resolutionStars almost certainly did not appear on plates taken in 1869, because the wet-plate photography in use then was not very sensitive. Generally, only bright objects like the Sun or Moon appeared on photographs of the sky. Not until the development and popularization of dry-plate photography in the 1880s did stellar photography become possible.Some star images were obtained during eclipses before 1919, and efforts were made to use those plates to retroactively test Einstein’s light-deflection prediction. However, none of the images were clear enough for measuring the small light-deflection effect, essentially because of the following confounding factors.► Too few stars were imaged. Frank Dyson and Charles Davidson, the two astronomers mainly responsible for data analysis of the plates taken in Sobral, Brazil, in 1919, had examined plates from a 1905 eclipse taken with one of the lenses that would be used in 1919. They had found only two stellar images. But they anticipated that the same setup would work in 1919, since the star field was much richer in bright stars. For subsequent eclipses, astronomers took very long exposures in order to image enough stars. The 1922 eclipse exposures, for example, were about one minute long.► The field of view was too narrow. Most eclipse plates are framed tightly on the Sun and its corona and do not include other stars at all. Plates taken in search of the nonexistent planet Vulcan were different, but they tended to place the Sun in the corner of a plate, when its being in the center is optimum for the light-deflection experiment.► Tracking was inappropriate. Because the Sun is typically the center of attention during eclipses, astronomers naturally tracked with their telescopes to keep the Sun fixed on the plate. Star images would not be so fixed, so any that appeared would sustain some streaking, which would compromise the measurement of position shifts.► No comparison plates were available. Before 1919 there was no reason to make comparison plates of the same star field with the same equipment months before or after an eclipse. But without them, any small shift of position would be difficult to notice, let alone measure. In the early 20th century, positions for the vast majority of stars were not accurately known. In fact, Dyson and Davidson were beavering away on the first all-sky photographic survey, the Carte du Ciel project. Even their routine measurements were not necessarily accurate enough to notice Einstein’s predicted effect.American astronomer Heber Curtis (who attempted the Einstein experiment during a 1918 eclipse) did try to analyze plates from the 1900 eclipse, using plates taken in 1919 for comparison. He measured the positions of six stars visible on the plates, but with the 19-year time lapse, he could not rule out proper motion (the projected motion of the stars in the Milky Way) as an explanation of any shift in position. That would be especially true of the particular star field, since the Hyades stars—in which the Sun is located on 28 and 29 May, the dates of the 1900 and 1919 eclipses—are close to our solar system and exhibit large proper motions.For his six stars, Curtis did use rectilinear coordinates from the Paris zone of the Carte du Ciel project, and he believed they supported his contention that the predicted light-deflection effect was not real. But his data were of poor quality, and William Wallace Campbell, his collaborator and employer at the Lick Observatory, declined to publish the results.In his letter, McAdory asked whether any astronomers, independent of Einstein, suspected the existence of a shift of star positions near the Sun. One who did believe was Leopold Courvoisier, a Swiss astronomer at the Babelsberg Observatory in Berlin and a colleague of Einstein collaborator Erwin Finlay Freundlich. However, Courvoisier thought the effect extended much farther from the Sun and could be observed without the need for eclipse expeditions. The shift was essentially a seasonal one, he believed, bigger than the one Einstein called for, with the Sun at its center. He was a staunch antirelativist who hated Einstein’s theory, and he attributed the effect to the solar system’s motion through the ether. Section:ChooseTop of page <<© 2020 American Institute of Physics.
ABSTRACT The spiral arms spanning disc galaxies are believed to be created by density waves that propagate through galactic discs. We present a novel method of finding the co-rotation radius where the spiral arm pattern speed matches the velocities of the stars within the disc. Our method uses an image-overlay technique, which involves tracing the arms of spiral galaxies on images observed in different wavelengths. Density wave theory predicts that spiral arms observed from different wavelengths show a phase crossing at the co-rotation radius. For the purpose of this study, 20 nearby galaxies were analysed in four different wavelengths with pitch angle measurements performed by two independent methods. We used optical wavelength images (B band 440 nm), two infrared wavelength images provided by Spitzer (3.6 and 8 μm) and ultraviolet images from GALEX (1350, 1750 Å). The results were compared and verified with other records found in the literature. We then found rotation curve data for six of our galaxies and used our co-rotation radii estimates to measure the time that would elapse between star formation and moving to their observed positions in the B-band spirals. The average time lapse for this motion was found to be ∼50 Myr. The success of this new method of finding the co-rotation radius confirms density wave theory in a very direct way.
Einstein's general theory of relativity is one of the most important accomplishments in the history of science. We reassess the importance of one of the expeditions that made its experimental verification possible — a story that involves a sense of adventure and scientific ingenuity in equal measure.
In GW150914, approximately $3M_{\odot}$ were radiated away as gravitational waves from the binary black hole system as it merged. The stress energy of the gravitational wave itself causes a nonlinear memory effect in the detectors here on Earth called the Christodoulou memory. We use an approximation that can be applied to numerical relativity waveforms to give an estimate of the displacement magnitude and the profile of the nonlinear memory. We give a signal to noise ratio for a single GW150914-like detection event, and by varying the total mass and distance parameters of the event, we find distances and source masses for which the memory of an optimally oriented GW150914-like event would be detectable in aLIGO and future detectors.
 Julia D. Kennefick合作论文数The, Ohio State University53
 Marc S. Seigar合作论文数Joint Astronomy Centre35
 Benjamin L. Davis合作论文数33
 Claud Lacy合作论文数30Douglas W. Shields合作论文数23
 Joel C. Berrier合作论文数Department of Physics;Center for Cosmology;University of California;Center for Cosmology, University of California , Irvine22R. Scott Barrows合作论文数Dept Astrophys & Planetary Sci, Univ Colorado11
 Patrick M. Treuthardt合作论文数10
 Mohamed Shameer Abdeen合作论文数Dept Phys & Astron, Georgia Southern Univ9Erik B. Monson合作论文数6
 Ismaeel A. Al-Baidhany合作论文数Coll Educ, Mustansiriyah Univ6
 Miller Ryan S合作论文数6matthew t hartley合作论文数5S. J. Kapadia合作论文数5
 Shane L. Larson合作论文数Northwestern University;Clarkson University5Kostas Glampedakis合作论文数5Aaron D. Johnson合作论文数4
 Lucas Johns合作论文数Dept Astron, Univ Calif Berkeley4
 Rafael Eufrasio合作论文数Dept Phys, Univ Arkansas4Amanda Schilling合作论文数3amber d sierra合作论文数3
 Jonathan Gair合作论文数Astrophysical and Cosmological Relativity Division, Albert Einstein Institute3Daniel J Oliver合作论文数2jozsef illy合作论文数2Michael Fusco合作论文数2Alex Hixon合作论文数2Benjamin Boe合作论文数2
 Lior Burko合作论文数Department of Physics;University of Utah;Department of Physics, University of Utah2
 Misty C. Bentz合作论文数The, Ohio State University2
 Diana Kormos Buchwald合作论文数Division of the Humanities and Social Sciences, California Institute of Technology2Heikki Salo合作论文数Division of Astronomy, Department of Physics, Luonnontieteellinen tiedekunta, University of Oulu2Martin Blume合作论文数2Claud H Sandberg Lacy合作论文数2A. J. Kox合作论文数Institute of Theoretical Physics;University of Amsterdam;Institute of Theoretical Physics, University of Amsterdam2
 Gaurav Khanna合作论文数Department of Physics, College of Arts and Sciences, University of Rhode Island2K. Glampedakis合作论文数2NO MURCHADHA合作论文数1Michel Janssen合作论文数1robert schulmann合作论文数1thomas p k martinsson合作论文数1Alice Calaprice合作论文数1
 Aaron Johnson合作论文数1Emily de Araújo合作论文数1Casey Henderson合作论文数1w jabbar合作论文数Coll Educ, Mustansiriyah Univ1Jordan R. Stone合作论文数Microsystems and Nanotechnology Division, National Institute of Standards and Technology1Andrew Osborne合作论文数Dept Phys, Univ Colorado1Andrew R. Kaiser合作论文数Dept Phys & Astron, West Virginia Univ1
 Carlos Veiga合作论文数Dept Angiol & Vasc Surg, Ctr Hosp Univ Porto1




