Method Soils represent a major global source and sink of greenhouse gases (GHGs). Many studies of GHG fluxes between soil, plant and atmosphere rely on chamber measurements. Different chamber techniques have been developed over the last decades, each characterised by different requirements and limitations. In this manuscript, we focus on the non-steady-state technique which is widely used for manual measurements but also in automatic systems. Although the measurement method appears very simple, experience gained over the years shows that there are many details which have to be taken into account to obtain reliable measurement results. Aim This manuscript aims to share lessons learnt and pass on experiences in order to assist the reader with possible questions or unexpected challenges, ranging from the planning of the design of studies and chambers to the practical handling of the chambers and the quality assurance of the gas and data analysis. This concise introduction refers to a more extensive Best Practice Guideline initiated by the Working Group Soil Gases (AG Bodengase) of the German Soil Science Society (Deutsche Bodenkundliche Gesellschaft). The intention was to collect and aggregate the expertise of different working groups in the research field. As a compendium, this Best Practice Guideline is intended to help both beginners and experts to meet the practical and theoretical challenges of measuring soil gas fluxes with non-steady-state chamber systems and to improve the quality of the individual flux measurements and thus entire GHG studies by reducing sources of uncertainty and error.
Farmers in Ghana rely on different forms of fertilizers to increase crop yields. The quantity of applied mineral N fertilizer is lost through nitrification and denitrification in the form of the powerful greenhouse gas nitrous oxide (N2O) has not been determined in the field until now. This study was conducted on a Ferric Luvisol in the Tolon District in Northern Ghana to determine the influence of nitrogen fertilizers, soil moisture and soil temperature on N2O emissions and grain yield. Three different nitrogenous fertilizers, i.e. ammonia sulfate (AS), urea (U) and NPK 60-40-40, were applied at either 60 or 120 kg N ha(-1) yr(-1) to maize, termed AS 60, AS 120, U 60, U 120 and NPK 60-40-40 thereafter. A control was left without N application. The results showed that N fertilizer type and quantities applied affected N2O emissions significantly. Plots of NPK 60-40-40, AS 60 and U 60 emitted 1.22, 1.45 and 1.79 kg N2O-N ha(-1), respectively, throughout the sampling period and were not considerably higher than N2O emissions from the control plots, which amounted to 0.32 kg N2O-N ha(-1). In contrast, the N2O emissions of U 120 and AS 120 were significantly higher than the controls, with values of 4.29 and 3.49 kg N2O-N ha(-1), respectively. When N2O flux was related to grain yield, 1.24 and 1.04 g N2O kg(-1) grain was emitted from AS 120 and U 120, respectively. Plots treated with NPK 60-40-40, AS 60 and U 60 produced 0.39, 0.47 and 0.55 g N2O kg(-1) grain, respectively, whereas plots without fertilization emitted 0.53 g N2O kg(-1) grain. Average N-induced N2O emission factors ranged between 0.10% and 0.22%, with an overall emission factor of 0.15%. (c) 2019 The Authors. Published by Elsevier B.V. on behalf of African Institute of Mathematical Sciences / Next Einstein Initiative. This is an open access article under the CC BY license. (http://creativecommons.org/licenses/by/4.0/)
Hydroxylamine (NH2OH), a reactive intermediate of several microbial nitrogen turnover processes, is a potential precursor of nitrous oxide (N2O) formation in the soil. However, the contribution of soil NH2OH to soil N2O emission rates in natural ecosystems is unclear. Here, we determined the spatial variability of NH2OH content and potential N2O emission rates of organic (Oh) and mineral (Ah) soil layers of a Norway spruce forest, using a recently developed analytical method for the determination of soil NH2OH content, combined with a geostatistical Kriging approach. Potential soil N2O emission rates were determined by laboratory incubations under oxic conditions, followed by gas chromatographic analysis and complemented by ancillary measurements of soil characteristics. Stepwise multiple regressions demonstrated that the potential N2O emission rates, NH2OH and nitrate (NO3−) content were spatially highly correlated, with hotspots for all three parameters observed in the headwater of a small creek flowing through the sampling area. In contrast, soil ammonium (NH4+) was only weakly correlated with potential N2O emission rates, and was excluded from the multiple regression models. While soil NH2OH content explained the potential soil N2O emission rates best for both layers, also NO3− and Mn content turned out to be significant parameters explaining N2O formation in both soil layers. The Kriging approach was improved markedly by the addition of the co-variable information of soil NH2OH and NO3− content. The results indicate that determination of soil NH2OH content could provide crucial information for the prediction of the spatial variability of soil N2O emissions.
Known as biogeochemical hotspots in landscapes, riparian buffer zones exhibit considerable potential concerning mitigation of groundwater contaminants such as nitrate, but may in return enhance the risk for indirect N2O emission. Here we aim to assess and to compare two riparian gray alder forests in terms of gaseous N2O and N2 fluxes and dissolved N2O, N2, and NO3(-) in the near-surface groundwater. We further determine for the first time isotopologue ratios of N2O dissolved in the riparian groundwater in order to support our assumption that it mainly originated from denitrification. The study sites, both situated in Estonia, northeastern Europe, receive contrasting N loads from adjacent uphill arable land. Whereas N2O emissions were rather small at both sites, average gaseous N2-to-N2O ratios inferred from closed-chamber measurements and He-O laboratory incubations were almost four times smaller for the heavily loaded site. In contrast, groundwater parameters were less variable among sites and between landscape positions. Campaign-based average (15)N site preferences of N2O (SP) in riparian groundwater ranged between 11 and 44 ‰. Besides the strong prevalence of N2 emission over N2O fluxes and the correlation pattern between isotopologue and water quality data, this comparatively large range highlights the importance of denitrification and N2O reduction in both riparian gray alder stands.
Denitrifying aquifers are sources of the greenhouse gas N2O. Isotopic signatures reflect processes of production and reduction of N2O, but it is not clear to which extent these can be used to quantify those processes. We investigated the spatial distribution of isotopologue values of N2O (delta O-18, average delta N-15, and N-15 site preference, SP) in two denitrifying sandy aquifers to study N2O production and reduction and associated isotope effects in groundwater. For the first time, we combined this approach with direct estimation of N2O reduction from excess-N-2 analysis. Groundwater samples were collected from 15 monitoring wells and four multilevel sampling wells and analysed for NO3-, dissolved N2O, dissolved O-2, excess N-2 from denitrification and isotopic signatures of NO3- and N2O. Both aquifers exhibited high NO3- concentrations with average concentrations of 22 and 15 mg N L-1, respectively. Evidence of intense denitrification with associated N2O formation was obtained from mean excess-N-2 of 3.5 and 4.3 mg N L-1, respectively. Isotopic signatures of N2O were highly variable with ranges of 17.6-113.2 parts per thousand (delta O-18), 55.4 to 89.4 parts per thousand (delta N-15(bulk)) and 1.8-97.9 parts per thousand (SP). delta N-15 and delta O-18 of NO3- ranged from 2.1 parts per thousand to 65.5 parts per thousand and from -5 parts per thousand to 33.5 parts per thousand, respectively.The relationships between delta N-15 of NO3- , delta N-15(bulk) and SP were not in good agreement with the distribution predicted by a Rayleigh-model of isotope fractionation. The large ranges of delta O-18 and SP of N2O as well as the close correlation between these values could be explained by the fact that N2O reduction to N-2 was strongly progressed but variable.We confirm and explain that a large range in SP and delta O-18 is typical for N2O from denitrifying aquifers, showing that this source signature can be distinguished from the isotopic fingerprint of N2O emitted from soils without water-logging. We conclude that isotopologue values of N2O in our sites were not suitable to quantify production or reduction of N2O or the contribution of different processes to the total N2O flux, apparently because these values were not only governed by individual pathways but eventually also by the spatial distribution of substrates and activity within the aquifers. These observations could be explained by the dynamics of N2O production, reduction and transport in water-saturated systems with heterogenic distribution of microbial activity and by a combination of diffusive and enzymatic isotope effects. (C) 2012 Elsevier Ltd. All rights reserved.
Emissions of the major greenhouse gas NO from soils are characterized by huge spatial variability. An upscaling based on conventional small-scale chamber measurements is thus questionable and may involve a considerable amount of uncertainty. In this feasibility study, we evaluated the applicability of a large, closed tunnel for field-scale measurements of NO fluxes from an unfertilized grassland soil. The tunnel, coupled to an open-path Fourier transform infrared spectrometer, covered 500 m. During a 2-yr campaign, concurrent closed-chamber measurements (area of 0.045 m) were performed at the tunnel plot. The tunnel system enabled high-density and precise NO concentration measurements under dry, stable, nocturnal atmospheric conditions, but higher wind speeds and rain limited its application. To calculate an unbiased, predeployment NO flux from the increase of NO concentrations during tunnel deployment, we propose a novel approach based on inverse modeling (IMQ0). We show that IMQ0 is appropriate for the specific non-steady state tunnel setup. Compared with conventional models, which were developed for gas flux calculation from concentration gradients measured in vented closed chambers, IMQ0 is most accurate. Whereas NO fluxes obtained from the tunnel measurements were generally small and at a typical background level, the chamber measurements revealed high spatial and temporal variability of NO emissions, including slight NO uptake and precipitation-triggered emission peaks. The cumulative NO fluxes of both methods differed by one order of magnitude and were smaller for the tunnel measurements. We argue that the chambers were occasionally susceptible to detection of hotspots and hot moments of NO emission. However, these emissions were evidently not representative for the field scale. Compared with available greenhouse gas measurement techniques, we conclude that the tunnel may serve as a gap-filling method between small-scale chamber and ecosystem-level micrometeorological techniques, particularly during stable nocturnal conditions.
Emissions of the powerful greenhouse gas nitrous oxide (N2O) from soils are commonly highly variable in space. An upscaling of classical small-scale chamber measurements is thus questionable and adds uncertainty to emission inventories or empirical emission factors. Therefore, fieldscale approaches will become increasingly important. Since micrometeorological tech-niques are often limited by stable atmospheric conditions and their low spatial resolution, we used a closed tunnel on an area of 500 m2 equipped with an open-path Fourier Transform Infrared (FTIR) spectrometer and aimed to
(1) Johann Heinrich von Thunen-Institut; Federal Research Institute for Rural Areas, Forestry and Fisheries; Institute of Agricultural Climate Research, Braunschweig, Germany (reinhard.well@vti.bund.de, +49 531 596 2535), (2) Soil Science of Temperate and Boreal Ecosystems, Busgen-Institute, University of Gottingen, Germany, (3) Institute for Landuse / Soil Physics and Environmental Resources Conservation, University of Rostock, Germany, (4) Institute of Geography, University of Tartu, Estonia
Production and accumulation of the major greenhouse gas nitrous oxide (N 2 O) in surface groundwater might contribute to N 2 O emissions to the atmosphere. We report on a 15 N tracer study conducted in the Fuhrberger Feld aquifer in northern Germany. A K 15 NO 3 tracer solution (60 atom%) was applied to the surface groundwater on an 8 m 2 measuring plot using 45 injection points in order to stimulate production of 15 N 2 O by denitrification and to detect its contribution to emissions at the soil surface. Samples from the surface groundwater, from the unsaturated zone and at the soil surface were collected in regular intervals over a 72-days period. Total N 2 O fluxes at the soil surface were low and in a range between −7.6 and 29.1 μg N 2 O-N m −2 h −1 . 15 N enrichment of N 2 O decreased considerably upwards in the profile. In the surface groundwater, we found a 15 N enrichment of N 2 O between 13 and 42 atom%. In contrast, 15 N enrichment of N 2 O in flux chambers at the soil surface was very low, but a detectable 15 N enrichment was found at all sampling events. Fluxes of groundwater-derived 15 N-N 2 O were very low and ranged between 0.0002 and 0.0018 kg N 2 O-N ha −1 year −1 , indicating that indirect N 2 O emissions from the surface groundwater of the Fuhrberger Feld aquifer occurring via upward diffusion are hardly significant. Due to these observations we concluded that N 2 O dynamics at the soil–atmosphere interface is predominantly governed by topsoil parameters. However, highest 15 N enrichments of N 2 O throughout the profile were obtained in the course of a rapid drawdown of the groundwater table. We assume that such fluctuations may enhance diffusive N 2 O fluxes from the surface groundwater to the atmosphere for a short time.
 Carolin Von Der Heide合作论文数12Reinhard Well合作论文数Universität Göttingen Institut für Bodenkunde und Waldernährung11Jürgen Böttcher合作论文数7Wilhelmus H. M. Duijnisveld合作论文数7
 Heinz Flessa合作论文数Johann Heinrich von Thünen Institute6Markus Deurer合作论文数4
 Harry Vereecken合作论文数Institut fur Bio- und Geowissenschaften, Forschungszentrum Julich4Juergen Boettcher合作论文数3michael wiwiorra合作论文数3
 Ülo Mander合作论文数Institute of Ecology and Earth Sciences, Faculty of Science and Technology, University of Tartu;Department of Geography, University of Tartu3
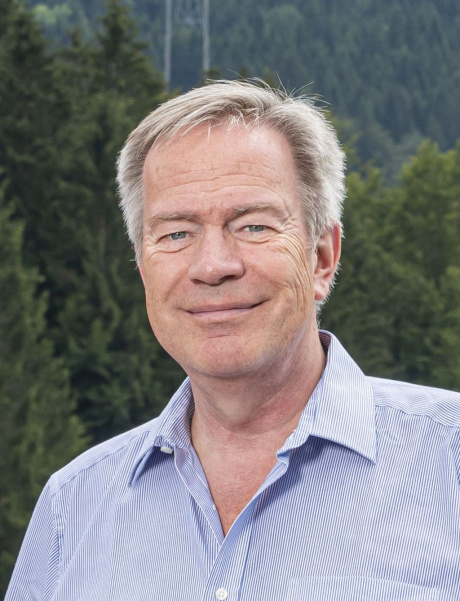 Stefan Emeis合作论文数Institute of Meteorology and Climate Research, Atmospheric Environmental Research (IMK-IFU), Karlsruhe Institute of Technology3
 Raabe Armin合作论文数3
 Martin Maddison合作论文数3
 Nicolas Brüggemann合作论文数Forschungszentrum Jülich;University of Bonn3Kaido Soosaar合作论文数Institute of Geography, University of Tartu3
 Klaus Schaefer合作论文数3anja schleichardt合作论文数2Nina Gottselig合作论文数Institute of Crop Science and Resource Conservation, Universität Bonn2
 Inge Wiekenkamp合作论文数GFZ German Res Ctr Geosci, Helmholtz Ctr Potsdam2Schäfer Klaus合作论文数2
 Carsten Jahn合作论文数2Heiner Flessa合作论文数2K Schafer合作论文数1Williams K. Atakora合作论文数1Thomas Puetz合作论文数1christopher p konrad合作论文数1Michael H. Cosh合作论文数1nilsdemian landmeyer合作论文数1christoph bonecke合作论文数1Jan Fiedler合作论文数1
 Tobias K.D. Weber合作论文数1Sabine Jordan合作论文数1
 Shurong Liu (柳淑蓉)合作论文数School of Agriculture and Biotechnology, Sun Yat-sen University1
 Martin Maier合作论文数Department of Soil and Environment Forest Research Institute Baden‐Württemberg Freiburg1Eschenbach Wolfram合作论文数1H. Flessa合作论文数1
 Jurgen Augustin合作论文数Institute of Landscape Matter Dynamics, Leibniz-Centre for Agricultural Landscape and Land Use Research (ZALF),1Knut Meyer合作论文数1Wolfgang Walther合作论文数1
 Vytas Huth合作论文数Agrar - und;Umweltwissenschaftliche Fakultät, Universität Rostock;Agrar - und|Umweltwissenschaftliche Fakultät, Universität Rostock1
 Ulrike Hagemann合作论文数1
 Julien Tournebize合作论文数CEMAGREF1Arno Kanal合作论文数1
 Roland Bol合作论文数IBG3 Agrosphere Forschungszentrum Jülich1
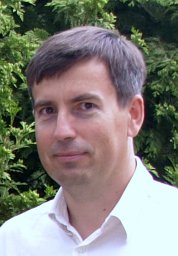 Jaak Truu合作论文数Institute of Molecular and Cell Biology, University of Tartu1
 Roland Fuß合作论文数1Lars Kutzbach合作论文数Institute of Botany and Landscape Ecology, Ernst Moritz Arndt University of Greifswald1
 Helmut Geistlinger合作论文数1
 Gerald Jurasinski合作论文数University of Rostock Landscape Ecology and Site Evaluation, Faculty of Agricultural and Environmental Sciences Justus-von-Liebig-Weg 6 18059 Rostock Germany1




