The TROPOspheric Monitoring Instrument (TROPOMI) on board the Sentinel-5 Precursor satellite provides daily global observations of atmospheric methane (CH4) and carbon monoxide (CO) at relatively high spatial resolution. The dense spatial and temporal coverage is achieved by the instrument’s wide swath, which permits detailed mapping of the worldwide distribution of these important atmospheric constituents. The adaptation and optimisation of the Weighting Function Modified Differential Optical Absorption Spectroscopy (WFMD) algorithm for the simultaneous retrieval of the column-averaged dry-air mole fractions XCH4 and XCO from TROPOMI’s shortwave infrared (SWIR) radiance measurements has proven to be a valuable complement and alternative to the operational TROPOMI products. The latest release of the TROPOMI/WFMD product (version 2.0) includes several improvements expanding its suitability for a wider range of scientific applications. Data yield at mid and high latitudes has increased, accompanied by improved accuracy and precision according to the validation with the ground-based Total Carbon Column Observing Network (TCCON). These advancements are primarily due to more refined quality filtering that has been accomplished by replacing the previous Random Forest Classifier with the more efficient and potentially higher performing Extreme Gradient Boosting (XGBoost) algorithm in conjunction with improved training data incorporating an updated cloud product from the Visible Infrared Imaging Radiometer Suite (VIIRS) and the TROPOMI Aerosol Index. This enhanced training data set enables more reliable identification of cloudy scenes and mitigates issues related to specific aerosol events over bright surfaces. Importantly, as with previous product versions, the actual quality classification does not depend on the real-time availability of these external data products, which are only required during the training phase.
Abstract Methane (CH4) is a potent greenhouse gas with high radiative forcing and a relatively short atmospheric lifetime of around a decade. We used a decade‐long data set (2011–2022) from the Fourier transform spectrometer at the California Laboratory for Atmospheric Remote Sensing (CLARS‐FTS) to quantify a dramatic increase in methane observed in 2020. We report a significant acceleration of the short‐term growth rate of 1.37 ± 0.20 ppb/month starting in 2020 until the end of 2021, a substantial increase relative to the near‐zero and negative rates of the preceding 4 years (2016–2019). The observed increase in methane concentrations in 2020 is of significant concern due to its potential contribution to global warming. The Total Carbon Column Observing Network (TCCON) is then used to examine the global geospatial variability of the increase in methane. The results suggest an approximately uniform rise in methane globally. Finally, results from a two‐box model used to simulate atmospheric chemical processes of methane production and loss indicate that changes in OH alone are insufficient to explain the rise in atmospheric methane. Recent data from 2022 suggest a deceleration in the methane growth rate, indicating a potential slowdown in the methane increase observed in 2020.
Urban areas are a major and growing contributor to anthropogenic greenhouse gas (GHG) emissions and are thus an important target for emission reduction efforts. However, measurement-based information for planning, implementing, and monitoring such reduction efforts on city scales is rarely available to policymakers and stakeholders. Such monitoring systems typically rely on three key components: measurements of GHG concentrations (or turbulent fluxes), modeling of the atmospheric transport and prior information on the spatial and/or temporal structure of the emissions. The high spatial and temporal heterogeneity of urban areas and their emissions is especially challenging for atmospheric transport models and gridded inventories, which are currently pushed to resolutions of kilometers and below in an effort to accurately represent these effects. However, GHG concentration measurements are often performed by in-situ systems and are thus not necessarily representative for the kilometer scales on which measurements, transport modeling and prior information are typically compiled. This becomes increasingly important with the ever-improving quality of measurements, models, and inventories themselves. We present a dataset of urban path averaged concentration measurements of CO2 and CH4 and their comparison to co-located in-situ measurements. The path averaged measurements are taken along a 1.55 km long path over the city of Heidelberg, Germany. The observatory utilizes FTIR spectroscopy and is now in continuous operation since February 2023. Analysis of the path averaged and co-located in-situ measurements reveals differences of up to 20 ppm in CO2 for specific wind directions, which are most likely a result of a local atmospheric transport phenomenon. Further, the two measurements show differences in CH4, which are likely a result of different sensitivities to local emissions. Overall, the data indicate a clear but different sensitivity of either measurement approach to localized source patterns. Thus, the dataset enables the assessment of the representativeness of the different measurement approaches and of the performance of atmospheric transport models and emission inventories in the urban environments.
Correct determination of the phase spectrum is a highly relevant task in Fourier transform spectrometry for concluding which spectral distribution most likely gave rise to the measured interferogram. We present implementation of an improved scheme for phase determination in the operational Collaborative Carbon Column Observing Network (COCCON) processor. We introduce a robust unwrapping scheme for retrieving a spectrally smooth phase spectrum at intermediate spectral resolution, which uses all spectral positions carrying enough signal to allow a significant determination of the phase. In the second step, we perform a least-squares fit of model parameters of a suitable analytical phase spectrum model through all reliable phase values constructed in the first step. The model fit exploits the fact that we expect the phase to be spectrally smooth. Still, it can be refined to reflect specific characteristics inherent to the optical and electronic layout of the interferometer. The proposed approach avoids the problems of the classical phase reconstruction method, which enforces a spectrally smooth phase by directly limiting spectral resolution when calculating the complex phase. Thereby, the phase is created from a very low number of interferogram points around the centerburst of the interferogram, which results in a suboptimal noise propagation from the interferogram into the spectral domain. Moreover, the interpolation of the phase spectrum across spectral subsections with reduced spectral signal is not well behaved, and results depend strongly on the numerical apodization function used for creating the low-resolution phase.
The Total Carbon Column Observing Network (TCCON) measures column-average mole fractions of several greenhouse gases (GHGs), beginning in 2004, from over 30 current or past measurement sites around the world using solar absorption spectroscopy in the near-infrared (near-IR) region. TCCON GHG data have been used extensively for multiple purposes, including in studies of the carbon cycle and anthropogenic emissions, as well as to validate and improve observations from space-based sensors. Here, we describe an update to the retrieval algorithm used to process the TCCON near-IR solar spectra and to generate the associated data products. This version, called GGG2020, was initially released in April 2022. It includes updates and improvements to all steps of the retrieval, including but not limited to the conversion of the original interferograms into spectra, the spectroscopic information used in the column retrieval, post hoc air mass dependence correction, and scaling to align with the calibration scales of in situ GHG measurements. All TCCON data are available through https://tccondata.org/ (last access: 22 April 2024) and are hosted on CaltechDATA (https://data.caltech.edu/, last access: 22 April 2024). Each TCCON site has a unique DOI for its data record. An archive of all the sites' data is also available with the DOI https://doi.org/10.14291/TCCON.GGG2020 (Total Carbon Column Observing Network (TCCON) Team, 2022). The hosted files are updated approximately monthly, and TCCON sites are required to deliver data to the archive no later than 1 year after acquisition. Full details of data locations are provided in the “Code and data availability” section.
In this study, we demonstrate the utility of available correlative measurements of carbon species to identify regional and local air mass characteristics as well as their associated source types. In particular, we combine different regression techniques and enhancement ratio algorithms with carbon monoxide (CO), carbon dioxide (CO2), and methane (CH4) total column abundance from 11 sites of the Total Carbon Column Observing Network (TCCON) to infer relative contributions of regional and local sources to each of these sites. The enhancement ratios provide a viable alternative to univariate measures of relationships between the trace gases that are insufficient in capturing source-type and transport signatures. Regional enhancements are estimated from the difference between bivariate regressions across a specific time window of observed total abundance of these species (BERr for bulk enhancement regression ratio) and inferred anomalies (AERr for anomaly enhancement regression ratio) associated with a site-specific background. Since BERr and AERr represent the bulk and local species enhancement ratio, respectively, its difference simply represents the site-specific regional component of these ratios. We can then compare these enhancements for CO2 and CH4 with CO to differentiate between combustion and non-combustion air masses. Our results show that while the regional and local influences in enhancements vary across sites, dominant characteristics are found to be consistent with previous studies over these sites and with bottom-up anthropogenic and fire emission inventories. The site in Pasadena shows a dominant local influence (> 60 %) across all species enhancement ratios, which appear to come from a mixture of biospheric and combustion activities. In contrast, Anmyeondo shows more regionally influenced (> 60 %) air masses associated with high-temperature and/or biofuel combustion activities. Ascension Island appears to only show a large regional influence (> 80 %) on CO / CO2 and CO / CH4, which is indicative of transported and combustion-related CO from the nearby African region, consistent with a sharp rise in column CO (3.51 +/- 0.43 % ppb yr(-1)) at this site. These methods have important applications to source analysis using spaceborne column retrievals of these species.
The Total Carbon Column Observing Network (TCCON) and the Infrared Working Group of the Network for the Detection of Atmospheric Composition Change (NDACC-IRWG) are two ground-based networks that provide the retrieved concentrations of up to 30 atmospheric trace gases, using solar absorption spectrometry. Both networks provide reference measurements for the validation of satellites and models. TCCON concentrates on long-lived greenhouse gases (GHGs) for carbon cycle studies and validation. The number of sites is limited, and the geographical coverage is uneven, covering mainly Europe and the USA. A better distribution of stations is desired to improve the representativeness of the data for various atmospheric conditions and surface conditions and to cover a large latitudinal distribution. The two successive Fiducial Reference Measurements for Greenhouse Gases European Space Agency projects (FRM4GHG and FRM4GHG2) aim at the assessment of several low-cost portable instruments for precise measurements of GHGs to complement the existing ground-based sites. Several types of low spectral resolution Fourier transform infrared (FTIR) spectrometers manufactured by Bruker, namely an EM27/SUN, a Vertex70, a fiber-coupled IRCube, and a Laser Heterodyne spectro-Radiometer (LHR) developed by UK Rutherford Appleton Laboratory are the participating instruments to achieve the Fiducial Reference Measurements (FRMs) status. Intensive side-by-side measurements were performed using all four instruments next to the Bruker IFS 125HR high spectral resolution FTIR, performing measurements in the NIR (TCCON configuration) and MIR (NDACC configuration) spectral range. The remote sensing measurements were complemented by AirCore launches, which provided in situ vertical profiles of target gases traceable to the World Meteorological Organization (WMO) reference scale. The results of the intercomparisons are shown and discussed. Except for the EM27/SUN, all other instruments, including the reference TCCON spectrometer, needed modifications during the campaign period. The EM27/SUN and the Vertex70 provided stable and precise measurements of the target gases during the campaign with quantified small biases. As part of the FRM4GHG project, one EM27/SUN is now used as a travel standard for the verification of column-integrated GHG measurements. The extension of the Vertex70 to the MIR provides the opportunity to retrieve additional concentrations of N2O, CH4, HCHO, and OCS. These MIR data products are comparable to the retrieval results from the high-resolution IFS 125HR spectrometer as operated by the NDACC. Our studies show the potential for such types of spectrometers to be used as a travel standard for the MIR species. An enclosure system with a compact solar tracker and meteorological station has been developed to house the low spectral resolution portable FTIR systems for performing solar absorption measurements. This helps the spectrometers to be mobile and enables autonomous operation, which will help to complement the TCCON and NDACC networks by extending the observational capabilities at new sites for the observation of GHGs and additional air quality gases. The development of the retrieval software allows comparable processing of the Vertex70 type of spectra as the EM27/SUN ones, therefore bringing them under the umbrella of the COllaborative Carbon Column Observing Network (COCCON). A self-assessment following the CEOS-FRM Maturity Matrix shows that the COCCON is able to provide GHG data products of FRM quality and can be used for either short-term campaigns or long-term measurements to complement the high-resolution FTIR networks.
Ammonia (NH3) and greenhouse gas (GHG) emissions are substantial contributors to C and N loss in composting. Lignite can increase N retention by absorbing NH4+ and NH3. However, the effects of co-composting on NH3 and GHG emissions in view of closing nutrient cycle are still poorly investigated. In the study, poultry litter was composted without (CK) or with lignite (T1) or dewatered lignite (T2), and their respective composts NH4+Com_CK, Com_T1, and Com_T2) were tested in a soil incubation to assess NH3 and GHG emission during composting and following soil utilization. The cumulative NH3 flux in T1 and T2 were reduced by 39.3% and 50.2%, while N2O emissions were increased by 7.5 and 15.6 times, relative to CK. The total GHG emission in T2 was reduced by 16.8% compared to CK. Lignite addition significantly increased nitrification and denitrification as evidenced by the increased abundances of amoA, amoB, nirK, and nirS. The increased reduction on NH3 emission by dewatered lignite could be attributed to reduced pH and enhanced cation exchangeable capacity than lignite. The increased N2O was related to enhanced nitrification and denitrification. In the soil incubation experiment, compost addition reduced NH3 emission by 72%∼83% while increased emissions of CO2 and N2O by 306%∼740% and 208%∼454%, compared with urea. Com_T2 strongly reduced NH3 and GHG emissions after soil amendment compared to Com_CK. Overall, dewatered lignite, as an effective additive, exhibits great potential to simultaneously mitigate NH3 and GHG secondary pollution during composting and subsequent utilization of manure composts.
<p>In Australia, increasing temperatures and prolonged drought periods lead to an intensification of wildfires. In particular, severe fires are expected to occur more frequently in Southeast Australia&#8217;s eucalyptus forests leading to strongly enhanced CO<sub>2</sub> emissions and preventing the renewed uptake of the released CO<sub>2</sub> by vegetation. However, current fire emission estimates presented by conventional fire emission databases show significant discrepancies in their emission estimates of extreme fire events like the Australian fire season 2019/2020.</p> <p>Here, we investigate the fire emissions released during the Australian summer 2019/2020 based on total column measurements of CO<sub>2</sub> and CO using the Lagrangian Particle Dispersion Model FLEXPART. We calculate footprints and backward trajectories of trace gases to inversely retrieve carbon emission estimates. In a first case study we focus on TCCON total column measurements of CO and CO<sub>2</sub> taken in Wollongong located close to the hot-spot of eucalyptus fires. As the measurements show a significant enhancement of all mentioned tracers during the fire event, FLEXPART is used to calculate emission estimates for southeast Australia. Furthermore, we retrieve emission factors between the trace gases. Our results are compared to the conventional databases like GFED, GFAS and FINN and emission estimates published by other studies.</p>
The National Institute for Environmental Studies has provided the column-averaged dry-air mole fraction of carbon dioxide and methane (XCO2 and XCH4) products (L2 products) obtained from the Greenhouse gases Observing SATellite (GOSAT) for more than a decade. Recently, we updated the retrieval algorithm used to produce the new L2 product, V03.00. The main changes from the previous version (V02) of the retrieval algorithm are the treatment of cirrus clouds, the degradation model of the Thermal And Near-infrared Spectrometer for carbon Observation–Fourier Transform Spectrometer (TANSO–FTS), solar irradiance spectra, and gas absorption coefficient tables. The retrieval results from the updated algorithm showed improvements in fitting accuracies in the O2 A, weak CO2, and CH4 bands of TANSO–FTS, although the residuals increase in the strong CO2 band over the ocean. The direct comparison of the new product obtained from the updated (V03) algorithm with the previous version V02.90/91 and the validations using the Total Carbon Column Observing Network revealed that the V03 algorithm increases the amount of data without diminishing the data qualities of XCO2 and XCH4 over land. However, the negative bias of XCO2 is larger than that of the previous version over the ocean, and bias correction is still necessary. Additionally, the V03 algorithm resolves the underestimation of the XCO2 growth rate compared with the in situ measurements over the ocean recently found using V02.90/91 and V02.95/96.
The Australian continent contributes substantially to the year-to-year variability of the global terrestrial carbon dioxide (CO 2 ) sink. However, the scarcity of in situ observations in remote areas prevents the deciphering of processes that force the CO 2 flux variability. In this study, by examining atmospheric CO 2 measurements from satellites in the period 2009–2018, we find recurrent end-of-dry-season CO 2 pulses over the Australian continent. These pulses largely control the year-to-year variability of Australia’s CO 2 balance. They cause two to three times larger seasonal variations compared with previous top-down inversions and bottom-up estimates. The pulses occur shortly after the onset of rainfall and are driven by enhanced soil respiration preceding photosynthetic uptake in Australia’s semiarid regions. The suggested continental-scale relevance of soil-rewetting processes has substantial implications for our understanding and modeling of global climate–carbon cycle feedbacks.
<p>Quantifying sources and sinks, as well as chemical activity of trace gases in the lower troposphere, requires accurate measurements of the concentrations of the species of interest. While there exist in-situ measurement techniques, which are highly accurate, point-like measurements are only sufficiently representative in the spatial domain for a small area. This holds true in particular in high-gradient environments, e.g., urban settings. Hence, measuring those concentrations averaged on the length scale of a few kilometers is desirable. Furthermore, quantifying emissions requires combining concentration measurements with regional transport models, which cover a comparable spatial resolution.</p> <p>We present a long open-path setup that measures average concentrations on the kilometer-scale in the urban boundary layer. Our setup, which is operational since March 2022, is based on a Bruker IFS 125 HR Fourier transform spectrometer, a commercially available spectrometer, which offers high resolution and throughput. The instrument choice provides flexible and explorative experimental setups such as variable and high spectral resolution and the extension of spectral coverage from the shortwave-infrared to the near ultra-violet spectral range. Here, we present the results on CO<sub>2</sub> and CH<sub>4</sub> from our 2022 measurement campaign as well as analysis of the diurnal variability in comparison to the prediction of local and regional transport models.</p>
The ATTO (Amazon Tall Tower Observatory) tower is a 325m tall tower located in the middle of the pristine Amazon rainforest. Since 2022, continuous greenhouse gas concentrations at different heights (4m, 42m, 81m, 150m, 273m, 321m) are monitored by use of a Spectronus FTIR-spectrometer, measuring CO2, CH4, CO, N2O and del13CO2 hourly, compliant to WMO/GAW standards. This unique measurement system is the first set up which measures greenhouse gases continuously until 325m above a tropical rainforest, which fill an important gap in the global continous observation network. The measurements can be used for regional and global modelling, and can be used for biosphere-atmosphere exchange flux estimates. In this presentation, we will show the main observations of the first year of data collection, and will present the typical daily cycles observed for the different gases at different heights.
One of the major challenges for the Australian feedlot and meat sectors is to have accurate and robust long-term greenhouse gas (GHG) emissions data. Long-term measurements of methane (CH4) emissions (2015–2017) were made at two Australian beef feedlots having different climates, cattle types, and management practices. Emissions were measured using the inverse-dispersion model (IDM) micrometeorological technique, using CH4 concentrations measured at the feedlots with a closed-path Fourier transform infrared spectroscopic technique (CP-FTIR). The emissions data were used to evaluate methods used by the Department of Climate Change, Energy, the Environment and Water to estimate CH4 emissions from feedlots in Australian national inventory calculations. Expressed as a CH4 yield (emissions per unit dry matter intake, DMI), the two feedlots had emissions of 13.1 and 18.9 g CH4 kg−1 DMI. The lower-emitting feedlot had emissions that were 30% lower than the national inventory calculations based on feed intakes, while the second feedlot had emissions that were similar to the inventory calculations. The accurate quantification of emissions from feedlots, as demonstrated as part of this study, is important for validating the national accounting methods and therefore the sector’s GHG emissions profile.
Accurate accounting of emissions and removals of CO2 is critical for the planning and verification of emission reduction targets in support of the Paris Agreement. Here, we present a pilot dataset of country-specific net carbon exchange (NCE; fossil plus terrestrial ecosystem fluxes) and terrestrial carbon stock changes aimed at informing countries' carbon budgets. These estimates are based on “top-down” NCE outputs from the v10 Orbiting Carbon Observatory (OCO-2) modeling intercomparison project (MIP), wherein an ensemble of inverse modeling groups conducted standardized experiments assimilating OCO-2 column-averaged dry-air mole fraction (XCO2) retrievals (ACOS v10), in situ CO2 measurements or combinations of these data. The v10 OCO-2 MIP NCE estimates are combined with “bottom-up” estimates of fossil fuel emissions and lateral carbon fluxes to estimate changes in terrestrial carbon stocks, which are impacted by anthropogenic and natural drivers. These flux and stock change estimates are reported annually (2015–2020) as both a global 1∘ × 1∘ gridded dataset and a country-level dataset and are available for download from the Committee on Earth Observation Satellites' (CEOS) website: https://doi.org/10.48588/npf6-sw92 (Byrne et al., 2022). Across the v10 OCO-2 MIP experiments, we obtain increases in the ensemble median terrestrial carbon stocks of 3.29–4.58 Pg CO2 yr−1 (0.90–1.25 Pg C yr−1). This is a result of broad increases in terrestrial carbon stocks across the northern extratropics, while the tropics generally have stock losses but with considerable regional variability and differences between v10 OCO-2 MIP experiments. We discuss the state of the science for tracking emissions and removals using top-down methods, including current limitations and future developments towards top-down monitoring and verification systems.
Column-averaged dry air mole fractions of carbon dioxide and methane (XCO2 and XCH4) retrieved from SWIR (Short-Wavelength InfraRed) observations by GOSAT (Greenhouse Gases Observing SATellite) since 2009 and its successor GOSAT-2 since 2019 are available from NIES (National Institute for Environmental Studies) as SWIR L2 (Level 2) products. This paper shows the current status of the data quality of NIES SWIR L2 products and inter-satellite comparison results. Comparisons of XCO2 and XCH4 obtained from each satellite with ground-based observations from the TCCON (Total Carbon Column Observing Network) reveal that the averaged single measurement precision are less than 1.9 ppm and 10 ppb, respectively, and the site-to-site biases are less than 0.9 ppm and 5 ppb, respectively. The standard deviations of the inter-satellite differences for XCO2 and XCH4 are 2.18 ppm and 12.1 ppb, respectively, on an individual-data basis and 1.77 ppm and 11.7 ppb, respectively, on a monthly-regional-mean basis. While further improvements in the retrieval algorithm and bias-correction method are needed, GOSAT and GOSAT-2 retrievals are generally in good agreement.
Monitoring the atmospheric concentrations of the greenhouse gases (GHG) carbon dioxide (CO2) and methane (CH4) is a key ingredient for fostering our understanding of the mechanisms behind the sources and sinks of these gases and for verifying and quantitatively attributing their anthropogenic emissions. Here, we present the instrumental setup and performance evaluation of an open-path GHG observatory in the city of Heidelberg, Germany. The observatory measures path-averaged concentrations of CO2 and CH4 along a 1.55 km path in the urban boundary layer above the city. We combine these open-path data with local in situ measurements to evaluate the representativeness of these observation types on the kilometer scale. This representativeness is necessary to accurately quantify emissions, since atmospheric models tasked with this job typically operate on kilometer-scale horizontal grids. For the operational period between 8 February and 11 July 2023, we find a precision of 2.7 ppm (0.58 %) and 18 ppb (0.89 %) for the dry-air mole fractions of CO2 (xCO2) and CH4 (xCH4) in 5 min measurements, respectively. After bias correction, the open-path measurements show excellent agreement with the local in situ data under atmospheric background conditions. Both datasets show clear signals of traffic CO2 emissions in the diurnal xCO2 cycle. However, there are particular situations, such as under southeasterly wind conditions, in which the in situ and open-path data reveal distinct differences up to 20 ppm in xCO2, most likely related to their different sensitivity to local emission and transport patterns. Our setup is based on a Bruker IFS 125HR Fourier transform spectrometer, which offers a spacious and modular design providing ample opportunities for future refinements of the technique with respect to finer spectral resolution and wider spectral coverage to provide information on gases such as carbon monoxide and nitrogen dioxide.
Black carbon (BC) aerosols significantly contribute to radiative budgets globally, however their actual contributions remain poorly constrained in many under-sampled ocean regions. The tropical waters north of Australia are a part of the Indo-Pacific warm pool, regarded as a heat engine of global climate, and are in proximity to large terrestrial sources of BC aerosols such as fossil fuel emissions, and biomass burning emissions from northern Australia. Despite this, measurements of marine aerosols, especially BC remain elusive, leading to large uncertainties and discrepancies in current chemistry-climate models for this region. Here, we report the first comprehensive measurements of aerosol properties collected over the tropical warm pool in Australian waters during a voyage in late 2019. The non-marine related aerosol emissions observed in the Arafura Sea region were more intense than in the Timor Sea marine region, as the Arafura Sea was subject to greater continental outflows. The median equivalent BC (eBC) concentration in the Arafura Sea (0.66 μg m-3) was slightly higher than that in the Timor Sea (0.49 μg m-3). Source apportionment modelling and back trajectory analysis and tracer studies consistently suggest fossil fuel combustion eBC (eBCff) was the dominant contributor to eBC across the entire voyage region, with biomass burning eBC (eBCbb) making significant additional contributions to eBC in the Arafura Sea. eBCff (possibly from ship emissions or oil and gas rigs and their associated activities) and cloud condensation nuclei (CCN) were robustly correlated in the Timor Sea data, whereas eBCbb positively correlated to CCN in the Arafura Sea, suggesting different sources and atmospheric processing pathways occurred in these two regions. This work demonstrates the substantial impact that fossil fuel and biomass burning emissions can have on the composition of aerosols and cloud processes in the remote tropical marine atmosphere, and their potentially significant contribution to the radiative balance of the rapidly warming Indo-Pacific warm pool.
Abstract. In this study, we employ a regional inverse modelling approach to estimate monthly carbon fluxes over the Australian continent for 2015–2019 using the assimilation of the total column-averaged mole fractions of carbon dioxide from the Orbiting Carbon Observatory-2 (OCO-2, version 9). Subsequently, we study the carbon cycle variations and relate their fluctuations to anomalies in vegetation productivity and climate drivers. Our five-year regional carbon flux inversion suggests that Australia was a carbon sink averaging −0.46 ± 0.08 PgC yr−1 (excluding fossil fuel emissions), largely influenced by a strong carbon uptake (−1.04 PgC yr−1) recorded in 2016. Australia semi-arid ecosystems, such as sparsely vegetated regions (in central Australia) and savanna (in northern Australia), were the main contributors to the carbon uptake in 2016. These regions showed relatively high vegetation productivity, high rainfall and low temperature in 2016. In contrast to the large carbon sink found in 2016, the large carbon outgassing recorded in 2019 coincides with an unprecedented deficit of rainfall and higher than average temperature across Australia. Comparison of the posterior column average CO2 concentration against the Total Carbon Column Observing Networks (TCCON) and in situ measurements offers limited insight into the fluxes assimilated with OCO-2. However, the lack of these monitoring stations across Australia, mainly over ecosystems such as the savanna and areas with sparse vegetation, impedes us from providing strong conclusions. Comparison of our flux inversion to the ensemble mean carbon flux of the OCO-2 Multi-model Intercomparison Project (MIP) (2015–2018) agrees with our findings, and their results also suggest that Australia was a strong carbon sink in 2016 (−0.73 ± 0.41 PgC yr−1). The analysis of the variability of the nine models that participate in the OCO-2 MIP also aligns with our findings, and it gives us the confidence to say that changes in rainfall and temperature drive most of the carbon flux variability across Australia.
Abstract. The thermal infrared nadir spectra of IASI (Infrared Atmospheric Sounding Interferometer) are successfully used for retrievals of different atmospheric trace gas profiles. However, these retrievals offer generally reduced information about the lowermost tropospheric layer due to the lack of thermal contrast close to the surface. Spectra of scattered solar radiation observed in the near-infrared and/or shortwave infrared, for instance by TROPOMI (TROPOspheric Monitoring Instrument), offer higher sensitivity near the ground and are used for the retrieval of total-column-averaged mixing ratios of a variety of atmospheric trace gases. Here we present a method for the synergetic use of IASI profile and TROPOMI total-column level 2 retrieval products. Our method uses the output of the individual retrievals and consists of linear algebra a posteriori calculations (i.e. calculation after the individual retrievals). We show that this approach has strong theoretical similarities to applying the spectra of the different sensors together in a single retrieval procedure but with the substantial advantage of being applicable to data generated with different individual retrieval processors, of being very time efficient, and of directly benefiting from the high quality and most recent improvements of the individual retrieval processors. We demonstrate the method exemplarily for atmospheric methane (CH4). We perform a theoretical evaluation and show that the a posteriori combination method yields a total-column-averaged CH4 product (XCH4) that conserves the good sensitivity of the corresponding TROPOMI product while merging it with the high-quality upper troposphere–lower stratosphere (UTLS) CH4 partial-column information of the corresponding IASI product. As a consequence, the combined product offers additional sensitivity for the tropospheric CH4 partial column, which is not provided by the individual TROPOMI nor the individual IASI product. The theoretically predicted synergetic effect is verified by comparisons to CH4 reference data obtained from collocated XCH4 measurements at 14 globally distributed TCCON (Total Carbon Column Observing Network) stations, CH4 profile measurements made by 36 individual AirCore soundings, and tropospheric CH4 data derived from continuous ground-based in situ observations made at two nearby Global Atmospheric Watch (GAW) mountain stations. The comparisons clearly demonstrate that the combined product can reliably detect the actual variations of atmospheric XCH4, CH4 in the UTLS, and CH4 in the troposphere. A similar good reliability for the latter is not achievable by the individual TROPOMI and IASI products.
 Nicholas M. Deutscher合作论文数School of Chemistry, University of Wollongong193
 Justus Notholt合作论文数Department of Physics, University of Bremen159
 Thorsten Warneke合作论文数110
 Isamu Morino合作论文数Earth System Division, Satellite Observation Center, National Institute for Environmental Studies98
 Ralf Sussmann合作论文数94
 Paul Wennberg合作论文数Ronald and Maxine Linde Center for Global Environmental Science, California Institute of Technology;Laboratory for the Study of Atmospheric Composition, California Institute of Technology94
 Nicholas Jones合作论文数Sch Phys, Univ Wollongong85
 Kimberly Strong合作论文数Department of Physics, Faculty of Arts and Science, University of Toronto76
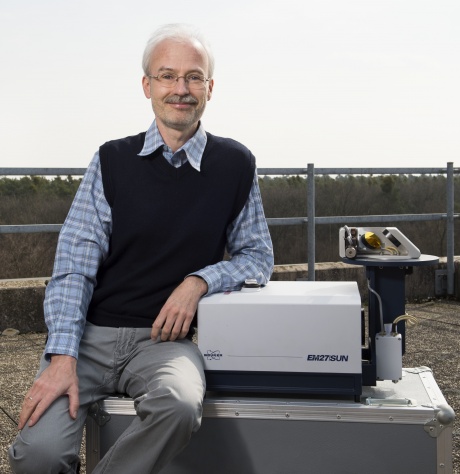 Frank Hase合作论文数Forschungszentrum Karlsruhe73
 Debra Wunch合作论文数Division of Geological and Planetary Sciences, California Institute of Technology73
 V. Velazco合作论文数Institute of Environmental Physics, University of Bremen71
 Rigel Kivi合作论文数Greenhouse Gases and Satellite Methods group, Finnish Meteorological Institute64Thomas Blumenstock合作论文数Institute of Meteorology and Climate Research, Karlsruhe Institute of Technology62v sherlock合作论文数51
 Matthias Schneider合作论文数47
 Dietrich G Feist合作论文数47Clare Paton-Walsh合作论文数46
 Coleen Roehl合作论文数Division of Geological and Planetary Sciences, California Institute of Technology44Emmanuel Mahieu合作论文数44Martine De Mazière合作论文数39
 David Pollard合作论文数Department of Earth and Planetary Sciences, Doerr School of Sustainability, Stanford University39C. Petri合作论文数37Yao Te合作论文数36
 Mahesh Kumar Sha合作论文数Royal Belgian Inst Space Aeron BIRA IASB35Geoffrey C. Toon合作论文数35
 Laura Iraci合作论文数Earth Science Division, Ames Research Center, National Aeronautics and Space Administration35Omaira García合作论文数Centro de Investigación Atmosférica de Izaña, Agencia Estatal de Meteorología35F. Hase合作论文数34Dan Smale合作论文数Natl Inst Water & Atmospher Res34Osamu Uchino合作论文数30
 Chris O'Dell合作论文数Cooperative Institute for Research in the Atmosphere, Colorado State University29
 Christian Frankenberg合作论文数Division of Geological and Planetary Sciences, California Institute of Technology;Jet Propulsion Laboratory29Markus Rettinger合作论文数28
 Kei Shiomi合作论文数28
 Hirofumi Ohyama合作论文数26
 Stephen R Wilson合作论文数Phys & Theoret Chem Lab, Univ Oxford25
 Ronald Cantoria Macatangay合作论文数Institute of Environmental Science and Meteorology, University of the Philippines;Natural Sciences Research Institute, University of the Philippines;University of the Philippines, University of the Philippines24
 Mathias Palm合作论文数23
 Manvendra Dubey合作论文数Los Alamos National Laboratory;Physics Department, New Mexico Institute of Mining and Technology23
 Kiel Matthäus合作论文数Department of Epileptology, University of Bonn22I. Aben合作论文数22
 David Crisp合作论文数Jet Propulsion Laboratory, California Institute of Technology;NASA22
 John P. Burrows合作论文数Institutes of Environmental Physics and Remote Sensing, University of Bremen22
 O. T. Denmead合作论文数Centre for Environmental Mechanics CSIRO G.P.O. Box 821 2601 Canberra A.C.T. Australia22
 Hartmut Bösch合作论文数Institute for Environmental Physics, FB1, University of Bremen21Janina Messerschmidt合作论文数21
 Michael Buchwitz合作论文数Institute of Environmental Physics, University of Bremen21




