Ground surface temperature (GST) is an essential boundary condition for permafrost modeling and satellite-product evaluation, yet high-frequency, multi-year GST observations on the Qinghai-Tibet Plateau (QTP) remain sparse, particularly within the interior continuous permafrost zone. Here we present a publicly available dataset of half-hourly GST measured at 24 sites in the Wudaoliang region of the central QTP. The network spans three dominant alpine land-cover types (alpine desert, alpine steppe, and alpine meadow) and elevations of 4,543-4,741 m a.s.l. HOBO temperature loggers were installed at 3-5 cm depth and recorded GST at 30-minute intervals from September 2019 to September 2023. The time series were quality controlled using physical-range screening and change-point checks, and disturbance-affected segments associated with frost-jacking were removed, yielding 1,399,008 valid records. The release includes quality-controlled GST time series, site-level metadata and a traceable exclusion log. This dataset supports reuse for the site- and grid-scale evaluation and calibration of satellite land surface temperature and freeze-thaw products, as well as studies of near-surface ground thermal dynamics in high-elevation permafrost regions.
Surface heat sources play a critical role in shaping meteorological conditions and permafrost dynamics on the Tibetan Plateau. To better understand surface heat source variability in the permafrost region, multiyear observational data from an isolated permafrost site and a continuous permafrost site were used to analyse the variability. The results indicated that the surface heat source at the isolated permafrost site remained relatively stable, whereas that at the continuous permafrost site increased significantly, at a rate of approximately 2.2 Wm−2yr−1. The proportions of sensible and latent heat fluxes in the surface heat source budget varied with the season. Overall, the proportion of latent heat flux was greater than that of sensible heat flux in summer and autumn, whereas the proportion of sensible heat flux was greater than that of latent heat flux in winter and spring. The peak proportion for both fluxes exceeded 80%. A random forest model effectively captured the variations in the surface heat source. And the machine learning simulation indicated that soil temperature, downward shortwave radiation and albedo were identified as major contributors to the surface heat source, collectively accounting for more than 88% of the overall variability at both sites. The impacts of snow cover on the surface heat source varied with intensity. The increasing trend of the surface heat source was closely related to climate warming in autumn and winter. A significant but weak positive correlation was observed between vegetation and the surface heat source.
Abstract An up-to-date vegetation map is essential for characterizing current ecosystem conditions in the source regions of the Yangtze and Yellow Rivers (SRYYR) under ongoing climate change. Here, we release a region-specific 30 m vegetation type dataset that represents typical conditions in the early 2020s. The map was created using systematic ground survey data from 1,168 georeferenced sites collected from 2020 to 2025. A random forest classifier was trained using Landsat imagery and environmental predictors to generate the vegetation type map. Sample representativeness was quantified by comparing predictor distributions between survey sites and the study area. The Euclidean distance ranged from 2.99% to 8.85% and Pearson’s r from 0.59 to 0.97. The final map had an overall accuracy of 79.56% and a Cohen’s kappa of 0.74. Unlike existing plateau-wide products, this dataset explicitly delineates alpine swamp meadows (ASMs) and improves the spatial representation of alpine shrublands (ASHs), providing an updated baseline for permafrost–vegetation coupling and related ecohydrological processes in the SRYYR.
Abstract. Ground surface deformation in permafrost terrain provides critical information on heat and mass transfer during soil freezing and thawing, and serves as a key indicator of permafrost dynamics. However, continuous observations at minute-scale resolution remain extremely rare, sub-daily deformation processes are still poorly documented, and the consistency among remote sensing, contact, and non-contact in situ measurements has not been systematically evaluated. To address these gaps, we established an intensively instrumented permafrost deformation monitoring supersite in an alpine meadow on the central Tibetan Plateau. Ground surface deformation was measured using collocated linear variable differential transformer (LVDT) sensors, ultrasonic ranging, GNSS interferometric reflectometry (GNSS-IR), and Sentinel-1 SBAS-InSAR, together with multi-layer soil temperature and moisture observations. Automated LVDT-based observations provided continuous 5 min deformation records with sub-millimetre precision from 2022 to 2026, thereby resolving, for the first time, sub-daily deformation processes across different freeze–thaw stages. Results show that active layer thaw settlement commonly develops in a stepwise manner within a day, whereas late-thaw-season subsidence associated with excess ground ice melt is more continuous, reflecting sustained drainage and compression. This process also gives rise to a breakpoint-style acceleration in subsidence during the late thaw season. The sub-daily record further clarifies the origin of short-lived late-winter heave events, which are most consistent with infiltration and rapid refreezing of liquid water in shallow soil. The four deformation datasets show broadly consistent temporal patterns. LVDT and InSAR agree closely (r = 0.91), whereas GNSS-IR and ultrasonic ranging show even stronger agreement (r = 0.96). InSAR maintains strong agreement with the other observation methods in both the freezing and thawing seasons, with correlation coefficients consistently exceeding 0.86. GNSS-IR and ultrasonic ranging are more affected by snow and vegetation and require substantial filtering, making them more suitable for seasonal- to multi-year monitoring than for resolving subtle sub-daily signals. At our site, settlement during the active layer thaw stage is strongly correlated with the square root of thawing degree days across all four thaw seasons (R2 > 0.96), and ice–water phase change within the active layer can explain more than 78 % of the observed seasonal deformation. These results provide a valuable observational benchmark for permafrost deformation from sub-daily to multi-year timescales and support improved process-based modelling and interpretation of GNSS-IR and InSAR observations in permafrost regions.
Abstract. Active layer moisture (ALM) plays a fundamental role in regulating the hydrothermal dynamics, freeze–thaw processes, carbon cycling, and ecosystem and load-bearing functions of permafrost. However, spatially continuous, high-resolution datasets that characterize soil moisture across the entire active layer remain largely unavailable for the Qinghai–Tibet Plateau (QTP), which hosts the largest low- to mid-latitude permafrost region globally. Here, we present the first 90 m resolution, spatially complete dataset of ALM – the depth-averaged volumetric water content of the entire active layer – for the entire permafrost region of the QTP. The dataset was produced by integrating 342 in situ samples collected during peak-thaw seasons from 2009 to 2024 with multi-source remote sensing environmental predictors, topographic factors, and soil physicochemical properties. Four ensemble machine learning models, include Random Forest, Extra Trees, XGBoost, and CatBoost, were trained, and a bias-aware multi-model fusion strategy was applied to generate the final ALM product. SHAP-based recursive feature elimination was used to identify the dominant environmental controls and optimize feature selection. Random five-fold cross-validation showed high apparent accuracy (R² =0.62–0.63, RMSE ≈ 0.08 m³ m⁻³), and a group-based spatial cross-validation provided a conservative transferability estimate (pooled R² = 0.30–0.38). Within the permafrost region, ALM ranges from 0.02 to 0.70 m³ m⁻³, with a mean of 0.21 m³ m⁻³ and a standard deviation of 0.09 m³ m⁻³, exhibiting a distinct southeast-to-northwest decreasing gradient. The dataset is freely available with DOI: https://doi.org/10.12072/ncdc.permafrost.db7312.2026. The dataset is accompanied by an area-of-applicability (AOA) mask delineating the region – approximately 60 % of the permafrost region – where the cross-validated performance can be expected to hold, together with per-pixel uncertainty estimates derived from the DI–RMSE relationship and the divergence among the four models.
Permafrost thickness serves as a critical indicator of hydrogeological conditions in cold regions and significantly influences the safety of engineering infrastructure. Due to the combined effects of climate, ecology, and human activities, the thermal characteristics and spatial distribution of permafrost in the Greater and Lesser Khingan Mountains of Northeast China exhibit high complexity, rendering existing permafrost thickness estimation methods largely inapplicable in this region. We developed an integrated estimation framework that bridges the gap between limited deep ground temperature measurements and regional-scale mapping. To overcome the scarcity of deep borehole (>20m) data, a physical-statistical inversion method was employed to derive permafrost base depths from shallow borehole temperature profiles, thereby expanding the foundational dataset to 104 representative sites. Integrating these ground observations with satellite-derived products (e.g., MODIS NDVI) and auxiliary environmental covariates (e.g., DEM-based topography and gridded climatic data), a Random Forest algorithm (RF) was applied to generate a 1 km-resolution permafrost thickness distribution map across Northeast China with a classification accuracy of 0.74. The results indicate that the average permafrost thickness in the study area is 47.71 ± 10 m, exhibiting a spatial pattern of thicker in the north and west, thinner in the south and east, and greater in mountainous areas than in plains. The top three influencing factors of permafrost thickness are atmospheric precipitation, surface thawing degree days (TDDs), and topographic position index (TPI), revealing that the thickness of discontinuous permafrost in northeastern China is primarily governed by local factors such as soil moisture, represented by the thick permafrost existed under a small patch of ground surface. This study provides a new methodological framework for estimating permafrost thickness in regions with limited ground temperature gradient measurement in deep boreholes.
The functioning and vulnerability of permafrost are largely determined by near-surface ground ice content. However, high-quality, grid-based ground ice maps for the Northern Hemisphere are currently unavailable. This study presents the first 1-km resolution grid-based ground ice map within 5 m below the permafrost table across the Northern Hemisphere. The map integrates an unprecedented amount (1178 boreholes) of field measurement for volumetric ice content (VIC) and multisource geospatial data, especially paleoclimate, remote sensing data, and surficial geology units, using Copula-Embedded Bayesian Model Averaging (COP-BMA) techniques with multiple machine learning models and 200 ensemble simulations. The validation indicates relatively low errors (R2 = 0.86, RMSE = 7.08%VIC, bias = 0.02%VIC), while the uncertainty, represented by the 95% prediction interval (PI), is 16.08% ± 3.55%VIC. The map indicates that the total ice storage of near-surface permafrost across the Northern Hemisphere is approximately 54,600 km3 (47,800-62,300 km3), about twice the value from the International Permafrost Association map. This difference may be due to, but is not limited to, advancements in mapping techniques, the integration of additional measurement data, and improved spatial resolution. High VIC (>80%) is predominantly concentrated in low-lying plains, wetlands, and marshes. In contrast, mountainous regions, including the Qinghai-Xizang Plateau and Mongolian Plateau, exhibit lower VIC, typically ranging from 20% to 40%. The new ground ice map exhibits a spatial pattern that is largely consistent with previous maps while providing enhanced spatial detail. This high-resolution map serves as a benchmark for tracing permafrost changes and assessing impacts on climate, hydrology, ecosystems, and infrastructure in permafrost regions.
Depth-resolved soil moisture is hard to obtain at basin scale because satellites sense only the upper few centimeters and field profiles are sparse. We use Earth-observation (EO) predictors with limited profile data to map volumetric water content (VWC) at 10-cm intervals from 0-1 m in a permafrost-affected basin. The pipeline benchmarks tree ensembles and then applies Shapley Additive Explanations (SHAP)-guided selection to build a compact 12-predictor Extra Trees model, followed by block-wise mapping on 30-m grids. On an external 10% hold-out, the model achieves R-2 = 0.85 and RMSE = 0.08 L/L, with > 80% of residuals within +/- 0.10 L/L. Skill is stable through most layers but degrades at 90-100 cm, reflecting limited test support and weaker surface constraint at depth. SHAP attribution identifies permafrost presence, wetland extent, vegetation greenness, and terrain metrics as leading controls, with surface influences weaken below 50 cm. Residual diagnostics show no pronounced distance-to-river shift in residual centroids and no significant spatial clustering in site-mean residuals (Moran's I). The resulting GIS-ready GeoTIFFs provide depth-layered, climatology-consistent thaw-season VWC patterns that complement coarse satellite soil-moisture products by resolving subsurface heterogeneity.
The warming and thawing of ice-rich permafrost present major challenges for the stability of linear infrastructure across cold regions. The Qinghai-Tibet Railway (QTR) and Highway (QTH), two critical transportation corridors on the Qinghai-Tibet Plateau, traverse extensive warm and ice-rich permafrost where maintaining long-term embankment stability has become a complex engineering challenge. A systematic evaluation of roadway stability and the effectiveness of engineered cooling measures is essential for ensuring safe operation and for guiding maintenance strategies. However, comprehensive route-scale assessments remain scarce due to the lack of suitable evaluation methods. In this study, we provide the first systematic assessment of the stability of similar to 890 km of the QTR and QTH and the effectiveness of cooling engineering measures based on ground deformation through Sentinel-1 SBAS-InSAR monitoring. The performance of cooling measures is quantified by comparing deformation between road surface and adjacent natural terrain, and the dominant environmental and engineering controls on deformation variability are identified. Results reveal that geomorphological and ground thermal conditions strongly govern permafrost terrain deformation, with unstable segments concentrated where ground temperatures approach 0 degrees C, particularly across lacustrine plains and fluvial terraces. Overall, 92.8 % of the QTR and 86.7 % of the QTH do not exhibit worsening deformation compared to the surrounding natural terrain in both seasonal deformation and long-term velocities and QTR exhibits better stability and maintenance status than QTH. Approximately 15 km of QTH segments and 11 km of QTR segments exhibit long-term settlement rates more than 5 mm/a greater than those of nearby natural terrain. Cooling measures markedly suppress seasonal deformation, with only 9 km of QTH segments showing seasonal deformation exceeding adjacent natural terrain by more than 5 mm. This study provides a systematic framework for assessing route-scale transportation stability and the performance of cooling engineering measures in permafrost terrains, providing guidance for long-term maintenance and future engineering works.
Most existing studies provide coarse spatial resolution mappings(typically 1 km or more),which fail to capture local-scale heterogeneity of permafrost distribution in the permafrost boundary region.This study employed 298 ground-truth samples to evaluate six machine learning(ML)algorithms for simulating permafrost distribution in the Genhe River Basin(GRB)of the Greater Khingan Mountains(GKM)based on our detailed investigation(e.g.,16 boreholes)in this region conducted in 2023-2024,while identifying key environmental drivers through Shapley Additive Explanations(SHAP)analysis.Results show that the random forest(RF)model achieved the best performance,with a classification accuracy of 0.83 and a Kappa coefficient of 0.66.The RF-based permafrost map at a 30 m resolution reveals a total permafrost area of approximately 8248.5 km2,accounting for 52.0%of the GRB.The most influential predictors of permafrost distribution are slope(SLO),topographic wetness index(TWI),and degree of topographic relief(DTR),contributing 13.6%,11.1%,and 9.4%,respectively.Other important factors include normalized difference water index(NDWI,6.8%)and land surface temperature(LST,6.1%).Permafrost is mainly distributed in valley bottoms,toe slopes,and gently sloping areas in the upper and middle reaches of the basin.These zones are closely associated with vegetation types such as wetlands,shrubs,and larch forests.Conversely,permafrost is rarely found in croplands or on steep slopes.These findings improve the understanding of permafrost distribution patterns in the transitional zone of Northeast China,and offer critical data and methodological support for high-resolution permafrost mapping across the region.
Extensive ground ice is a defining feature of permafrost regions. Climate warming degrades permafrost by thawing subsurface ice, altering water and heat transfer, and triggering ground subsidence, thermokarst development, and infrastructure instability. Accurately simulating ground ice dynamics and the resulting frost heave and thaw settlement is therefore a central challenge in predicting permafrost degradation and its environmental and hydrological consequences. Although numerical models have made substantial progress in representing coupled thermo-hydro-mechanical processes in frozen ground, considerable discrepancies persist in their accuracy and predictive performance. These discrepancies largely arise from the diverse and often over-simplified ways used to parameterize ground ice, including its initial abundance, phase-change behaviour, moisture redistribution, excess-ice thaw, segregated-ice formation, and contribution to surface deformation. This study presents a systematic review of model representations and parameterization schemes for ground ice processes, highlighting their importance for improving the performance and reliability of permafrost models. It first summarizes how ground ice processes are represented in numerical models, with particular emphasis on different treatments of ground ice formation and degradation mechanisms. It then synthesizes existing model-based simulations of surface deformation associated with ground ice changes. Finally, the review identifies key limitations in current approaches and outlines priorities for future model development, including improved parameterization of ground ice, integration of multi-source observational data, advances in parameter inversion techniques, enhanced thermo-hydro-mechanical coupling, and the application of artificial intelligence for automated parameter calibration. The overarching aim is to strengthen the theoretical foundation for understanding permafrost dynamics and to improve the reliability of model-based predictions.
Study region: Eastern Kunlun Range of the Tibetan Plateau, situated in the westerlies-monsoon transition zone, has experienced significant hydrological changes in recent decades. Rapid lake expansion together with GRACE-derived terrestrial water storage anomalies indicate the largest regional water gain on the Plateau. Study focus: To assess lake budgets and contributing components, three major endorheic basins were investigated from both lake water balance and basin-scale mass balance perspectives. Lake volume variations were derived from ICESat-1/2 altimetry and Landsat-based area; permafrost meltwater was quantified using SBAS-InSAR-derived ground deformation from ascending and descending Sentinel-1 data; glacier mass balance was estimated from TanDEM-X and SRTM DEM differencing, validated by ICESat-2; and GRACE mascon products quantified basin-scale water storage. New hydrological insights for the region: Results show accelerated lake expansion since the early 2010s. From 2017-2022, lake volumes rose by 397.3 f 10.0, 375.9 f 14.5, and 143.7 f 5.6 x 10⁶ m3/yr in the Ayakkum, Aqikkule, and Jingyu lake basins, respectively. Permafrost thaw supplied 54.9 f 12.0, 32.3 f 5.5, and 15.6 f 3.8 x 10⁶ m3/yr, accounting for 8.6 %-13.8 % of lake gains. In contrast, glaciers exhibit near-equilibrium to slightly positive storage tendencies, indicating a limited contribution from excess glacier-meltwater runoff. Both the lake-based water-balance closure and the GRACE-constrained watershed-scale mass balance consistently identify enhanced basin-wide net precipitation as the dominant driver of recent lake expansion.
Reliable near-surface air temperature (Ta) over the Qinghai-Tibetan Plateau is critical for energy balance closure, cryosphere assessment, and land-atmosphere modeling, yet complex relief and sparse gauges challenge gridded fields. We build a daily, lineage-spanning benchmark across 20 research-grade stations to evaluate five representative datasets-global land reanalysis, observation-conditioned regional fusions, and recent kilometerscale, observation-based interpolations-under a unified collocation. Performance is stratified by eco-climatic zone (HI/HII), ground-thermal state (permafrost/seasonally frozen), and 500-m elevation bands. Observationconditioned fields outperform the purely model-driven ERA5-Land reanalysis at the daily scale; the reanalysis shows a pervasive cold bias, strongest in HII winter. Elevation composites indicate rising R2 and shrinking MAE from 3.0 to 4.5 km, with winter weakest seasonally. A lightweight two-stage correction-regime-aware height normalization (gamma) followed by quantile mapping-cuts MAE by 0.5-2.0 degrees C and removes height-dependent cold bias. A unitless usability matrix translates multi-metric skill into scene-specific guidance by season-zone-elevation, offering an operational pathway to select and minimally correct TP Ta forcings transferable to other high-relief regions.
Accurately evaluating the formation and expansion of thermokarst lakes is crucial for ecological protection and engineering applications in permafrost regions. However, existing extraction methods exhibit significant biases, particularly in misclassifying snow-covered depressions as thermokarst lakes due to their similar spectral signatures in optical imagery. In this study, we selected the Three Rivers Source Region (TRSR) of the Qinghai-Tibet Plateau (QTP) as the study area and utilized Sentinel-1 SAR images as the data source. Firstly, we constructed a thermokarst lake boundary extraction method based on Google Earth Engine (GEE), specifically employing a support vector machine (SVM) coupled with the dynamic threshold method (OTSU). The accuracy of this method was compared and verified against the index method (Sentinel-1 Dual-Polarized Water Index, SDWI), OTSU, SVM, object-based approaches, and RF coupled Edge-OTSU. The results demonstrate that the SVM coupled Edge-OTSU is more accurate and yields the highest precision for extracting the boundaries of thermokarst lakes, achieving an overall accuracy and F1 score of 95.87% and 0.93, respectively. We then applied this method to extract thermokarst lakes in the TRSR from 2015 to 2024. A total of 31,800 thermokarst lakes were identified in 2024, covering an area of 1064.30 km2. These lakes are primarily distributed in the northwest and central hinterland of the TRSR and are predominantly small lakes (< 0.1 km2). From 2015 to 2024, both the area and number of thermokarst lakes in the TRSR exhibited an increasing trend. Thermokarst lake area showed positive correlations with temperature, precipitation, and snowmelt, and negative correlations with evapotranspiration and snowfall. Overall, our study established a novel, high-precision extraction method for thermokarst lakes and provided insights into the changes in thermokarst lakes and their main influencing factors in the TRSR from 2015 to 2024.
 Guojie Hu (胡国杰)合作论文数109
 Lin Zhao (赵林)合作论文数School of Geographical Sciences, Nanjing University of Information Science & Technology83
 Tonghua Wu (吴通华)合作论文数中国科学院寒区旱区环境与工程研究所82Xiaodong Wu (吴晓东)合作论文数77Guangyue Liu合作论文数65Erji Du合作论文数61Ren Li (李韧)合作论文数49Yao Xiao合作论文数State Key Laboratory of Cryospheric Sciences, Cold and Arid Regions Environmental and Engineering Research Institute, Chinese Academy of Sciences47
 Lingxiao Wang (汪凌霄)合作论文数School of Geographical Sciences, Nanjing University of Information Science & Technology40YongPing Qiao (乔永平)合作论文数State Key Laboratory of Cryosphere Science, Northwest Institute of Eco-Environment and Resources, Chinese Academy of Sciences39
 Xiaofan Zhu (朱小凡)合作论文数Northwest Institute of Eco-Environment and Resources, Chinese Academy of Sciences;University of Chinese Academy of Sciences31Shibo Liu合作论文数30
 lin zhao (赵林)合作论文数Northwest Institute of Eco-Environment and Resources, Chinese Academy of Sciences;Cold and Arid Regions Environmental and Engineering Research Institute,Chinese Academy of Sciences;University of Chinese Academy of Sciences30Changwei Xie (谢昌卫)合作论文数28Huayun Zhou合作论文数Cold and Arid Regions Environmental and Engineering Research Institute, Chinese Academy of Sciences24Zanpin Xing合作论文数22Qiangqiang Pang合作论文数22
 Zhe Sun (孙喆)合作论文数National Synchrotron Radiation Laboratory, University of Science and Technology of China21
 Yonghua Zhao (赵永华)合作论文数School of Land Engineering, Chang'an University18
 Wangping Li合作论文数17Jianzong Shi合作论文数16Jie Chen (陈杰)合作论文数Northwest Institute of Eco-Environment and Resources, Chinese Academy of Sciences;University of Chinese Academy of Sciences14
 Dong Wang合作论文数13Zhiwei Wang合作论文数13
 Liu Yadong合作论文数13
 Junming Hao合作论文数12Xianhua Wei合作论文数12Jie Ni合作论文数12GuangYang Yue合作论文数12
 Jianting Zhao合作论文数Sch Geog Sci, Nanjing Univ Informat Sci & Technol11
 Yuxin Zhang合作论文数11
 Yu Sheng (盛煜)合作论文数Northwest Institute of Eco-Environment and Resources, Chinese Academy of Sciences11Yanhui Qin合作论文数10Yuanwei Wang (汪远伟)合作论文数9Ren Li合作论文数Institute of Information Engineering, Chinese Academy of Sciences9Jimin Yao (姚济敏)合作论文数Northwest Institute of Eco-Environment and Resources, Chinese Academy of Sciences;University of Chinese Academy of Sciences8Xiangfei Li合作论文数7Amin Wen合作论文数6
 Lele Zhang (张乐乐)合作论文数Institute of Geophysics and Geomatics, China University of Geosciences6
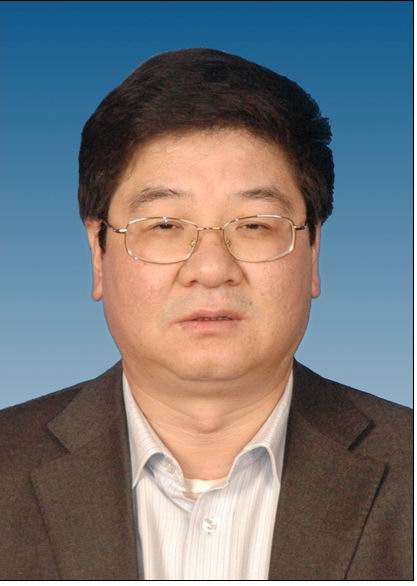 Yongjian Ding (丁永建)合作论文数Northwest Institute of Eco-Environment and Resources, Chinese Academy of Sciences;Cold and Arid Regions Environmental and Engineering Research Institute, Chinese Academy of Sciences6Wu Wang合作论文数6
 Guodong Cheng (程国栋)合作论文数Northwest Institute of Eco-Environment and Resources, Chinese Academy of Sciences;University of Chinese Academy of Sciences6A. Dashtseren合作论文数Institute of Observational Research for Global Change6Xuchun Yan合作论文数5
 Jiao Yongliang合作论文数5Lu Ma合作论文数5
 Wenxin Zhang合作论文数Department of Geosciences and Natural Resource Management, Faculty of Science, University of Copenhagen;Lund University5Yang Sizhong合作论文数5
 Tianjie Zhao (赵天杰)合作论文数National Key Laboratory of Remote Sensing and Digital Earth, Aerospace Information Research Institute, Chinese Academy of Sciences;University of Chinese Academy of Sciences5




