The Cook's distance is commonly used to identify inconsistent observations as these may be outliers resulting from a contamination of the sample. The Cook's distance is a standardized measure combining leverage and residual of an observation whose distribution depends only on the sample size n and the number of predictors p . In this article, we present the distribution of the Cook's distance as a function of n and p . This distribution is not available in closed form, but R and python scripts are given that estimate quantiles of the distribution using numerical integration techniques. Tables are also given for the upper 5%, 1%, and 0.1% values (that is, the 95%, 99%, and 99.9% quantiles). These thresholds are commonly used as cutoff for outlier identification. Past heuristics providing critical values are compared to the exact critical values. Identifying outlying contaminants is important because when unnoticed, their presence may distort statistical results and mask important signals, potentially leading to inappropriate decisions and actions. Herein the results allow determining accurately the probability of outliers assuming no contamination and can be used to set decision thresholds based on a priori levels of significance.
Background & Aims The present two studies investigated the role of spatial cognition in statistics anxiety. The hypothesis that spatial representations and/or visuospatial skills are related to the acquisition of statistics abilities which, when lacking or unused, generate statistics anxiety is examined.Materials & Methods To this end, a total of 680 students in Social Sciences from 14 different universities located in one of three countries enrolled in a statistics class at the time of the study were recruited. Study 1 examined a mediation model where visuospatial and verbal working memory (WM) spans as well as spatial anxiety are predictors of statistics anxiety with mathematics anxiety as the mediator.Results The results show a partial mediation and strong associations between all three types of anxiety (i.e., spatial anxiety, mathematics anxiety and statistics anxiety). The subscale statistics interpretation anxiety was best predicted by visuospatial WM span. Study 2 examined a path regression model where performance on a spatial and a verbal task along with spatial anxiety are predictors of statistics anxiety.Discussion The results indicate that the mental manipulation subscale of spatial skills is a strong predictor of mental manipulation anxiety which, in turn, predicts interpretation anxiety in statistics.Conclusion Both studies support the role of spatial cognition in statistics understanding. These results have implications for the teaching and learning of statistics.
Purpose: This research investigated factors affecting statistics anxiety in university students to find out whether perfectionists are at greater risk of experiencing it. This topic is known to be amongst the most anxiety-provoking matter among undergraduate students in the social sciences, humanities, and psychology. Herein, we sought to better characterize the aims and strivings of subgroups of students with regard to statistics. Participants and Methods: A final sample of 210 participants answered questionnaires measuring statistics anxiety, perfectionism and excellencism, academic goals, emotion regulation strategies, attitude towards statistics, and statistical ability. Results: The results show that participants better able to discriminate affirmations of flawlessness from affirmations of excellence report lower anxiety in interpreting statistics. Excellencists endorse more mastery-oriented academic goals, less avoidance-oriented goals, and favor adaptive emotion regulation strategies. Profile analysis shows that for the perfectionism-oriented profile, anxiety to interpret statistics correlates positively with avoidance goals whereas for excellencists, it correlates negatively with mastery goals. Further, excellencists who show high anxiety to interpret statistics tend to use less adaptive emotion regulations strategies while perfectionists tend to use more maladaptive emotion regulation strategies. Conclusion: One outstanding result is that discriminating flawless wordings from wordings aiming at excellence is a main determinant in keeping positive attitude in anxiety-triggering courses.
To this date, few standardized tests measuring students' performance with regards to statistics exist. Only four tests have been proposed for college or university students. The goal of the present study is to investigate these tests. University professors or instructors experienced in teaching statistics were asked to list the concepts they think are being assessed by each item of the tests. A total of 708 responses were obtained from 42 participants. Using thematic analysis, 18 fundamental statistical concepts were identified. Unplanned analyses on participants' scores were also computed. The results suggest that there is no consensus on some of the items' correct answers. The study has practical implications for teaching statistics, from learning goals to assessment methods.
Null hypothesis statistical testing (NHST) is typically taught by first posing a null hypothesis and an alternative hypothesis. This conception is sadly erroneous as there is no alternative hypothesis in the NHST. This misconception generated erroneous interpretations of the NHST procedures, and the fallacies that were deduced from this misconception attracted much attention in deterring the use of NHST. Herein, it is reminded that there is just one hypothesis in these procedures. Additionally, procedures accompanied by a power analysis and a threshold for type-II errors are actually a different inferential procedure that could be called dual hypotheses statistical testing (DHST). The source of confusions in teaching NHST may be found in Aristotle's axiom of excluded middle. In empirical sciences, in addition to the falsity or veracity of assertions, we must consider the inconclusiveness of observations, which is what is rejected by the NHST.
Previous research has shown that perfectionism was negatively associated with the generation of original ideas in Divergent Thinking (DT) tasks, while striving for excellence was positively associated with it. However, the explanatory variables for these effects remain unclear. This study investigated the mediating roles of doubts about actions, concerns over mistakes, openness to experience, empathy, and emotions during DT tasks. Additionally, it examined an emotional DT task (i.e., naming frustrating things and things that affect one’s self-esteem). From a sample of n = 282 university students, we replicated the negative association between perfectionism and DT abilities, though the effect size was smaller than in prior studies. Perfectionism correlated with lower empathy and greater primary negative emotions (e.g., fear) but similar openness to experience compared to excellencism. Mediation analyses revealed that doubts and concerns were unrelated to DT abilities. Openness to experience and empathy were positively correlated with DT abilities. Primary negative emotions during the tasks were negatively associated with the originality of answers. In contrast, positive emotions and secondary negative emotions (e.g., embarrassment) predicted more original ideas. These findings emphasize the importance of promoting excellencism over perfectionism to foster original ideas. This study has implications for overcoming barriers and supporting the creative process of individuals high on perfectionism. It also has implications for creativity researchers investigating the role of empathy and emotions in DT abilities.
Models of performance monitoring hold that following an error, the early postresponse period is devoted primarily to error detection rather than mitigation. However, recent evidence shows that erroneous actions can be terminated within ∼100 ms of their initiation. Prior demonstrations of such error cancellation are based on rapid action slips that emerge in highly over-learned tasks, leaving open the question whether error cancellation generalizes to other types of errors. Here, we probed for the generality of the error cancellation effect by studying medium-speed errors that arise from the incorrect application of a mapping rule in the early stages of implementing a novel instruction. Reanalyses of three publicly available datasets show that error cancellation indeed extends to such errors. Swift error cancellation, therefore, is a remarkably general and automatic component of human performance monitoring.
Data visualizations are common in publications addressed to scientists and the general public. A common graph distortion effect can be obtained by changing the y-axis range. On bar graphs with lower truncated scales (the y-axis starting point is above the data origin), observers tend to perceive larger differences between the values depicted. Herein, we define anchors, information that can be perceived from a graph, to explain ratings of differences in bar graphs. Study 1 examined whether the upper y-axis truncation effect exists or not. We confirmed its existence even though the effect size is smaller compared to lower y-axis truncation effect. Study 2 examined lower and upper y-axis truncations and expansions. We found that, compared to graphs without distortions, observers perceive larger differences between values when there is truncation and smaller differences when there is expansion at either end of the y-axis. Study 3 examined whether the effects of lower and upper y-axis distortions are also present on reversed bar graphs. We found that the black bars biased observers more when they are truncated, as it reduces their area. Finally, Study 4 examined the impact of y-axis distortions on bar graphs, dot graphs, and line graphs. We found that a plot not showing bars results in less biased judgments in the presence of truncation and similar biases for lower and upper truncation. We discuss the results of other relevant research using these anchors and argue that characterizing graphs using the anchors proposed herein can be generalized to other data visualizations. (PsycInfo Database Record (c) 2025 APA, all rights reserved).
Over the past decades, many researchers have identified ways of reasoning in the domain of statistics and probabilities that do not match statistics and probabilities results. Some of these inadequate conceptualizations are reviewed herein. They include, among others, the gambler’s fallacy, the law of small numbers, the misunderstanding of randomness, and they touch various aspects of statistics reasoning (sampling procedures, probability estimation, mean estimation, variance estimation, and inference). A classification is put forward.
Response time data have a positively skewed distribution. The challenge with this is that a measure of central tendency and dispersion does not adequately describe a skewed distribution. A researcher relying on only response time mean and standard deviation could make incorrect conclusions about response time. The best way to analyze response time data is with a distribution analysis. One reason that response time distribution analyses are atypical is that at least 100 trials are recommended per participant and condition. In the current tutorial, we demonstrate a distribution analysis technique that requires as few as 40 participants with 40 trials per condition. This technique involves geometric quantile averaging (GQA) and the quantile maximum probability estimator (QMPE). Each step of the analysis is detailed with a MATLAB script, flexible MATLAB functions, and experimental response time data. Our goal was to lower the barriers to entry for response time distribution analysis so that more researchers will choose to thoroughly examine response time data.
Despite significant transformations in most domains of activities, there might still be some constancies in the creative spaces explored throughout history. This paper introduces the Creative Space Theory (CST), a conceptual framework delineating 10 distinct creative spaces, analogous to creative landscapes. These creative spaces are proposed as navigational terrains for an array of media, tools, activities, and domains. The 10 spaces of the theory are movement, sound, image, sensation, emotion, strategy, story, symbol, network, and system. Notably, these creative spaces transcend specific media, and cover artistic as well as intellectual domains. For example, the sound space would be relevant to music, poetry, filmmaking, and acting among others, whereas the system space may be relevant to engineering, medicine, science, and design among others. The proposed theory holds potential utility in three key areas: (1) nurturing individual’s creative potential, (2) helping creators adapt to continuously changing circumstances, and (3) fostering positive creative self-beliefs in overlooked domains of creation. The current paper is a theoretical elaboration. We describe the creative spaces and discuss the implications of the theory towards individuals, educational practices, and research within the fields of cognition and Artificial Intelligence.
Time series and electroencephalographic data are often noisy sources of data. In addition, the samples are often small or medium so that confidence intervals for a given time point taken in isolation may be large. Decorrelation techniques were shown to be adequate and exact for repeated-measure designs where correlation is assumed constant across pairs of measurements. This assumption cannot be assumed in time series and electroencephalographic data where correlations are most-likely vanishing with temporal distance between pairs of points. Herein, we present a decorrelation technique based on an assumption of local correlation. This technique is illustrated with fMRI data from 14 participants and from EEG data from 24 participants.
ABSTRACTThis study aimed to understand the factors predicting creative activities and creative achievements among university students. Based on a recently proposed framework of 10 creative spaces, we hypothesized that exploring those creative spaces, alongside the personality trait openness to experience and divergent thinking abilities would predict creative activities and achievements in specific domains. Using the Inventory of Creative Activities and Achievements (ICAA) to evaluate eight domains of creativity, two divergent thinking tasks, and one associative task, we analyzed a sample of n = 300 university students. The results of Structural Equation Models revealed that the creative spaces significantly predicted creative activities and creative achievements in the eight domains assessed. The model explained in average 27% of the variance in creative activities and 17% in creative achievements. Openness significantly predicted creative activities in music, literature, and arts and crafts. Intellect did not significantly predict any domain. Lastly, fluency in divergent thinking was positively associated with all domains (average coefficient of β = .15), despite not always reaching significance. We discuss the roles of the recently proposed creative spaces, as well as openness to experience, and fluency in predicting creativity across various domains.
The 12th annual meeting Quantitative Methods in the Humani-ties (Methodes quantitatives en sciences humaines, MQSH) was held on June 9, 2023 at Universite TeLUQ, Montreal. Seven speakers presented their research findings. Sebastien Beland assessed the effectiveness of various popular coefficients on unidimensional items with dichotomous responses. Felix Laliberte presented StepMix, a Python and R package for model-based clustering and mixture (latent classes, latent profiles). Eric Frenette presented the methodological and statistical challenges encountered during the evaluation of the longitudinal program Gagnant pour la vie (version 1.0 ; Eng. Win for life) implemented in a sports-oriented school in Quebec. Andre Achim presented a new technique for symmetrizing asymmetrical distributions. Pier-Olivier Caron presented a comparison of the statistical properties of longitudinal and cross-sectional mediation models. Denis Cousineau presented two techniques analogous to ANOVA: analysis of proportions using the arcsine transfor-mation (ANOPA) and analysis of data frequencies (ANOFA). Louis Laurencelle proposed a complete and parametrically plausible test of the difference between two paired proportions.
Analyses of frequencies are commonly done using a chi-square test. This test, derived from a normal approximation, is deemed generally efficient (controlling type-I error rates fairly well and having good statistical power). However, in the case of factorial designs, it is difficult to decompose a total test statistic into additive interaction effects and main effects. Herein, we present an alternative test based on the G statistic. The test has similar type-I error rates and power as the former one. However, it is based on a total statistic that is naturally decomposed additively into interaction effects, main effects, simple effects, contrast effects, etc., mimicking precisely the logic of ANOVAs. We call this set of tools ANOFA (Analysis of Frequency data) to highlight its similarities with ANOVA. We also examine how to render plots of frequencies along with confidence intervals. Finally, quantifying effect sizes and planning statistical power are described under this framework. The ANOFA is a tool that assesses the significance of effects instead of the significance of parameters; as such, it is more intuitive to most researchers than alternative approaches based on generalized linear models.
The Same-Different task presents two stimuli in close succession and participants must indicate whether they are completely identical or if there are any attributes that differ. While the task is simple, its results have proven difficult to explain. Notably, response times are characterized by a fast-same effect whereby Same responses are faster than Different responses even though identical stimuli should be exhaustively processed to be accurate. Herein, we examine a little more than a quarter million response times (N = 255,744) obtained from 327 participants who participated in one of 14 variants of the task involving minor changes in the stimuli or their durations. We performed distribution fitting and analyzed estimated parameters stemming from the ex-Gaussian, lognormal, and Weibull distributions to infer the cognitive processing characteristics underlying this task. The results exclude serial processing of the stimuli and do not support dual-route processing. The fast-same effect appears only through a shift of the entire response time distributions, a feature impossible to detect solely with mean response time analyses. An attention-modulated process driven by entropy may be the most adequate model of the fast-same effect. (PsycInfo Database Record (c) 2023 APA, all rights reserved).
[This corrects the article DOI: 10.1098/rsos.191375.][This corrects the article DOI: 10.1098/rspb.2022.2500.].
 Brad Harding合作论文数19
 Robert R. Haccoun合作论文数14
 Marc-Andre Goulet合作论文数Univ Ottawa, Sch Psychol, Ottawa, ON, Canada14
 Jean-Christophe Goulet-Pelletier合作论文数13
 Beland Sebastien合作论文数11
 Serge Larochelle合作论文数11
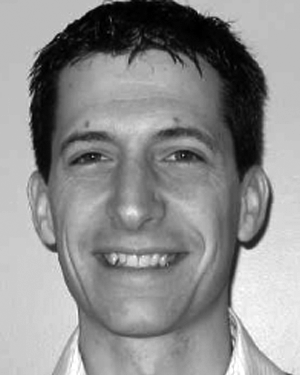 Sylvain Chartier合作论文数School of Psychology, University of Ottawa9Louis Laurencelle合作论文数division de Kinésiologie, U. Laval9Guy L. Lacroix合作论文数8Etienne Dumesnil合作论文数6
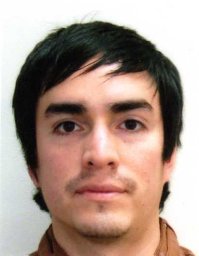 Fernando Marmolejo-Ramos合作论文数School of Psychology, The University of Adelaide6Gyslain Giguère合作论文数Department of Psychology, The University of Texas at Austin6Michael Cantinotti合作论文数6Christophe Tremblay合作论文数5
 Daniel Lalande合作论文数5sonja engmann合作论文数4
 Nathalie Loye合作论文数Universidade de Montreal4
 Pfister Roland合作论文数Department of Psychology, Julius-Maximilians-University of Würzburg4
 Richard Shiffrin合作论文数Department of Psychological and Brain Sciences, The College of Arts & Sciences, Indiana University4
 Yuki Yamada合作论文数4Dominic Charbonneau合作论文数4Christine Lefebvre合作论文数4
 Rose-Marie Gibeau合作论文数3
 Julien T. Groulx合作论文数3
 Bence Palfi合作论文数Eotvos Lorand Univ, Inst Psychol, Budapest, Hungary3
 Williot Alexandre合作论文数3O'Brien Fearghal合作论文数3
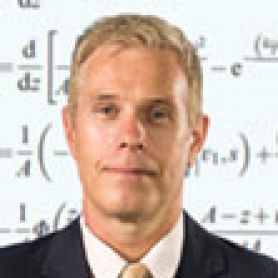 Andrew Heathcote合作论文数School of Psychology, College of Engineering, Science and Environment, University of Newcastle3Yves Lacouture合作论文数3
 Sébastien Hélie合作论文数Laboratoire d'ítude en Intelligences Naturelle et Artificielle, Université du Québec Á Montréal3
 Patrizio Tressoldi合作论文数Dipartimento di Psicologia in Generale Piazza, Università di Padova3
 Scott R. Brown合作论文数School of Psychology, University of Newcastle3
 Patrick Gaudreau合作论文数Faculty of Social Sciences, University of Ottawa3Juan C. Correa合作论文数2William M Briggs合作论文数2
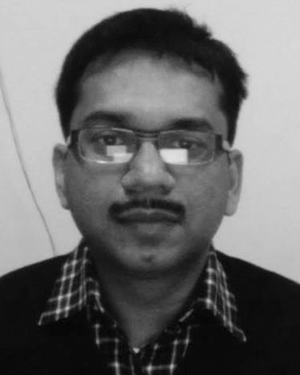 Subhra Sankar Dhar合作论文数2
 Balazs Aczel合作论文数2Huanxu Liu合作论文数2Kyra Girán合作论文数2Roxane Schnepper合作论文数2
 Isabelle Boutet合作论文数2
 Yusuf Bilgic合作论文数2
 Mark Zrubka合作论文数2Braeden F. Hall合作论文数2
 Dmitrii Dubrov合作论文数2
 Peter Szecsi合作论文数Institute of Psychology, Eotvos Lorand University2
 Bence Endre Bakos合作论文数Institute of Psychology, Eotvos Lorand University2Sera Wiechert合作论文数Hebrew University of Jerusalem2




