Evapotranspiration (ET), the combined process of evaporation from soil and plant surfaces and transpiration from plant tissue, plays a pivotal role in the global water and energy balance. Accurately quantifying ET at various spatial scales is important for diverse applications, including irrigation and natural resource management. While efforts to standardize ET methodology have progressed over the last few decades, some confusion and disagreements in terminology persist among communities of researchers and practitioners involved in the measurement, estimation, and simulation of ET. This technical note addresses the historical evolution and standardization of ET terminology, aiming to reduce and mitigate disparities in definitions and usage by advocating for standardized definitions and emphasizing the adoption of reference ET (ETref) terminology to promote consistency and accuracy and to avoid ambiguity. This document provides comprehensive definitions of key terms, including crop (i.e., vegetation cover) coefficients, consumptive use (CU), actual crop evapotranspiration (ETa), and ETref variants for short (grass, ETo) and tall (alfalfa, ETr) reference crops. Practical discussion on several relevant topics is given: (1) single and dual crop coefficient approaches, (2) applications to nonagricultural vegetation, (3) recommended subscripts for terms, (4) practical guidelines and considerations for ETref calculation, (5) encouragement to replace "potential ET" terminology with better terms, (6) clarification on maximum ET (ETmax) and maximum crop coefficient (Kc max) terms, (7) ET products derived from remote sensing, (8) a brief description of the role of ET in water rights, and (9) a figure illustrating the use of the terms defined herein. The conclusion emphasizes the importance of consistent terminology for effective communication among researchers and end-users, which will facilitate the adoption of standardized ET methods and technologies. This technical note was created by the American Society of Civil Engineers, Environmental and Water Resources Institute (ASCE-EWRI), Evapotranspiration in Irrigation and Hydrology Committee, with input and endorsement from other relevant organizations in the United States and internationally. This note serves as a comprehensive reference guide for ET practitioners and researchers.
Intense precipitation events pose growing threats to forest infrastructure causing flooding, and soil erosion and deposition, creating bottlenecks at road-stream crossing structures (RSCS). We describe a hillslope-scale ensemble hydro-geomorphological vulnerability assessment integrating geospatial Streambank Erosion Vulnerability Assessment (SBEVA), Modified Revised Soil Loss Equation (MRUSLE), and process-based Water Erosion Prediction Project (WEPP) model into an ensemble hydro-geomorphologic vulnerability index (EHVI) for USDA Forest Service (USFS) managed 194 road-culverts at the Hubbard Brook Experimental Forest (HBR-EF) in New Hampshire, USA. The results revealed that five and one culvert with diameters of 0.46m and 0.61m, respectively, have extreme EHVI values between 4 and 5, and fifteen and three culverts with diameters of 0.46m and 0.61m, respectively, have severe EHVI values between 3 and 4, some of which were previously identified as hydrologically vulnerable (undersized) to floods. This knowledge will inform USFS efforts to improve the resilience of the RSCS and protect aquatic habitats.
Nepal is highly vulnerable to severe soil erosion driven by monsoonal rainfall and rugged terrains. Limitations in ground observation networks have hindered comprehensive, high-resolution national assessment of precipitation and rainfall-runoff erosivity (R-factor) across Nepal. This study systematically evaluated eight global gridded precipitation datasets (GPDs) against data from 152 weather stations, identifying the optimal precipitation dataset (TPHiPr) representing Nepal’s complex topography. Based on this high-quality dataset, we provided the first independent, long-term (1979–2020), high-resolution national-scale assessment of precipitation and the R-factor for Nepal. Our analysis reveals that 1996 marked a turning point in nationwide precipitation trends: annual precipitation shifted from a decreasing to an increasing one in the humid eastern and central regions, while the drier western region transitioned from an increasing to a decreasing trend, particularly during the dry season. A clear spatial divergence was observed between total precipitation and the R-factor, highlighting the dominant role of precipitation frequency and intensity. Extreme precipitation events intensified significantly (e.g., days with ≥25 mm rainfall increased by 0.2 days yr−1, and the 95th percentile precipitation threshold increased by 0.4 mm yr−1, p < 0.01), driving a nationwide increase in the R-factor (6.3 MJ mm ha−1 h−1 yr−2, p < 0.01), with high-altitude areas experiencing the most pronounced effects. We conclude that soil erosion risk has intensified nationwide due to increasing precipitation extremes. Watershed management must develop elevation-specific adaptation strategies that integrate climate science with practical solutions to address the dual challenges of intensified monsoon-driven erosion and growing dry-season water scarcity.
Over 95% of original longleaf pine (Pinus palustris) (LLP) forests have been converted to other land uses, including loblolly pine (Pinus taeda L) (LOP), croplands, urban uses during the past two centuries in the southeastern United States (U.S.) for socioeconomic developments. Restoring the LLP forests represents a contemporary forest management objective to improve wildlife habitat, water yield, and overall ecosystem services and resilience to a changing climate. Given the importance of understanding ecohydrological processes for guiding restoration efforts, this study compared evapotranspiration (ET) measurements at eight eddy covariance flux sites dominated by LLP or LOP forests in the southeastern U.S. In addition, we developed a "paired stands" approach to compare remote sensing based ET estimates and associated site biophysical properties for approximately 1,600 LLP-LOP pairs. We found significant differences in ET, ET/Precipitation ratio, and water yield/precipitation ratio between the two types of pine forests, and these differences are explained by surface properties and management histories. Compared to LOP, the LLP forests generally had lower ET due to their significantly (p < 0.05) lower leaf area index but higher land surface temperature and albedo. Regionally, forest ET differences increased with the increase in atmospheric dryness index (reference ET/precipitation ratio). Therefore, we conclude that large-scale restoration of LLP forests has the potential to reduce ET and augment water yield in the long run, especially in relatively drier watersheds. Maintaining low stand tree density and understory leaf area characteristic of natural LLP ecosystems through active forest management is critical for enhancing forest water supply. Our study provides the scientific basis for large scale restoration of a diminishing ecosystem for benefiting water resources in the southeastern U.S.
Substantial portions of grassland are being converted to managed forest in Uruguay. Long-term paired watershed studies in other continents indicate that water yields from managed forest lands are reduced compared to grasslands. Few such studies have been conducted in South America. This paired watershed study was initiated in 2000 to determine the hydrologic impacts of changing land use from grassland to pine plantation in Uruguay. Outflow rates, water table depths, rainfall, and meteorological variables were continuously measured for a 20-year period on two adjacent watersheds, LC1 (69 ha) and LC2 (108 ha), at La Corona estancia located in the Tacuaremb & oacute; River basin in northern Uruguay. During the three-year pretreatment period, both watersheds remained in pasture, the traditional land use in the region. In July 2003, one watershed (LC2) was planted with loblolly pine (Pinus taeda L.), while the other (LC1) remained in pasture. Afforestation decreased cumulative water yield over the 17-year period from planting, July 2003, to June 2020 by 35%. Annual water yields from LC2 were reduced, with the magnitude of reduction dependent on weather patterns and stage of tree growth. Differences in water yields between LC1 and LC2 were significant (p < 0.01) in the last twelve years of the study compared to the first 4 years. Changes in water yield were not detected until four years after planting. Analysis of daily flow duration data indicated that flow rates after planting on LC2 were reduced between 40% and 50% for high flows occurring less than 20% of the time and reduced by 50% to 70% for the remaining low flows. Our results are consistent with other research in areas with similar rainfall. Water table and cumulative outflow data suggest that the water yield reduction is associated with deeper-rooted pine having access to more water in the soil profile for transpiration, as compared to shallow-rooted grasses. Research continues on this site to quantify the hydrologic impacts of afforestation through the production cycle for pine in Uruguay.
The primary objective of this research was to propose a new methodology for calculating design flows in ungauged catchments, addressing uncertainties associated with outdated empirical formulas. Focusing on four catchments in the eastern United States, the methodology comprises two main steps: 1) determination of peak flow series using the Event-Based Approach for Small Ungauged Basins (EBA4SUB) rainfall-runoff model and 2) calculation of design flows based on the generated series from EBA4SUB, utilizing the best-fitted statistical distribution. Linear scaling was applied to reduce the percent bias (PBIAS) error in design flows. The study encompassed trend analysis for hydrometeorological data, estimation of peak flow series using EBA4SUB, and the calculation of design flows with the proposed methodology. Validation involved comparing estimated design flows from observed time series with those calculated via the Graphical Peak Discharge (GPD) method and the Rational Formula. Results indicated no significant (a 5 0.05) trends in peak flow series and identified the Pearson type III distribution as best fitted for design flows. Hydrological modeling underscored the critical role of antecedent-moisture conditions in calculating design flows. The calculated PBIAS values of ,10% for model validation suggest the proposed methodology is suitable for use in ungauged catchments. SIGNIFICANCE STATEMENT: Design flows are pivotal in environmental management for several reasons. First, they aid in planning water infrastructure with minimal environmental impact. Second, they inform flood protection strategies vital for safety and property protection. Understanding design flows is crucial for safeguarding aquatic ecosystems and determining minimum flows for a healthy environment. They are also vital in managing water-related risks such as floods, particularly amid climate change. Currently, estimating design flows in ungauged catchments relies heavily on multivariate correlation analysis, which may be outdated due to climate changes and land-use alterations. Our research proposes a novel methodology using the Event-Based Approach for Small Ungauged Basins (EBA4SUB) rainfall-runoff model and statistical distributions to calculate design flows in ungauged catchments to address these concerns.
Accurately predicting water table dynamics is vital for sustaining groundwater resources that support ecological functions and anthropogenic activities. This study evaluates a statistical model (BigVAR) that handles three major flexibilities: (a) prediction under a sparsity assumption in coefficients, (b) consideration of a time series autoregression framework, and (c) allowance for lags in both dependent and independent variables for estimating water table depth using daily hydroclimatic data from the USDA Forest Service Santee Experimental Forest (SC) and a site in NC. Data from 2006–2019 (SC) and 1988–2008 (NC) were used, with key predictors including soil and air temperature, precipitation, wind, and radiation. For WS80, RMSE during the dormant season was 10.09 cm, with a daily testing phase RMSE of 14.94 cm. The model achieved an R^2 of 0.93 for 2019 (a dry year) and 0.96 for 2016 (a wet year). Solar radiation, rainfall, and wind direction were among the most influential variables. This predictive model aids in managing wetland hydrology and supports decision-making for forest managers and hydrologists.
Hydrology and meteorological data from relatively undisturbed watersheds aid in identifying effects on ecosystem services, tracking hydroclimatic trends, and reducing model uncertainties. Sustainable forest, water, and infrastructure management depends on assessing the impacts of extreme events and land use change on flooding, droughts, and biogeochemical processes. For example, global climate models predict more frequent high-intensity storms and longer dry periods for the southeastern USA. We summarized 17 years (2005–2021) of hydrometeorological data recorded in the 52 km2, third-order Turkey Creek watershed at the Santee Experimental Forest (SEF), Southeastern Coastal Plain, USA. This is a non-tidal headwater system of the Charleston Harbor estuary. The study period included a wide range of weather conditions; annual precipitation (P) and potential evapotranspiration (PET) ranged from 994 mm and 1212 mm in 2007 to 2243 mm and 1063 in 2015, respectively. The annual runoff coefficient (ROC) varied from 0.09 in 2007 (with water table (WT) as deep as 2.4 m below surface) to 0.52 in 2015 (with frequently ponded WT conditions), with an average of 0.22. Although the average P (1470 mm) was 11% higher than the historic 1964–1976 average (1320 mm), no significant (α= 0.05) trend was found in the annual P (p = 0.11), ROC (p = 0.17) or runoff (p = 0.27). Runoff occurred on 76.4% of all days in the study period, exceeding 20 mm/day for 1.25% of all days, mostly due to intense storms in the summer and lower ET demand in the winter. No-flow conditions were common during most of the summer growing season. WT recharge occurred during water-surplus conditions, and storm-event base flow contributed 23–47% of the total runoff as estimated using a hydrograph separation method. Storm-event peak discharge in the Turkey Creek was dominated by shallow subsurface runoff and was correlated with 48 h precipitation totals. Estimated precipitation intensity–duration–frequency and flood frequency relationships were found to be larger than those found by NOAA for the 1893–2002 period (for durations ≥ 3 h), and by USGS regional frequencies (for ≥10-year return intervals), respectively, for the same location. We recommend an integrated analysis of these data together with available water quality data to (1) assess the impacts of rising tides on the hydroperiod and biogeochemical processes in riparian forests of the estuary headwaters, (2) validate rainfall–runoff models including watershed scale models to assess land use and climate change on hydrology and water quality, and (3) inform watershed restoration goals, strategies, and infrastructure design in coastal watersheds.
Global forest distributions and functions depend on local climate and future forest dynamics have important feedbacks to the climate systems on Earth. Climate change is a major threat and disturbance factor for forest ecosystems, directly and indirectly altering the water cycles in forests. This chapter provides a snapshot of our state-of-art understanding of forest hydrologic response to climate change and how forest management can mitigate and adapt to climate change. Selected literature on observed and projected changes in forest hydrology is summarized to present processes and concepts. We show that climate change affects forest hydrology through altering precipitation forms and patterns, and increasing evapotranspiration by elevating evaporation potential, extending growing season, and shifting distribution of tree species. Case studies on options of climate mitigation and adaptation in forest management in the United States, China, and Nepal are discussed. We illustrate the challenges and opportunities in sustaining forest water supplies in the 21st century under different socioeconomic settings.
Flood peak magnitudes and frequency estimates are key components of any effective nationwide flood risk management and flood damage abatement program. In this study, we evaluated normalized peak design discharges ( Q p ) for 1,387 hydrologic unit code 16 to 20 (HUC16-20) watersheds in the White Mountain National Forest (WMNF), New Hampshire and in five Experimental Forest (EF) regions across the United States managed by USDA Forest Service (USDA-FS). Nonstationary regional frequency analysis (RFA) and single site frequency analysis (FA) with long-term high-resolution observed streamflow data along with the deterministic Rational Method (RM) and semi-empirical United States Geological Survey regional regression equation (USGS-RRE) were used. Additionally, a hydrologic vulnerability assessment was performed for 194 road culverts as a result of extreme precipitation-induced flooding on gauged and ungauged watersheds in the Hubbard Brook EF (HBR) within the WMNF. The RM outperformed the USGS-RRE in predicting Q p in the gauged and ungauged HUC16-20 watersheds of WMNF and in three other small, high-relief forest headwater watersheds - Coweeta Hydrologic Lab EF's watershed-14, and watershed-27 in North Carolina and HJ Andrews EF's watershed 8 in Oregon. However, the USGS-RRE performed better for larger watersheds, such as the Fraser EF's St. Louis watershed in Colorado and the Santee EF's watershed 80 in South Carolina. About 31%, 26%, and 56% of the culverts at the HBR site could not accommodate the 100-yr Q p estimated by RFA, RM and USGS-RRE, respectively. Based on the chosen RIs and techniques, it is determined that except for one culvert with diameter = 0.91 m (36 inches), none of the culverts with diameter of 0.75 m (30 inches) or larger are hydrologically vulnerable. Our results suggest that the observation based RFA works best where multiple gauges are available to extrapolate information for ungauged watersheds, otherwise, RM is best-suited for smaller headwater watersheds and USGS-RRE for larger watersheds. Results from the hydrologic vulnerability analysis revealed that replacing undersized culverts with new culverts of diameter ≥ 0.75-m will improve flood resiliency, provided that the structure is geomorphologically safe (with minimal effects of debris flow, erosion, and sedimentation) and allows for both bank-full discharge and necessary fish passage within that design limit. This study has implications in managing road culverts and crossings at Forest Service and other forested lands for their resiliency to extreme precipitation and flooding hazards induced by climate change.
HighlightsForested wetland hydrology (WH) is characterized by changes in daily water table (WT) depth over time.Silvicultural operations (harvesting, thinning, bedding, and minor drainage and intensity) affect WT dynamics.Both WT dynamics and WH are also affected by tree stand age/growth and soil types, besides the climate.Knowledge gaps and future research using modeling, including machine learning methods are discussed.Abstract. Sustainable management of forested wetlands requires an understanding of water table (WT) dynamics affected by rainfall and evapotranspiration (ET) as well as management practices to sustain water quality, quantity, and ecosystem services. The hydrology, the most important factor influencing productivity of forested wetlands, may be characterized by measuring changes in WT depth over time. The hydrology of U.S. Southeastern Coastal Plain forested wetlands, particularly wet pine flats and pocosins, where drainage has been commonly used to improve tree growth, is relatively well understood. However, uncertainties remain regarding the effects of some silvicultural practices on WT dynamics of varying soil and drainage types and the role of climatic trends, including extreme events (precipitation and droughts), on WT dynamics of these forested lands. In this paper, we use information from long-term monitoring and modeling studies conducted at sites in the Southeastern Atlantic Coastal Plain to review the current state of research on potential effects of harvesting, thinning, bedding, and minor drainage on changes to WT dynamics in coastal non-riverine forested wetlands. We also briefly illustrate current gaps in knowledge and outline future potential research in this area. Keywords: Pine forest, Bedding, Harvesting, Minor drainage, Water table, Wetland hydrology, Hydrology models.
Forests are recognized for sustaining good water chemistry within landscapes. This study focuses on the water chemistry parameters and their hydrological predictability and seasonality (as a component of predictability) in watersheds of varying scales, with and without human (forest management) activities on them, using Colwell indicators for data collected during 2011–2019. The research was conducted in three forested watersheds located at the US Forest Service Santee Experimental Forest in South Carolina USA. The analysis revealed statistically significant (α = 0.05) differences between seasons for stream flow, water table elevation (WTE), and all water chemistry indicators in the examined watersheds for the post-Hurricane Joaquin period (2015–2019), compared to the 2011–2014 period. WTE and flow were identified as having the greatest influence on nitrogen concentrations. During extreme precipitations events, such as hurricanes or tropical storms, increases in WTE and flow led to a decrease in the concentrations of total dissolved nitrogen (TDN), NH4-N, and NO3-N+NO2-N, likely due to dilution. Colwell indicators demonstrated higher predictability (P) for most hydrologic and water chemistry indicators in the 2011–2014 period compared to 2015–2019, indicating an increase in the seasonality component compared to constancy (C), with a larger decrease in C/P for 2015–2019 compared to 2011–2014. The analysis further highlighted the influence of extreme hydrometeorological events on the changing predictability of hydrology and water chemistry indicators in forested streams. The results demonstrate the influence of hurricanes on hydrological behavior in forested watersheds and, thus, the seasonality and predictability of water chemistry variables within and emanating out of the watershed, potentially influencing the downstream ecosystem. The findings of this study can inform forest watershed management in response to natural or anthropogenic disturbances.
Evapotranspiration (ET) links water, energy, and carbon balances, and its magnitude and patterns are changing due to climate and land use change in the southeastern U.S. Quantifying the environmental controls on ET is essential for developing reliable ecohydrological models for water resources management. Here, we synthesized eddy covariance data from 24 AmeriFlux sites distributed across the southeastern U.S., comprising 162 site-years of flux data representing six representative ecosystems including cropland vegetation mosaic (CVM), deciduous broadleaf forests (DBF), evergreen needle-leaf forests (ENF), grasslands (GRA), savannas (SAV), and wetlands (WET). Our objectives were to assess the daily, seasonal, and annual variability in ET and to develop practical predictive models for regional applications in ecosystem service analysis. We evaluated the response of ET to climatic and biotic forcings including potential evapotranspiration (PET), precipitation (P), and leaf area index (LAI), and compared the performance of these empirical ET models based and those developed using machine learning algorithms. Our results showed that the mean daily ET varied significantly, ranging from 1.36 mm d−1 in GRA to 2.30 mm d−1 in SAV, with a numerical order : GRA < DBF < ENF < WET < CVM < SAV. In this humid region, mean annual PET exceeded P in 16 out of the 24 flux sites. Using the Budyko framework, we showed that ENF had the highest evaporative efficiency (ET/P). PET and leaf area index (LAI) emerged as the most influential factors explaining ET variability. Artificial neural networks (ANN) and random forest (RF) models demonstrated superior capabilities in predicting monthly ET across sites over generalized additive modeling (GAM) and multiple linear regression (MLR) methods. The present study confirmed that the Southeast region is generally 'energy limited', implying that atmospheric demand along with vegetation information can be used to reliably estimate monthly and annual ET. Our study provides valuable insights into how ET of specific ecosystems is controlled by climatic and land surface drivers, enabling the development of reliable predictive models for regional extrapolation of flux measurements in water resource management in the humid southeastern U.S. region.
Soil erosion is particularly affected by climate change, especially increases in the amount and intensity of rainfall. The Revised Universal Soil Loss Equation (RUSLE2) developed by USDA-ARS has been developed to quantify soil erosion. However, it does not consider current climate and topographic conditions for estimating those factors, including the rainfall erosivity factor (R-factor) which is particularly significant given more frequent extreme storm events resulting from climate change. This chapter reviews developing a modified RUSLE model using ArcGIS ModelBuilder automation to develop processes for improving USLE factors so that soil erosion quantification can be estimated more precisely in both temporal and spatial dimensions.
This archive contains research data collected and/or funded by Forest Service Research and Development (FS R&D), U.S. Department of Agriculture. It is a resource for accessing both short and long-term FS R&D research data, which includes Experimental Forest and Range data. It is a way to both preserve and share the quality science of our researchers.
This paper explores the potential to enhance the functionality of the modified Sahu-Mishra-Eldho model (MSME-CN) using indirect soil moisture measurements derived from satellite data. The current version of the MSME-CN model is not applicable in ungauged watersheds due to the necessity of calibrating the crucial parameter α, which reflects soil saturation, based on measured rainfall-runoff events. We hypothesize that the Normalized Difference Vegetation Index (NDVI) can serve as an indirect indicator of soil moisture to assess the soil saturation parameter α in the MSME model. This hypothesis was tested across five different watersheds, three located in the southeastern USA and two in southern Poland. The NDVI product, developed from data obtained from the Advanced Very High-Resolution Radiometer (AVHRR), was utilized in this study. Results indicate that NDVI is a robust indicator of soil moisture for representing the α parameter in the MSME model. The correlation coefficient between α and NDVI a day prior to a rainfall event was around 0.80 for the WS80 and Kamienica watersheds and nearly 0.60 for the other watersheds. The analysis corroborates the hypothesis that NDVI can serve as an indirect parameter of soil moisture to assess the soil saturation parameter α in the MSME-CN model. Based on Nash-Sutcliffe Efficiency (NSE) statistics, the total direct runoff predicted by the MSME-CN model, with the α parameter updated using NDVI, was rated ‘very good’ for the WS80 and AC11 watersheds, ‘good’ for the Kamienica watershed, ‘satisfactory’ for Stobnica, and ‘unsatisfactory’ for the high forest density WS14 watershed, potentially highlighting the model's limitation in such watersheds.
Urgency of Precipitation Intensity-Duration-Frequency (IDF) estimation using the most recent data has grown significantly due to recent intense precipitation and cloud burst circumstances impacting infrastructure caused by climate change. Given the continually available digitized up-to-date, long-term, and fine resolution precipitation dataset from the United States Department of Agriculture Forest Service’s (USDAFS) Experimental Forests and Ranges (EF) rain gauge stations, it is both important and relevant to develop precipitation IDF from onsite dataset (Onsite-IDF) that incorporates the most recent time period, aiding in the design, and planning of forest road-stream crossing structures (RSCS) in headwaters to maintain resilient forest ecosystems. Here we developed Onsite-IDFs for hourly and sub-hourly duration, and 25-yr, 50-yr, and 100-yr design return intervals (RIs) from annual maxima series (AMS) of precipitation intensities (PIs) modeled by applying Generalized Extreme Value (GEV) analysis and L-moment based parameter estimation methodology at six USDAFS EFs and compared them with precipitation IDFs obtained from the National Oceanic and Atmospheric Administration Atlas 14 (NOAA-Atlas14). A regional frequency analysis (RFA) was performed for EFs where data from multiple precipitation gauges are available. NOAA’s station-based precipitation IDFs were estimated for comparison using RFA (NOAA-RFA) at one of the EFs where NOAA-Atlas14 precipitation IDFs are unavailable. Onsite-IDFs were then evaluated against the PIs from NOAA-Atlas14 and NOAA-RFA by comparing their relative differences and storm frequencies. Results show considerable relative differences between the Onsite- and NOAA-Atlas14 (or NOAA-RFA) IDFs at these EFs, some of which are strongly dependent on the storm durations and elevation of precipitation gauges, particularly in steep, forested sites of H. J. Andrews (HJA) and Coweeta Hydrological Laboratory (CHL) EFs. At the higher elevation gauge of HJA EF, NOAA-RFA based precipitation IDFs underestimate PI of 25-yr, 50-yr, and 100-yr RIs by considerable amounts for 12-h and 24-h duration storm events relative to the Onsite-IDFs. At the low-gradient Santee (SAN) EF, the PIs of 3- to 24-h storm events with 100-yr frequency (or RI) from NOAA-Atlas14 gauges are found to be equivalent to PIs of more frequent storm events (25–50-yr RI) as estimated from the onsite dataset. Our results recommend use of the Onsite-IDF estimates for the estimation of design storm peak discharge rates at the higher elevation catchments of HJA, CHL, and SAN EF locations, particularly for longer duration events, where NOAA-based precipitation IDFs underestimate the PIs relative to the Onsite-IDFs. This underscores the importance of long-term high resolution EF data for new applications including ecological restorations and indicates that planning and design teams should use as much local data as possible or account for potential PI inconsistencies or underestimations if local data are unavailable.
 Carl C. Trettin合作论文数Southeastern Forest Experimental Station, Center for Forested Wetlands Research70
 George M. Chescheir合作论文数66Richard W. Skaggs合作论文数66
 Ge Sun合作论文数Eastern Forest Environmental Threat Assessment Center, Southern Research Station, U.S. Department of Agriculture Forest Service55
 Richard Skaggs合作论文数Department of Biological and Agricultural Engineering, North Carolina State University33Jami E Nettles合作论文数30
 Timothy J. Callahan合作论文数University of California at Berkeley24
 Sudhanshu S. Panda合作论文数Gainesville State College23Thomas Williams合作论文数College of Agriculture, Forestry and Life Sciences, Clemson University;Forestry and Environmental Conservation Department, Baruch Institute of Coastal Ecology and Forest Science, Clemson University22
 Steven George Mcnulty (Steve McNulty)合作论文数Department of Forestry and Environmental Resources, North Carolina State University;Southern Research Station, United States Department of Agriculture Forest Service21Gabriela Fernandez合作论文数20
 Shiying Tian合作论文数19Mohamed A. Youssef合作论文数185 Weaver Labs19Herbert Ssegane合作论文数19
 François Birgand合作论文数Cemagref de Rennes, 17 avenue de Cucillé, CS 64427, 35044 Rennes Cedex, France16Zhaohua Dai合作论文数15Charles A. Harrison合作论文数12Augustine Muwamba合作论文数12
 Daniel Hitchcock合作论文数Environmental Health Science, University of Georgia11
 Ernest Tollner合作论文数The University of Georgia11
 Asko Noormets合作论文数Department of Forestry and Environmental Resources and Southern Global Change Program, North Carolina State University11
 Andrzej Walega合作论文数9Harbin Li合作论文数8
 amy e edwards合作论文数Inst Environm Sci, Florida A&M Univ7
 Peter V. Caldwell合作论文数Ctr Integrated Forest Sci, USDA7
 James Vose合作论文数Department of Forestry and Environmental Resources, College of Natural Resources, North Carolina State University;Center for Integrated Forest Science, Forest Service Southern Research Station, U.S. Department of Agriculture7
 Changsheng Li合作论文数7J. W. Gilliam合作论文数7
 Norman S. Levine合作论文数Department of Geology and Environmental Geosciences;College of Charleston;Department of Geology and Environmental Geosciences, College of Charleston7J.D. Gregory合作论文数7
 Artur Radecki-Pawlik合作论文数Agricultural University of Krakow7
 Johnny McFero Grace III合作论文数7T. W. Appelboom合作论文数6
 Kelly Elder合作论文数Institute for Computational Earth System Science;University of California , Santa Barbara;Institute for Computational Earth System Science, University of California , Santa Barbara6
 Michael J Gavazzi合作论文数Eastern Forest Environm Threat Assessment Ctr, USDA6Sherri L. Johnson合作论文数Pacific Northwest Research;U. S. Department of Agriculture;U. S. Department of Agriculture, Pacific Northwest Research6
 John Law Campbell合作论文数5
 Sourav Mukherjee合作论文数Glenn Department of Civil Engineering, Clemson University5Dariusz Młyński合作论文数Corresponding author.5
 Youssef Mohamed A合作论文数Dept Biol & Agr Engn, N Carolina State Univ5
 Manoj Kumar Jha合作论文数Civil Engineering Department, North Carolina A&T University5
 Prasanna Gowda合作论文数U.S. Department of Agriculture-ARS Southeast Area5Mary Beth Adams合作论文数4
 Maricar Aguilos合作论文数Dept Forestry & Environm Resources, North Carolina State Univ4
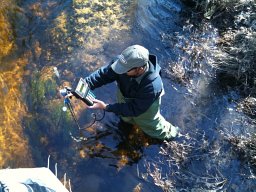 Anand D. Jayakaran合作论文数Washington Stormwater Ctr, Washington State Univ4
 Jiquan Chen (陈吉泉)合作论文数Department of Geography, Environment, and Spatial Sciences, College of Social Science, Michigan State University;Landscape Ecology & Ecosystem Science Lab, Center for Global Change and Earth Observations, Michigan State University4
 Jean Christophe Domec合作论文数Nicholas School of the Environment and Earth Sciences, Duke University;Bordeaux Sciences Agro4A. Christopher Oishi合作论文数Nicholas School of the Environment, Duke University4
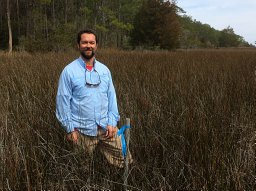 Thomas O'Halloran合作论文数Department of Forest Ecosystems and Society, Oregon State University4




