REALTIME3D is an innovative Mixed-Reality (MR) photogrammetry system that integrates photogrammetry, UAV technology, and VR/AR solutions to enable real-time 3D infrastructure inspection. By combining these technologies, the system allows users to remotely access, visualize, and measure 3D stereoscopic models in real time. An operator on-site pilots a UAV equipped with the stereo cameras, while experts, utilizing VR headsets, can observe and analyze the object of interest from remote locations. This approach enhances cost efficiency and safety during inspections of large-scale, critical structures. The paper introduces the first prototype of the system, detailing its hardware and software components.
The use of mixed reality in photogrammetry software has resulted in a real -time 3D inspection system that allows users to remotely access, visualize and measure the stereoscopic model simultaneously. An on-site operator runs a drone equipped with a stereo camera, and thanks to virtual reality headsets experts can observe the object of interest without leaving the office. This improves both cost-effectiveness and safety when inspecting large, critical structures.
Photogrammetry has been a cornerstone in mapping history and still functions as one of the key techniques in modern geospatial science and engineering [...]
Many modelling applications require 3D meshes that should be generated from filtered/cleaned point clouds. This paper proposes a methodology for filtering of terrestrial laser scanner (TLS)‐derived point clouds, consisting of two main parts: an anisotropic point error model and the subsequent decimation steps for elimination of low‐quality points. The point error model can compute the positional quality of any point in the form of error ellipsoids. It is formulated as a function of the angular/mechanical stability, sensor‐to‐object distance, laser beam's incidence angle and surface reflectivity, which are the most dominant error sources. In a block of several co‐registered point clouds, some parts of the target object are sampled by multiple scans with different positional quality patterns. This situation results in redundant data. The proposed decimation steps removes this redundancy by selecting only the points with the highest positional quality. Finally, the Good, Bad, and the Better algorithm, based on the ray‐tracing concept, was developed to remove the remaining redundancy due to the Moiré effects. The resulting point cloud consists of only the points with the highest positional quality while reducing the number of points by factor 10. This novel approach resulted in final surface meshes that are accurate, contain predefined level of random errors and require almost no manual intervention.
A 3D forest monitoring system, called FORSAT (a satellite very high resolution image processing platform for forest assessment), was developed for the extraction of 3D geometric forest information from very high resolution (VHR) satellite imagery and the automatic 3D change detection. FORSAT is composed of two complementary tasks: (1) the geometric and radiometric processing of satellite optical imagery and digital surface model (DSM) reconstruction by using a precise and robust image matching approach specially designed for VHR satellite imagery, (2) 3D surface comparison for change detection. It allows the users to import DSMs, align them using an advanced 3D surface matching approach and calculate the 3D differences and volume changes (together with precision values) between epochs. FORSAT is a single source and flexible forest information solution, allowing expert and non-expert remote sensing users to monitor forests in three and four (time) dimensions. The geometric resolution and thematic content of VHR optical imagery are sufficient for many forest information needs such as deforestation, clear-cut and fire severity mapping. The capacity and benefits of FORSAT, as a forest information system contributing to the sustainable forest management, have been tested and validated in case studies located in Austria, Switzerland and Spain.
A satellite processing platform for high resolution forest assessment (FORSAT) was developed. It generates the digital surface models (DSMs) of the forest canopy by advanced processing of the very-high resolution (VHR) optical satellite imagery and automatically matches the pre- and post-fire DSMs for 3D change detection. The FORSAT software system can perform the following tasks: pre-processing, point measurement, orientation, quasi-epipolar image generation, image matching, DSM extraction, orthoimage generation, photogrammetric restitution either in mono-plotting mode or in stereo models, 3D surface matching, co-registration, comparison and change detection. It can thoroughly calculate the planimetric and volumetric changes between the epochs. It supports most of the VHR optical imagery commonly used for civil applications. Capabilities of FORSAT have been tested in two real forest fire cases, where the burned areas are located in Cyprus and Austria. The geometric characteristics of burned forest areas have been identified both in 2D plane and 3D volume dimensions, using pre- and post-fire optical image data from different sensors. The test studies showed that FORSAT is an operational software capable of providing spatial (3D) and temporal (4D) information for monitoring of forest fire areas and sustainable forest management. Beyond the wildfires, it can be used for many other forest information needs.
Earth surface changes are often computed by comparing the sequences of digital elevation models (DEMs) so called the DEM of difference (DoD) method. We present an operational DEM generation, co-registration and DoD comparison software in which the surface changes are quantified in metric units of volume. A practical method, which is based on the law of error propagation, is developed to estimate the theoretical precisions of volumetric changes. The proposed pipeline can estimate the change of object volumes (in terms of loss and gain) together with their precision numbers. Change of the forest volume in a fire effected region in a test site is analyzed for the validation. The method can be used for various change detection applications related to forestry as well as other topics such as earthworks, geomorphology, mining, and urbanization.
A full-scale landslide-triggering experiment was conducted on a natural sandy slope subjected to an artificial rainfall event, which resulted in mobilisation of 130 m3 of soil mass. Novel slope deformation sensors (SDSs) were applied to monitor the subsurface pre-failure movements and the precursors of the artificially triggered landslide. These fully automated sensors are more flexible than the conventional inclinometers by several orders of magnitude and therefore are able to detect fine movements (< 1 mm) of the soil mass reliably. Data from high-frequency measurements of the external bending work, indicating the transmitted energy from the surrounding soil to these sensors, pore water pressure at various depths, horizontal soil pressure and advanced surface monitoring techniques, contributed to an integrated analysis of the processes that led to triggering of the landslide. Precursors of movements were detected before the failure using the horizontal earth pressure measurements, as well as surface and subsurface movement records. The measurements showed accelerating increases of the horizontal earth pressure in the compression zone of the unstable area and external bending work applied to the slope deformation sensors. These data are compared to the pore water pressure and volumetric water content changes leading to failure.
Abstract. Forest agencies give special attention to forest fires where post-disaster loss can rarely be gauged in a quick and economic way unless an appropriate technology is adopted. Determination of the planimetric and volumetric changes between pre- and post-fire is in high demand. The FORSAT system (a satellite processing platform for high resolution forest assessment) was developed to meet the relevant demands. It has the capability of extracting of 3D geometric information from the very-high resolution (VHR) imagery from satellite optical sensors and automatic 3D change detection. FORSAT includes two main units. The first one is dedicated to the geometric and radiometric processing of satellite optical imagery and 2D/3D information extraction. This includes: image radiometric pre-processing, image and ground point measurement, improvement of geometric sensor orientation, quasi-epipolar image generation for stereo measurements, digital surface model (DSM) extraction by using a precise and robust image matching approach specially designed for VHR satellite imagery, generation of orthoimages, and 3D measurements in single images using mono-plotting and in stereo images. FORSAT supports most of the VHR optically imagery commonly used for civil applications: IKONOS, OrbView – 3, SPOT – 5 HRS, SPOT – 5 HRG, QuickBird, GeoEye-1, WorldView-1/2, Pléiades 1A/1B, SPOT 6/7. The second unit of FORSAT is dedicated to 3D surface comparison for change detection. It allows users to import DSMs, to co-register them using an advanced 3D surface matching approach and to calculate the planimetric and volumetric changes between epochs. The capacity and benefits of FORSAT have been tested in two real cases, where are burned areas located in Cyprus and Austria. The geometric characteristics of burned forest areas have been identified both in 2D plane and 3D volume dimensions, using pre- and post-fire optical data from different sensors. FORSAT is a single source and flexible forest information solution, allowing expert and non-expert remote sensing users to monitor forests in three and four dimensions from VHR optical imagery for many forest information needs.
A generic and practical methodology is presented for 3D surface mesh reconstruction from the terrestrial laser scanner (TLS) derived point clouds. It has two main steps. The first step deals with developing an anisotropic point error model, which is capable of computing the theoretical precisions of 3D coordinates of each individual point in the point cloud. The magnitude and direction of the errors are represented in the form of error ellipsoids. The following second step is focused on the stochastic surface mesh reconstruction. It exploits the previously determined error ellipsoids by computing a point-wise quality measure, which takes into account the semi-diagonal axis length of the error ellipsoid. The points only with the least errors are used in the surface triangulation. The remaining ones are automatically discarded.
Progress in the technical fields of photogrammetry, remote sensing and spatial sciences is technology-driven. Data were acquired in the past by a limited range of equipment, mainly analogue film ca...
This work aims at developing a generic and anisotropic point error model, which is capable of computing magnitude and direction of a priori random errors, described in the form of error ellipsoids for each individual point of the cloud. The direct TLS observations are the range (rho), vertical (alpha) and horizontal (theta) angles, each of which is in fact associated with a priori precision value. A practical methodology was designed and performed in real-world test environments to determine these precision values. The methodology has two experimental parts. The first part is a static and repetitive measurement configuration for the determination of a priori precisions of the vertical (sigma(alpha)) and horizontal (sigma(theta)) angles. The second part is the measurement of a test stand which contains four plates in white, light grey, dark grey and black colors, for the determination of a priori precisions of the range observations (sigma(rho)). The test stand measurement is performed in a recursive manner so that sensor-to-object distance, incidence angle and surface reflectivity are parameterized. The experiment was conducted with three TLSs, namely Faro Focus 3D X330, Riegl VZ400 and Z+F 5010x in the same location and atmospheric conditions. This procedure was followed by the computation of error ellipsoids of each point using the law of variance-covariance propagation. The direction and size of the error ellipsoids were computed by the principal components transformation. Validation of the proposed error model was performed in real world scenarios, which revealed feasibility of the model.
Quick and economical ways of detecting of planimetric and volumetric changes of forest areas are in high demand. A research platform, called FORSAT (A satellite processing platform for high resolution forest assessment), was developed for the extraction of 3D geometric information from VHR (very-high resolution) imagery from satellite optical sensors and automatic change detection. This 3D forest information solution was developed during a Eurostars project. FORSAT includes two main units. The first one is dedicated to the geometric and radiometric processing of satellite optical imagery and 2D/3D information extraction. This includes: image radiometric pre-processing, image and ground point measurement, improvement of geometric sensor orientation, quasiepipolar image generation for stereo measurements, digital surface model (DSM) extraction by using a precise and robust image matching approach specially designed for VHR satellite imagery, generation of orthoimages, and 3D measurements in single images using mono-plotting and in stereo images as well as triplets. FORSAT supports most of the VHR optically imagery commonly used for civil applications: IKONOS, OrbView – 3, SPOT – 5 HRS, SPOT – 5 HRG, QuickBird, GeoEye-1, WorldView-1/2, Pléiades 1A/1B, SPOT 6/7, and sensors of similar type to be expected in the future. The second unit of FORSAT is dedicated to 3D surface comparison for change detection. It allows users to import digital elevation models (DEMs), align them using an advanced 3D surface matching approach and calculate the 3D differences and volume changes between epochs. To this end our 3D surface matching method LS3D is being used. FORSAT is a single source and flexible forest information solution with a very competitive price/quality ratio, allowing expert and non-expert remote sensing users to monitor forests in three and four dimensions from VHR optical imagery for many forest information needs. The capacity and benefits of FORSAT have been tested in six case studies located in Austria, Cyprus, Spain, Switzerland and Turkey, using optical data from different sensors and with the purpose to monitor forest with different geometric characteristics. The validation run on Cyprus dataset is reported and commented.
A reduced complexity model, which simulates the process of fluvial inland‐delta formation, has been developed in a previous study. The results have been compared and validated with a laboratory experiment. This work elaborates the laboratory investigation in which an experimental inland delta is generated and its eroding topography is measured using a structured‐light 3D scanner. The least squares 3D (LS3D) co‐registration and comparison method is used for alignment as well as for comparing data epochs both spatially and temporally. A spatial precision value of around ±50 μm (1/20 000) is achieved. A series of high‐quality digital elevation models (DEMs) are generated and the space‐time evolution of the inland delta is monitored and analysed, in terms of slope and topography dynamics, in the consecutive DEM layers. The combination of high‐resolution scanning together with high‐precision co‐registration techniques allows investigation of the details of the space‐time variability of the sedimentation‐deposition patterns to be used for geomorphological analysis.
The random error pattern of point clouds has significant effect on the quality of final 3D model. The magnitude and distribution of random errors should be modelled numerically. This work aims at developing such an anisotropic point error model, specifically for the terrestrial laser scanner (TLS) acquired 3D point clouds. A priori precisions of basic TLS observations, which are the range, horizontal angle and vertical angle, are determined by predefined and practical measurement configurations, performed at real-world test environments. A priori precision of horizontal (𝜎𝜃) and vertical (𝜎𝛼) angles are constant for each point of a data set, and can directly be determined through the repetitive scanning of the same environment. In our practical tests, precisions of the horizontal and vertical angles were found as 𝜎𝜃=±36.6𝑐𝑐 and 𝜎𝛼=±17.8𝑐𝑐, respectively. On the other hand, a priori precision of the range observation (𝜎𝜌) is assumed to be a function of range, incidence angle of the incoming laser ray, and reflectivity of object surface. Hence, it is a variable, and computed for each point individually by employing an empirically developed formula varying as 𝜎𝜌=±2−12 𝑚𝑚 for a FARO Focus X330 laser scanner. This procedure was followed by the computation of error ellipsoids of each point using the law of variance-covariance propagation. The direction and size of the error ellipsoids were computed by the principal components transformation. The usability and feasibility of the model was investigated in real world scenarios. These investigations validated the suitability and practicality of the proposed method.
hemical anchorages are applied in many engineering implementations, particularly strengthening of reinforced concrete structures. During strengthening procedure; chemical anchorages should be tested, since they supply to transfer the load between existing construction elements and newly added elements. Therefore; the study of the quality of chemical anchorages is an important issue in construction materials science. In this context; the most important experiment is to determine the pull-out loads of embedded anchorage reinforcement by applying axial loads. In this study; it is aimed to determine the displacements of steel reinforcements, embedded into concrete by using chemical anchorages, while applying axial pulling loads. In order to determine the displacements and load - deformation graphs; starting conditions and every 10 bar pressure applied conditions of the steel reinforcements were captured by the cameras. The obtained images were evaluated by using photogrammetric software. Based on the photogrammetric post-processing results, the load - deformation graphs were plotted and the loads at loss of adhesion were determined.
Improving the efficiency of bridge inspection and minimizing the impact of dynamic load on the long term deterioration of the bridge structure reduces maintenance and upkeep costs whilst also improving bridge longevity and safety. This paper presents the results of an on-going project whose ultimate goal is the real-time photogrammetric monitoring the structural deformations of the second Bosphorus Bridge of Istanbul.
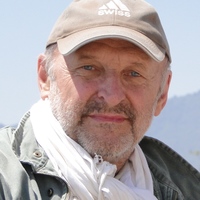 Armin Gruen合作论文数Department of Civil, Environmental and Geomatic Engineering, Eidgenössische Technische Hochschule Zürich;Department of Architecture, Eidgenössische Technische Hochschule Zürich;Institute of Geodesy and Photogrammetry, Eidgenössische Technische Hochschule Zürich35
 Orhan Altan合作论文数Civil Engineering Faculty9
 Victor Sanchez Martin合作论文数Ingn & Soluc Informat SL5Martin Hofer合作论文数5Elisa Jimeno合作论文数5Alejandro Garcia合作论文数5
 Andreas Walli合作论文数5
 Efstratios Stylianidis合作论文数Dept . of Cadastre;Aristotle University of Thessaloniki;Dept . of Cadastre, Aristotle University of Thessaloniki5
 Amin Askarinejad合作论文数Department of Geoscience & Engineering, Faculty of Civil Engineering and Geosciences, Delft University of Technology5Konstantinos Smagas合作论文数4
 Mustafa Ozendi合作论文数Geomat Muhendisligi Bolumu, Zonguldak Bulent Ecevit Univ4Hansjörg Seybold合作论文数4Daniela Poli合作论文数Institute of Geodesy and Photogrammetry4
 Fabio Remondino合作论文数3D Optical Metrology Research Unit, FBK Trento4
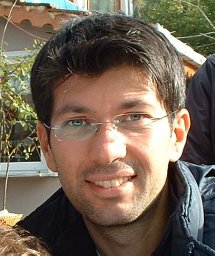 Huseyin Topan合作论文数4
 Sarah Marcella Springman合作论文数Department of Civil, Environmental and Geomatic Engineering, Eidgenössische Technische Hochschule Zürich;Institute for Geotechnical Engineering, Eidgenössische Technische Hochschule Zürich4Bernd Breuckmann合作论文数3
 Mark C. Freeman合作论文数Xfi Centre for Finance & Investment;University of Exeter;Xfi Centre for Finance & Investment, University of Exeter3
 Isabel M J Sargent合作论文数Ordnance Survey Research3institut fur geodasie und photogrammetrie合作论文数2
 Sultan Kocaman合作论文数Department of Geomatics Engineering, Hacettepe University2
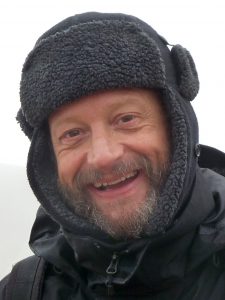 Hans Herrmann合作论文数Institute for Building Materials, Department of Civil, Environmental and Geomatic Engineering, ETH Zürich2
 Wolfgang Kinzelbach合作论文数Department of Civil, Environmental and Geomatic Engineering, Eidgenossische Technische Hochschule Zurich;Institut fur Umweltingenieurwissenschaften, Eidgenossische Technische Hochschule Zurich2
 Troy Shinbrot合作论文数Department of Biomedical Engineering, School of Engineering, Rutgers, The State University of New Jersey2David Novák合作论文数2Thomas Hanusch合作论文数2Gerhard Schrotter合作论文数Institute of Geodesy and Photogrammetry2
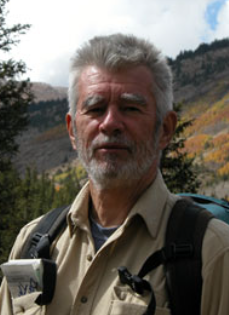 Peter Molnar合作论文数Cooperative Institute for Research in Environmental Sciences, University of Colorado Boulder;Department of Geological Sciences, College of Arts and Sciences, University of Colorado Boulder2
 José S. Andrade合作论文数Instituto Capixaba de Pesquisa;Assistência Técnica e Extensão Rural;Instituto Capixaba de Pesquisa|Assistência Técnica e Extensão Rural2
 Baltsavias Emmanuel合作论文数Institute of Geodesy and Photogrammetry, Swiss Federal Institute of Technology2Christian Lahanier合作论文数2D. Poli合作论文数1
 Ernst Bleiker合作论文数1Ö. Avsar合作论文数1Koji Mano合作论文数1yi de shi jing (一徳 石井)合作论文数1
 Rongjun Qin合作论文数Department of Civil, Environmental and Geodetic Engineering, College of Engineering, The Ohio State University;Translational Data Analytics Institute, The Ohio State University1emil avsar合作论文数1Emin Ozgur Avsar合作论文数1
 Anil Dogan合作论文数1M. Yoshimura合作论文数1k mano合作论文数1K. Tachibana合作论文数1
 Li Zhang (张力)合作论文数China Academy of Surveying & Mapping1Yoshimura Mitsunori合作论文数1Kirsten Wolff合作论文数1Ana Bilim Dali合作论文数1
 Zubeyde Alkis合作论文数1




