Crystallographic phasing strategies increasingly require the exploration and ranking of many hypotheses about the number, types and positions of atoms, molecules and/or molecular fragments in the unit cell, each with only a small chance of being correct. Accelerating this move has been improvements in phasing methods, which are now able to extract phase information from the placement of very small fragments of structure, from weak experimental phasing signal or from combinations of molecular replacement and experimental phasing information. Describing phasing in terms of a directed acyclic graph allows graph-management software to track and manage the path to structure solution. The crystallographic software supporting the graph data structure must be strictly modular so that nodes in the graph are efficiently generated by the encapsulated functionality. To this end, the development of new software, Phasertng, which uses directed acyclic graphs natively for input/output, has been initiated. In Phasertng, the codebase of Phaser has been rebuilt, with an emphasis on modularity, on scripting, on speed and on continuing algorithm development. As a first application of phasertng, its advantages are demonstrated in the context of phasertng.xtricorder, a tool to analyse and triage merged data in preparation for molecular replacement or experimental phasing. The description of the phasing strategy with directed acyclic graphs is a generalization that extends beyond the functionality of Phasertng, as it can incorporate results from bioinformatics and other crystallographic tools, and will facilitate multifaceted search strategies, dynamic ranking of alternative search pathways and the exploitation of machine learning to further improve phasing strategies.
The 3D-Reflection data viewer in Phenix [1] is based on the OpenGL library which is deprecated on MacOS.A replacement based on supported libraries, was urgently required.The NGL-HKL-viewer has been developed in a way that leverages the codebase of the original viewer while extending the functionality.Protein crystallography involves processing raw X-ray images to indexed intensities.Subsequent steps may associate additional data with these indices.As part of the changes to the 3D-Reflection data viewer the types of reflection data that can be displayed were expanded.Real valued data are displayed as spheres scaled according to their magnitudes.Colour coding through both hue and saturation can be applied as well.The viewer allows associating one data parameter with the sizes of the spheres but colour them according to another data parameter.For example, phased structure factors can be displayed as spheres scaled by amplitudes, coloured according to phases and colour saturation used to represent figures of merit.Data can be sorted into bins and be shown or hidden.NGL-HKL-viewer is scriptable from Python and part of CCTBX [2].It is based on NGL [3] and therefore portable to all computing platforms with a modern web browser.The viewer can be embedded in graphical user interfaces such as Qt5 or PySide.It is part of Phaser.Voyager [4].
Diffraction (X-ray, neutron and electron) and electron cryo-microscopy are powerful methods to determine three-dimensional macromolecular structures, which are required to understand biological processes and to develop new therapeutics against diseases. The overall structure-solution workflow is similar for these techniques, but nuances exist because the properties of the reduced experimental data are different. Software tools for structure determination should therefore be tailored for each method. Phenix is a comprehensive software package for macromolecular structure determination that handles data from any of these techniques. Tasks performed with Phenix include data-quality assessment, map improvement, model building, the validation/rebuilding/refinement cycle and deposition. Each tool caters to the type of experimental data. The design of Phenix emphasizes the automation of procedures, where possible, to minimize repetitive and time-consuming manual tasks, while default parameters are chosen to encourage best practice. A graphical user interface provides access to many command-line features of Phenix and streamlines the transition between programs, project tracking and re-running of previous tasks.
Sammito, Massimo D (University of Cambridge, Cambridge, GBR); McCoy, Airlie J (University of Cambridge, Cambridge, GBR); Hatti, Kaushik (University of Cambridge, Cambridge, GBR); Oeffner, Robert D (University of Cambridge, Cambridge, GBR); Stockwell, Duncan H (University of Cambridge, Cambridge, GBR); Croll, Tristan I (University of Cambridge, Cambridge, GBR); Read, Randy (Department of Haematology, Cambridge Institute for Medical Research, University of Cambridge, Cambridge, GBR)
 Airlie Mccoy合作论文数Cambridge Institute for Medical Research, University of Cambridge4
 Oeffner Robert D合作论文数4
 Massimo Domenico Sammito合作论文数Instituto de Biología Molecular de Barcelona (IBMB),, CSIC4
 Randy J. Read合作论文数Department of Haematology, Cambridge Institute for Medical Research, University of Cambridge4
 Tristan I. Croll合作论文数Australian Institute for Bioengineering and Nanotechnology, University of Queensland4
 Hatti Kaushik合作论文数Molecular Biophysics Unit, Indian Institute of Science Bangalore3
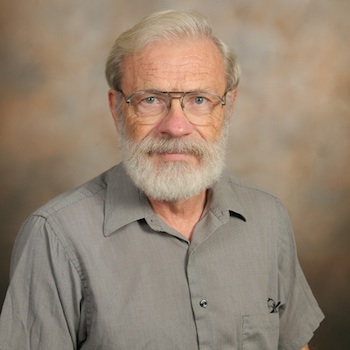 David C. Richardson合作论文数Department of Biochemistry, Duke University School of Medicine1Bunkóczi Gábor合作论文数1
 Afonine Pavel V合作论文数Lawrence Berkeley Natl Lab, Univ Calif Berkeley1Prisant Michael G合作论文数1Liebschner Dorothee合作论文数1
 Hintze Bradley J合作论文数Department of Biochemistry, Duke University1
 Swati Jain合作论文数Department of Public Health Dentistry, D.J College of Dental Sciences and Research1
 Vincent Sunn Chen合作论文数Snorkel AI1Videau Lizbeth L合作论文数1Sobolev Oleg V合作论文数1
 Paul D. Adams合作论文数Department of Bioengineering, UC Berkeley;Lawrence Berkeley National Laboratory1
 Jane Shelby Richardson合作论文数Department of Biochemistry, School of Medicine, Duke University1
 Thomas C. Terwilliger合作论文数Los Alamos National Laboratory1Nathaniel Echols合作论文数Dept . of Molecular Biophysics & Biochemistry;Yale University1
 Nigel W Moriarty合作论文数1
 Matt Baker合作论文数School of Biotechnology and Biomolecular Science, The University of New South Wales1
 Li-Wei Hung合作论文数Los Alamos National Laboratory Physics Division1Alexandre Urzhumtsev合作论文数1Christopher Williams合作论文数1
 Billy K. Poon合作论文数Department of Bioengineering, Rice University1




