The biological carbon pump (BCP), involving photosynthesis at the surface and remineralisation at depth, maintains a significant vertical gradient in dissolved inorganic carbon (DIC), thereby promoting the ocean's ability to absorb atmospheric CO2. Remineralised DIC is a good indicator of the strength of the BCP. It can be estimated from apparent oxygen utilisation (AOU), which measures the deficit of oxygen relative to saturation. AOU is projected to increase under climate change due to changes in remineralisation rates and ventilation. However, the amplitude of the change remains uncertain. Here, we identify linear relationships between trends in AOU and ideal-age in the deep ocean, based on simulations of the contemporary (1982–2013) and future (2015–2099) periods from five Earth system models (ESMs). Our analysis underscores the substantial role of ventilation slowdown in increasing remineralised DIC. Furthermore, the study highlights considerable inter-model variability in their sensitivity of AOU to age changes, with this sensitivity remaining relatively stable over time. With more observational data, refined estimates of age changes from ocean tracers and a larger model ensemble, constraining this variability will become feasible. These insights emphasise both the challenges and opportunities for constraining future BCP projections arising from uncertainties in ventilation.
Abstract. The Global Ocean Data Analysis Project (GLODAP) is a synthesis effort providing surface-to-bottom ocean biogeochemical observations determined through chemical analysis of discrete bottle samples, with an emphasis on seawater inorganic carbon chemistry and related variables. Version 3 of GLODAP comprises data from 1181 cruises, spanning more than 50 years of observations (1972–2023). It includes all data from the previous GLODAPv2.2023 (Lauvset et al., 2024) together with newly added data from 57 cruises. For all cruises, 13 core variables (temperature, salinity, oxygen, nitrate, silicate, phosphate, dissolved inorganic carbon, total alkalinity, CFC-11, CFC-12, CFC-113, CCl₄, and SF6) have undergone extensive quality control with particular focus on the identification and removal of systematic differences between cruises. The data are available in two formats: (i) as submitted by the data originators, converted to World Ocean Circulation Experiment (WOCE) exchange format, and (ii) as a merged data product in which adjustments have been applied. These adjustments were determined using crossover analyses in combination with a newly developed global inversion method, the furthest-first routine. The applied adjustments are intended to remove systematic differences arising from differences in measurement methods, calibration, and/or data-handling practices, while preserving known or likely temporal trends and natural variability. The consistency of the adjusted data product is estimated to be 0.0013 for salinity, 0.7 % for oxygen, 0.4 % for nitrate, 0.5 % for silicate, 0.5 % for phosphate, 1.2 µmol kg⁻¹ for dissolved inorganic carbon, and 1.4 µmol kg⁻¹ for total alkalinity. Consistency estimates could not be derived for transient tracers, but they are believed to be consistent to better than 5 % (10 % for SF₆). The enhanced consistency enables different datasets to be used together with greater confidence. Newly introduced cruise-specific uncertainty estimates for all core variables provide more granular quantifications of remaining cruise-to-cruise inconsistencies. Additional variables, including pH, discrete CO₂ fugacity (fCO₂), isotopic tracers, and others, were not subjected to secondary quality control but are included in the data product. The original data, their documentation (metadata), and DOIs are available through the Ocean Carbon and Acidification Data System (OCADS) of NOAA’s National Centers for Environmental Information (NCEI), which also hosts the merged data product. All secondary quality control decisions and supporting information can be found in the online adjustment table (https://glodapv3.geomar.de, last accesses 26.06.2026). The product is distributed as a single global file and as four regional subsets (Arctic, Atlantic, Indian, and Pacific Oceans) under https://doi.org/10.25921/m6tp-mj50 (Lange et al., 2026). These adjusted files also include ancillary and approximated data obtained through interpolation or calculation from measured data.
Organic carbon remineralization rate (OCRR) and the calcium carbonate production rate (CCPR) are influential variables on the efficiency of the biological carbon pump (BCP) but are not well understood in Red Sea. We used historical cruise data of carbonate chemistry, oxygen, and transient tracers from five locations along the north–south central axis of the Red Sea to estimate OCRR and CCPR from tracer‐based water mean ages (Γ), apparent oxygen utilization (AOU), and alkalinity utilization (AU). This resulted in the first basin‐wide and depth‐resolving (100–1,000 m) OCRR and CCPR estimates. Spatial distributions for Γ, AOU, and AU were strongly influenced by the large‐scale circulation and showed maxima intermediate depths (400–500 m). Conversely, OCRR and CCPR showed no statistically significant latitudinal differences and peaked (6.5 ± 4.3 and 11.9 ± 4.6 mmol C m −3 yr −1 , respectively) at 100‐m depth, which decreased to nearly constant values (3.8 ± 0.7 and 1.4 ± 0.3 mmol C m −3 yr −1 , respectively) at 300 m and deeper. By depth‐integrating CCPR, we estimated annual calcium carbonate production (CCP) of (0.8 ± 0.3) × 10 12 mol, or 0.6% of global ocean production, in the Red Sea, which has only 0.12% of the world ocean area. High correlation between AU and Γ indicated in situ alkalinity removal taking place also in subsurface and deep waters, probably due to chemical precipitation, which has been previously reported for the area. CCP‐induced AU affects the carbonate chemistry in the Red Sea water column, and we hypothesize that it also impacts that of the Gulf of Aden through the outflowing Red Sea Outflow Water.
The North Atlantic is one of the major sinks for anthropogenic carbon in the global ocean, yet future projections of its strength have presently high uncertainties. Here we analyze the mechanisms that determine the projected future North Atlantic carbon uptake of models and identify a list of variables that can be used to assess the associated model performance. We focus on an ensemble of 11 Earth system models and their simulations of a future with high atmospheric CO2. Some of these models simulate that a slowdown in North Atlantic carbon uptake has already begun, while others simulate that this slowdown will only occur very late in the 21th century. Our results show that the highest model spread in the carbon uptake occurs in the high latitudes of the North Atlantic. The models with a high future anthropogenic carbon uptake reveal deep winter mixing and high primary production. Associated with this, we find that the simulated (i) high latitude winter pCO2-anomaly and (ii) upper-ocean northward volume transport between the surface and 500-m depth in the Gulf Stream area are good performance indicators for a model´s future carbon uptake in the North Atlantic. The deep winter mixing and high primary production in models with high future North Atlantic carbon uptake enable an efficient carbon sequestration into the deep ocean, i.e. an efficient anthropogenic carbon drawdown in the Labrador and Irminger Seas, but furthermore an efficient southward transport of anthropogenic carbon out of the high latitudes via the lower limb of the Atlantic Meridional Overturning Circulation (AMOC). Related to this, other well-suited performance indicators of the future carbon uptake of the North Atlantic are the simulated (iii) fraction of the carbon inventory that is stored below 1000-m depth and (iv) deep-ocean southward volume transport between 700 and 4700 m at 26∘N. We use observation-based estimates of these four indicators to assess the model performance for the future North Atlantic carbon uptake. Our results falsify that the slowdown of the North Atlantic carbon uptake has already begun. We suggest that the strength of the AMOC is less suited as a performance indicator for the future North Atlantic carbon uptake than our newly identified indicators. Hence, the relation of maximum northward volume transport to the ocean carbon sink is not as robust as often assumed in modelling studies.
The Global Ocean Data Analysis Project (GLODAP) is a synthesis effort providing regular compilations of surface to bottom ocean biogeochemical bottle data, with an emphasis on seawater inorganic carbon chemistry and related variables determined through chemical analysis of seawater samples. GLODAPv2.2023 is an update of the previous version, GLODAPv2.2022 (Lauvset et al., 2022). The major changes are as follows: data from 23 new cruises were added. In addition, a number of changes were made to the data included in GLODAPv2.2022. GLODAPv2.2023 includes measurements from more than 1.4 million water samples from the global oceans collected on 1108 cruises. The data for the now 13 GLODAP core variables (salinity, oxygen, nitrate, silicate, phosphate, dissolved inorganic carbon, total alkalinity, pH, chlorofluorocarbon-11 (CFC-11), CFC-12, CFC-113, CCl4, and SF6) have undergone extensive quality control with a focus on the systematic evaluation of bias. The data are available in two formats: (i) as submitted by the data originator but converted to World Ocean Circulation Experiment (WOCE) exchange format and (ii) as a merged data product with adjustments applied to minimize bias. For the present annual update, adjustments for the 23 new cruises were derived by comparing those data with the data from the 1085 quality-controlled cruises in the GLODAPv2.2022 data product using crossover analysis. SF6 data from all cruises were evaluated by comparison with CFC-12 data measured on the same cruises. For nutrients and ocean carbon dioxide (CO2), chemistry comparisons to estimates based on empirical algorithms provided additional context for adjustment decisions. The adjustments that we applied are intended to remove potential biases from errors related to measurement, calibration, and data-handling practices without removing known or likely time trends or variations in the variables evaluated. The compiled and adjusted data product is believed to be consistent to better than 0.005 in salinity, 1 % in oxygen, 2 % in nitrate, 2 % in silicate, 2 % in phosphate, 4 µmol kg−1 in dissolved inorganic carbon, 4 µmol kg−1 in total alkalinity, 0.01–0.02 in pH (depending on region), and 5 % in the halogenated transient tracers. The other variables included in the compilation, such as isotopic tracers and discrete CO2 fugacity (fCO2), were not subjected to bias comparison or adjustments. The original data, their documentation, and DOI codes are available at the Ocean Carbon and Acidification Data System of NOAA National Centers for Environmental Information (NCEI), which also provides access to the merged data product. This is provided as a single global file and as four regional ones – the Arctic, Atlantic, Indian, and Pacific oceans – under https://doi.org/10.25921/zyrq-ht66 (Lauvset et al., 2023). These bias-adjusted product files also include significant ancillary and approximated data, which were obtained by interpolation of, or calculation from, measured data. This living data update documents the GLODAPv2.2023 methods and provides a broad overview of the secondary quality control procedures and results.
Baffin Bay is an Arctic marginal sea connected to the North Atlantic via Davis Strait and the Labrador Sea. While the exchange of heat and freshwater through Davis Strait is known to strongly influence the subpolar North Atlantic, there are significant gaps in our understanding of the circulation and water mass distribution and transformation throughout Baffin Bay, in part due to limited direct velocity observations. In this study, high-resolution hydrographic, nutrient, oxygen isotope, and velocity data from two shipboard surveys in late-summer to early-fall 2021 are used to address these gaps. During the time period of observation, Baffin Bay was dominated by cold, fresh, nitrate-depleted Polar Water (PW) in the upper 300 m, with the coldest and freshest PW distributed along the western shelf and slope adjacent to Baffin Island. Only a small amount of warm and salty Atlantic-origin water was measured entering the southeastern bay at depth, which is diluted rapidly when passing through Davis Strait. Pacific-origin freshwater was dominant in the upper 200 m on the western side, with relatively small amounts of meteoric water on both sides of the bay. The circulation in Baffin Bay was generally cyclonic, consisting of a strong, surface-intensified western boundary current and a slower, weakly baroclinic eastern boundary current. Much of the eastern boundary current bifurcated to the west at the northern end of the Labrador Sea, and, as the remaining flow progressed through Davis Strait, it transitioned from surface-intensified to bottom-intensified. Basin-scale recirculation of the PW was documented using the shipboard data, which was also evident in the velocity field of an ocean reanalysis product for the same time period. Examination of the reanalysis fields from 1993 to 2021 indicates that the circulation in Baffin Bay was anomalously cyclonic during summer/fall 2021. Such basin-scale circulation anomalies can arise due to both the local wind stress curl pattern and remote wind forcing associated with the Arctic Oscillation index.
We evaluate changes in dissolved inorganic carbon (DIC) in the Greenland Sea between 2002 and 2016, a period characterized by increasing convection depths. We find a mid-depth maximum in anthropogenic carbon (Cant) accumulation that occurred as waters at these depths were rejuvenated by deeper reaching convection; broadly, these waters have caught up with the atmospheric CO2 rise that had happened between the last time they were ventilated and 2002 and also tracked the atmospheric CO2 rise 2002-2016. The overlying waters only tracked the atmospheric CO2 rise 2002-2016. The mid-depth maximum in Cant accumulation was not evident in estimates generated with commonly used multiple linear regression (MLR) methods. We analyze the reasons why and show that the eMLR(C*) method may not fully capture nonsteady state changes in Cant when applied along a single hydrographic section as done here. This nonsteady component equates to redistribution of C*, whose spatial gradients in the Greenland Sea are dominated by Cant. We also show that the regular extended multiple linear regression method is sensitive to loss of spatial DIC gradients, which now happens as more and more Cant enters the ocean. Our findings demonstrate that MLR-based estimates of the Cant accumulation rate should not be taken at face value in highly dynamical ocean regions, such as the Greenland Sea, and the need for also considering the total change in DIC and how this is affected by natural processes. Further investigations into the ability of MLR methods to reproduce nonsteady state changes in Cant are encouraged. The ocean holds vast quantities of carbon. Each year this inventory increases as the ocean absorbs a quarter of our CO2 emissions. Keeping track of ocean carbon is a key climate change research priority. Observations from the Greenland Sea indicate at first glance a steady rise in DIC concentrations in the upper approximately 1,500-2,000 m of the water column, roughly equal to what one would expect from the atmospheric CO2 rise. This is unusually deep compared to the rest of the global ocean but reflects the deep-water formation that occurs in this region. A closer inspection of the data, however, reveals that the seemingly uneventful rise in carbon in this region is the net result of several counteracting processes. In response to deeper convection, mid-depth waters have lost inorganic carbon generated by the remineralization of organic matter, natural carbon. This has been counteracted by an unusually large rise in their content of man-made, or anthropogenic carbon. Widely adopted methods for estimating decadal rises in anthropogenic carbon struggle to quantify these changes, such that our ability to detect the nature of effects of climate variability and change on the efficiency of the ocean carbon sink can be questioned. Deeper convection caused a mid-depth maximum in the rate of anthropogenic carbon increase in the Greenland Sea from 2002 to 2016 The mid-depth maximum in anthropogenic carbon accumulation was not evident in estimates generated with multiple linear regression methods Nonsteady state anthropogenic carbon accumulation may bias the eMLR(C*) method when applied along a single hydrographic section
The Global Ocean Data Analysis Project (GLODAP) is a synthesis effort providing regular compilations of surface-to-bottom ocean biogeochemical bottle data, with an emphasis on seawater inorganic carbon chemistry and related variables determined through chemical analysis of seawater samples.GLODAPv2.20232 is an update of the previous version, GLODAPv2.20221(Lauvset et al., 20221).The major changes are as follows: data from 96 23 new cruises were added, data coverage was extended until 2021, and for the first time we performed secondary quality control on all sulfur hexafluoride (SF6) data.In addition, a number of changes were made to data included in GLODAPv2.20221.These changes affect specifically the SF6 data, which are now subjected to secondary quality control, and carbon data measured on board the RV Knorr in the Indian Ocean in 1994-1995 which are now adjusted using certified reference material (CRM) measurements made at the time.GLODAPv2.20232includes measurements from almost more than1.4 million water samples from the global oceans collected on 11081085 cruises.The data for the now 13 GLODAP core variables (salinity, oxygen, nitrate, silicate, phosphate, dissolved inorganic carbon, total alkalinity, pH, chlorofluorocarbon-11 (CFC-11), CFC-12, CFC-113, CCl4, and SF6) have undergone extensive quality control with a focus on systematic evaluation of bias.The data are available in two formats: (i) as submitted by the data originator but converted to World Ocean Circulation Experiment (WOCE) exchange format and (ii) as a merged data product with adjustments applied to minimize bias.For the present annual update, adjustments for the 2396 new cruises were derived by comparing those data with the data from the 989 1085 quality-controlled cruises in the GLODAPv2.20221data product using crossover analysis.SF6 data from all cruises were evaluated by comparison with CFC-12 data measured on the same cruises.For nutrients and ocean carbon dioxide (CO2) chemistry comparisons to estimates based on empirical algorithms provided additional context for adjustment decisions.The adjustments that we applied are intended to remove potential biases from errors related to measurement, calibration, and data handling practices without removing known or likely time trends or variations in the variables evaluated.The compiled and adjusted data product is believed to be consistent to better than 0.005 in salinity, 1 % in oxygen, 2 % in nitrate, 2 % in silicate, 2 % in phosphate, 4 mol kg -1 in dissolved inorganic carbon, 4 mol kg -1 in total alkalinity, 0.01-0.02 in pH (depending on region), and 5 % in the halogenated transient tracers.The other variables included in the compilation, such as isotopic tracers and discrete CO2 fugacity (fCO2), were not subjected to bias comparison or adjustments.The original data,
The Iceland and Greenland Seas are characterized by strong heat fluxes from the ocean to the atmosphere during wintertime. Here we characterize the atmospheric signal of this strong evaporation in terms of water vapor isotopes and investigate if such a signal can have a cumulative imprint on the ocean mixed-layer. Observations include continuous water vapor isotope measurements, event-based precipitation samples, and sea-water samples taken at various depths from the research vessel Alliance during the Iceland-Greenland Seas Project cruise in February and March 2018. In conjunction with a simulation from a regional, isotope-enabled atmospheric model, we find that the predominant atmospheric isotope signature during predominant marine cold-air outbreak conditions is -129.8 +/- 16.6 parts per thousand for delta 2H and -18.10 +/- 2.87 parts per thousand for delta 18O, with a d-excess of 15.1 +/- 7.9 parts per thousand, indicating enhanced non-equilibrium fractionation compared to the global average. During events of warm-air intrusion from mid-latitudes, near-surface vapor becomes saturated and the vapor d-excess approaches equilibrium or becomes negative. Similarly, precipitation d-excess is lower and thus closer to equilibrium conditions during warm-air intrusions. There are indications that an evaporation signal of waters exiting the Nordic Seas through Denmark Strait could be locally enhanced over seasons to years, as supported by simple model calculations. Our findings thus suggest that evaporation signals could be transferred into the ocean isotope composition in this region, potentially enabling mass-balance constraints in isotope-enabled coupled ocean-atmosphere models. The sea area between Iceland, Greenland, and Fram Strait experiences strongly variable weather conditions during wintertime. Often, cold air sweeps over open waters, leading to intense extraction of heat and water from the ocean. Also opposite conditions can occur, where air from warmer and more humid mid-latitudes extends northward, reaches saturation, and loses heat to the underlying surface. During the Iceland-Greenland Seas Project cruise in February and March 2018, we measured the stable water isotope composition in water vapor, snow, rain, and the ocean water column at different depths. Using these measurements and a regional weather prediction model capable of simulating the isotopic composition, we find indications for an imprint of the atmospheric evaporation that is transferred into the mixed layer of the ocean over longer times. If our finding can be confirmed from additional measurements, such information can be used to constrain models with coupled atmosphere and ocean components, such as Earth System models. We observe pronounced variability in the stable isotope composition of the atmosphere-ocean system during winter Vapor and precipitation isotope variations reflect local and remote factors associated with different weather systems We find indications that weather systems can leave a cumulative d-excess imprint in the ocean mixed layer
Dense waters formed in the Nordic Seas spill across gaps in the Greenland-Scotland Ridge into the abyss of the North Atlantic to feed the lower limb of the Atlantic Meridional Overturning Circulation. The overflow water transport is well known, but open questions remain regarding where and how the dense overflow waters are formed and transported to the ridge. Here we develop a regional high-resolution version of an inverse method called Total Matrix Intercomparison, which combines hydrographic and geochemical tracer observations between 2000 and 2019 to resolve the pathways that connect the overflows to their origins. Consistent with previous studies we find two main pathways feeding the Denmark Strait Overflow Water (DSOW): the East Greenland Current and the North Icelandic Jet. Most of the water supplied by the North Icelandic Jet originates in the Greenland Sea (82 +/- 2%) and flows southward along an outer core of the East Greenland Current, as well as along a previously unknown pathway crossing the Jan Mayen Ridge into the Iceland Sea. In total, 39 +/- 2% of the DSOW originates in the Greenland Sea, while the Iceland Sea and the Atlantic Domain of the Nordic Seas account for 20 +/- 3% and 19 +/- 2%, respectively. The majority of the Faroe Bank Channel Overflow Water originates in the Greenland Sea (46 +/- 8%) and the Arctic Ocean (25 +/- 9%). These dense waters approach the sill in the Iceland-Faroe Slope Jet and along the eastern side of the Jan Mayen Ridge. The inversion reveals unprecedented details on the upstream sources and pathways of the overflows, which have not previously been obtained using observations.
In the dark ocean, respiring organisms are the main sink for dissolved oxygen. The respiration rate in a given seawater volume can be quantified through dissolved oxygen drawdown or organic matter consumption as a function of time. Estimates of dissolved oxygen utilization rates (OUR) abound in the literature, but are typically obtained using proxies of questionable accuracy, often with low vertical resolution, and neglecting key regions such as the Southern and Indian oceans. Respiration rates based on particulate (POC) or dissolved (DOC) organic carbon are also sparsely observed and for DOC unavailable in many regions. Consequently, the relative contributions of POC or DOC as a respiration substrate in the dark ocean are unknown. Here we use recent datasets of true oxygen utilization, seawater age, and DOC to derive OUR and DOC consumption-rate profiles in 10 oceanic regions. We demonstrate that although DOC and POC consumption rates are globally consistent with OUR, they underestimate OUR in the deep, suggesting strong oxygen utilization at the seafloor. In the abyss, we find a negative correlation of DOC consumption rate with seawater age, suggesting that DOC reactivity decreases along the deep branch of the conveyor circulation. Our results highlight that benthic organisms are sensitive to perturbations in the surface production of organic matter and to large-scale circulation changes that affect its supply to the abyss.
We evaluate the decadal evolution of ventilation and anthropogenic carbon (C-ant) in the Nordic Seas between 1982 and the 2010s. Ventilation changes on decadal timescale are identified by evaluating decadal changes in mean ages and apparent oxygen utilization in each of the four main basins of the Nordic Seas (the Greenland and Iceland Seas, and the Norwegian and Lofoten Basins). The ages are derived from the transient time distribution approach, based on the transient tracers chlorofluorocarbon-12 (CFC-12) and sulfur hexafluoride (SF6). The different decades show different phases in ventilation, with the 2000s being overall better ventilated than the 1990s in all basins. For the Greenland Sea, we also show that the 2010s are better ventilated than the 2000s, with a clear shift in hydrographic properties. The evolution of concentrations and inventory of C-ant is linked to the ventilation state. The deep waters get progressively older over the analyzed period, which is connected to the increased fraction of deep water from the Arctic Ocean.Plain Language Summary The ocean region between Greenland, Iceland, and Norway, called the Nordic Seas, is a main site of deep-water formation. This process produces dense waters and brings surface waters to larger depths, thereby ventilating the water below. This transports, among other things, man-made CO2 (anthropogenic carbon; C-ant) and oxygen from the atmosphere into the interior ocean, thereby reducing the amount of CO2 stored in the atmosphere. This study investigates how the ventilation has changed in the Nordic Seas from 1982 to the 2010s. We find that the ventilation has changed with time, from a rather well-ventilated state in 1982, to a reduced ventilation in the 1990s, and then a restrengthened ventilation from the 2000s.
O2_utilization_rates.mat Matlab data file containing the OUR data showed in Fig. 5. For each variable, the first dimension is for each of the 5000 Monte Carlo simulations, the second dimension is for each of the 10 regions, and the third dimension is for each of the defined isopycnals. DOC_consumption_rates.mat Matlab data file containing the OUR data showed in Fig. 5. For each variable, the first dimension is for each of the 5000 Monte Carlo simulations, the second dimension is for each of the 10 regions, and the third dimension is for each of the defined isopycnals. Results_summary.xlsx These are all the data included in Table S1, the data necessary to plot Fig. 10, and the data required to compute the spatially integrated values. OUR_data_compil.xlsx This is a short data compilation of oxygen utilisation rates, that was used to compare with results obtained in Sulpis et al. (in preparation): "Respiration patterns in the dark ocean". Data included in this file are from the following studies: Feely, R. A., Sabine, C. L., Schlitzer, R., Bullister, J. L., Mecking, S., & Greeley, D. (2004). Oxygen Utilization and Organic Carbon Remineralization in the Upper Water Column of the Pacific Ocean. Journal of Oceanography, 60, 45–52. Hinga, K. R. (1985). Evidence for a higher average primary productivity in the Pacific than in the Atlantic Ocean. Deep Sea Research Part A. Oceanographic Research Papers, 32(2), 117–126. https://doi.org/10.1016/0198-0149(85)90023-8 Karstensen, J., Stramma, L., & Visbeck, M. (2008). Oxygen minimum zones in the eastern tropical Atlantic and Pacific oceans. Progress in Oceanography, 77(4), 331–350. https://doi.org/10.1016/j.pocean.2007.05.009 Wang, W., Cai, M., Huang, P., Ke, H., Liu, M., Liu, L., Deng, H., Luo, B., Wang, C., Zheng, X., & Li, W. (2021). Transit Time Distributions and Apparent Oxygen Utilization Rates in Northern South China Sea Using Chlorofluorocarbons and Sulfur Hexafluoride Data—Wang—2021—Journal of Geophysical Research: Oceans—Wiley Online Library. Journal of Geophysical Research Oceans, 126(8). https://agupubs-onlinelibrary-wiley-com.proxy.library.uu.nl/doi/10.1029/2021JC017535 Craig, H. (1971). The deep metabolism: Oxygen consumption in abyssal ocean water. Journal of Geophysical Research (1896-1977), 76(21), 5078–5086. https://doi.org/10.1029/JC076i021p05078 Jenkins, W. J. (1998). Studying subtropical thermocline ventilation and circulation using tritium and 3He. Journal of Geophysical Research: Oceans, 103(C8), 15817–15831. https://doi.org/10.1029/98JC00141 Jenkins, W. J. (1982). Oxygen utilization rates in North Atlantic subtropical gyre and primary production in oligotrophic systems. Nature, 300(5889), 246–248. Sarmiento, J. L., Thiele, G., Key, R. M., & Moore, W. S. (1990). Oxygen and nitrate new production and remineralization in the North Atlantic subtropical gyre. Journal of Geophysical Research: Oceans, 95(C10), 18303–18315. https://doi.org/10.1029/JC095iC10p18303 Naqvi, S. W. A., Shailaja, M. S., Dileep Kumar, M., & Sen Gupta, R. (1996). Respiration rates in subsurface waters of the northern Indian Ocean: Evidence for low decomposition rates of organic matter within the water column in the Bay of Bengal. Deep Sea Research Part II: Topical Studies in Oceanography, 43(1), 73–81. https://doi.org/10.1016/0967-0645(95)00080-1 Arı́stegui, J., Denis, M., Almunia, J., & Montero, M. F. (2002). Water-column remineralization in the Indian sector of the Southern Ocean during early spring. Deep Sea Research Part II: Topical Studies in Oceanography, 49(9–10), 1707–1720. https://doi.org/10.1016/S0967-0645(02)00008-5 Broecker, W. S., Blanton, S., Smethie, W. M., & Ostlund, G. (1991). Radiocarbon decay and oxygen utilization in the Deep Atlantic Ocean. Global Biogeochemical Cycles, 5(1), 87–117. https://doi.org/10.1029/90GB02279
The Global Ocean Data Analysis Project (GLODAP) is a synthesis effort providing regular compilations of surface-to-bottom ocean biogeochemical bottle data, with an emphasis on seawater inorganic carbon chemistry and related variables determined through chemical analysis of seawater samples. GLODAPv2.2022 is an update of the previous version, GLODAPv2.2021 (Lauvset et al., 2021). The major changes are as follows: data from 96 new cruises were added, data coverage was extended until 2021, and for the first time we performed secondary quality control on all sulfur hexafluoride (SF6) data. In addition, a number of changes were made to data included in GLODAPv2.2021. These changes affect specifically the SF6 data, which are now subjected to secondary quality control, and carbon data measured on board the RV Knorr in the Indian Ocean in 1994–1995 which are now adjusted using certified reference material (CRM) measurements made at the time. GLODAPv2.2022 includes measurements from almost 1.4 million water samples from the global oceans collected on 1085 cruises. The data for the now 13 GLODAP core variables (salinity, oxygen, nitrate, silicate, phosphate, dissolved inorganic carbon, total alkalinity, pH, chlorofluorocarbon-11 (CFC-11), CFC-12, CFC-113, CCl4, and SF6) have undergone extensive quality control with a focus on systematic evaluation of bias. The data are available in two formats: (i) as submitted by the data originator but converted to World Ocean Circulation Experiment (WOCE) exchange format and (ii) as a merged data product with adjustments applied to minimize bias. For the present annual update, adjustments for the 96 new cruises were derived by comparing those data with the data from the 989 quality-controlled cruises in the GLODAPv2.2021 data product using crossover analysis. SF6 data from all cruises were evaluated by comparison with CFC-12 data measured on the same cruises. For nutrients and ocean carbon dioxide (CO2) chemistry comparisons to estimates based on empirical algorithms provided additional context for adjustment decisions. The adjustments that we applied are intended to remove potential biases from errors related to measurement, calibration, and data handling practices without removing known or likely time trends or variations in the variables evaluated. The compiled and adjusted data product is believed to be consistent to better than 0.005 in salinity, 1 % in oxygen, 2 % in nitrate, 2 % in silicate, 2 % in phosphate, 4 µmol kg−1 in dissolved inorganic carbon, 4 µmol kg−1 in total alkalinity, 0.01–0.02 in pH (depending on region), and 5 % in the halogenated transient tracers. The other variables included in the compilation, such as isotopic tracers and discrete CO2 fugacity (fCO2), were not subjected to bias comparison or adjustments. The original data, their documentation, and DOI codes are available at the Ocean Carbon and Acidification Data System of NOAA NCEI (https://www.ncei.noaa.gov/access/ocean-carbon-acidification-data-system/oceans/GLODAPv2_2022/, last access: 15 August 2022). This site also provides access to the merged data product, which is provided as a single global file and as four regional ones – the Arctic, Atlantic, Indian, and Pacific oceans – under https://doi.org/10.25921/1f4w-0t92 (Lauvset et al., 2022). These bias-adjusted product files also include significant ancillary and approximated data, which were obtained by interpolation of, or calculation from, measured data. This living data update documents the GLODAPv2.2022 methods and provides a broad overview of the secondary quality control procedures and results.
Poleward ocean heat transport is a key process in the earth system. We detail and review the northward Atlantic Water (AW) flow, Arctic Ocean heat transport, and heat loss to the atmosphere since 1900 in relation to sea ice cover. Our synthesis is largely based on a sea ice‐ocean model forced by a reanalysis atmosphere (1900–2018) corroborated by a comprehensive hydrographic database (1950–), AW inflow observations (1996–), and other long‐term time series of sea ice extent (1900–), glacier retreat (1984–), and Barents Sea hydrography (1900–). The Arctic Ocean, including the Nordic and Barents Seas, has warmed since the 1970s. This warming is congruent with increased ocean heat transport and sea ice loss and has contributed to the retreat of marine‐terminating glaciers on Greenland. Heat loss to the atmosphere is largest in the Nordic Seas (60% of total) with large variability linked to the frequency of Cold Air Outbreaks and cyclones in the region, but there is no long‐term statistically significant trend. Heat loss from the Barents Sea (∼30%) and Arctic seas farther north (∼10%) is overall smaller, but exhibit large positive trends. The AW inflow, total heat loss to the atmosphere, and dense outflow have all increased since 1900. These are consistently related through theoretical scaling, but the AW inflow increase is also wind‐driven. The Arctic Ocean CO2 uptake has increased by ∼30% over the last century—consistent with Arctic sea ice loss allowing stronger air‐sea interaction and is ∼8% of the global uptake.
Due to low calcium carbonate saturation states, and winter mixing that brings anthropogenic carbon to the deep ocean, the Nordic Seas and their cold-water corals are vulnerable to ocean acidification. Here, we present a detailed investigation of the changes in pH and aragonite saturation in the Nordic Seas from preindustrial times to 2100, by using in situ observations, gridded climatological data, and projections for three different future scenarios with the Norwegian Earth System Model (NorESM1-ME). During the period of regular ocean biogeochemistry observations from 1981–2019, the pH decreased with rates of 2–3 × 10⁻³ yr−1 in the upper 200 m of the Nordic Seas. In some regions, the pH decrease can be detected down to 2000 m depth. This resulted in a decrease in the aragonite saturation state, which is now close to undersaturation in the depth layer of 1000–2000 m. The model simulations suggest that the pH of the Nordic Seas will decrease at an overall faster rate than the global ocean from the preindustrial era to 2100, bringing the Nordic Seas' pH closer to the global average. In the esmRCP8.5 scenario, the whole water column is projected to be undersaturated with respect to aragonite at the end of the 21st century, thereby endangering all cold-water corals of the Nordic Seas. In the esmRCP4.5 scenario, the deepest cold-water coral reefs are projected to be exposed to undersaturation. Exposure of all cold-water corals to corrosive waters can only be avoided with marginal under the esmRCP2.6 scenario. Over all timescales, the main driver of the pH drop is the increase in dissolved inorganic carbon (CT) caused by the raising anthropogenic CO2, followed by the temperature increase. Thermodynamic salinity effects are of secondary importance. We find substantial changes in total alkalinity (AT) and CT as a result of the salinification, or decreased freshwater content, of the Atlantic water during all time periods, and as a result of an increased freshwater export in polar waters in past and future scenarios. However, the net impact of this decrease (increase) in freshwater content on pH is negligible, as the effects of a concentration (dilution) of CT and AT are canceling.
Towards better understanding of carbon and oxygen biogeochemical rates in the Red Sea Salma Elageed1,3 , A M. Omar2, Emil Jeansson2, Elsheikh B. Ali1 , Ingunn Skjelvan2 , Knut Barthel3 , Truls Johannessen3, P.Zhai4 1Institute of Marine Research, Red Sea University, Port Sudan, Sudan 2 NORCE, Norwegian Research Centre, Bjerknes Centre for Climate Research, Bergen, Norway 3 Geophysical Institute, University of Bergen, Bergen, Norway 4 Geoscience Dept., Princeton University, USA Abstract The Red Sea is one of the warmest and saltiest seas in the world, with surface water temperatures of 26–30°C and salinities of 36–41. The sea gains heat in the south and loses heat in the north and this gives a large-scale thermohaline circulation pattern with a northward surface flow and a southward flow at sill depth. At smaller spatial scales, along-coastal currents and upwelling occur. Here we summarise the main results from two studies that are parts of a PhD-study. We demonstrate how multi-spatial scale circulation and biological processes influence rates of: air-sea flux of carbon dioxide (CO2), oxygen utilization (OU), and removal of total alkalinity by calcification and sedimentation, i.e., alkalinity utilization (AU). In the first study, based on cruise data collected in the Red Sea in 2011 and 1982 (Aegaeo and MEROU cruises, respectively), we combine depth profiles of tracer-based water mass ages, AU, and OU to derive the first-ever basin-wide, long time integrated utilization rates of alkalinity (AUR) and oxygen (OUR). Results reveal that the large-scale circulation impacts the water masse ages and OU while remineralization of organic matter and calcification also influences in depth variations of OU and AU. The highest rates for OUR and AUR occur in the surface water followed by a swift attenuation of the rates towards zero for AUR and ~5 µmol kg-1 for OUR at 500 m depth. In the second study, new carbon and hydrography data from the Sudanese coastal Red Sea were used to investigate seasonal dynamics of sea surface partial pressure of CO2 (pCO2) and air–sea CO2 exchange. The results show that seasonal pCO2 change was primarily driven by temperature changes while along-coast advection, upwelling of CO2-rich deep water, and uptake of atmospheric CO2 also contributed to changes in dissolved inorganic carbon and total alkalinity. Furthermore, based on a compilation of historical and our new data, the region seems to have transformed from being a source of CO2 to the atmosphere throughout the year to becoming a sink of CO2 during parts of the year.
 Are Olsen合作论文数Geophysical Institute, University of Bergen57
 Siv K. Lauvset合作论文数51
 Toste Tanhua合作论文数44
 Robert Key合作论文数Program in Atmospheric and Oceanic Sciences, Princeton University36
 Sara Jutterström合作论文数IVL Swedish Environmental Research Institute36Reiner Steinfeldt合作论文数36
 B. Pfeil合作论文数Sektion Physik der Universität München Theresienstrasse 37 D-8000 Munich 2 Germany Theresienstrasse 37 D-8000 Munich 2 Germany33
 Carsten Schirnick合作论文数33
 Masao Ishii (石井雅男)合作论文数Department of Climate and Geochemistry Research, Meteorological Research Institute33A. Velo合作论文数Facultad de Ciencias del Mar, Universidad de Vigo32
 Jan Marinus Hoppema合作论文数Helmholtz Centre for Polar and Marine Research, Alfred Wegener Institute;Department Physical Oceanography of Polar Seas, Alfred Wegener Institute;University of Applied Sciences Bremerhaven31
 S. M. A. C. (Steven) Van Heuven合作论文数Centre for Isotope Research, Faculty of Science and Engineering, University of Groningen27
 Fiz Fernández Pérez合作论文数Instituto de Investigaciones Marinas de Vigo22
 Abdirahman M. Omar合作论文数University of Bergen, University of Bergen20Alex Kozyr合作论文数19
 K. Anders Olsson合作论文数Bjerknes Centre for Climate Research19
 Marta Álvarez合作论文数Centro Oceanográfico de A Coruña, Instituto Español de Oceanografia19Peter J. Brown合作论文数17
 Leif Anderson合作论文数Department of Marine Sciences, University of Gothenburg16Akihiko Murata合作论文数16A. Kozyr合作论文数15toru suzuki合作论文数15
 Bronte Tilbrook合作论文数Antarctic Climate and Ecosystems Cooperative Research Centre;Commonwealth Scientific and Industrial Research Organisation15Carter Brendan R合作论文数14
 Richard Bellerby合作论文数SKLEC - NIVA Centre for Marine and Coastal Research, State Key Laboratory of Estuarine and Coastal Research, East China Normal University;Norwegian Institute for Water Research14Bittig Henry合作论文数14
 Richard (Rik) Wanninkhof合作论文数NOAA's Atlantic Oceanographic and Meteorological Laboratory, U.S. Department of Commerce14Nico Lange合作论文数13
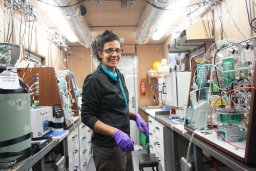 Leticia Cotrim Da Cunha合作论文数13Susan Becker合作论文数12
 Truls Johannessen合作论文数12T. Tanhua合作论文数11t johannessen合作论文数10
 Richard A. Feely合作论文数Pacific Marine Environmental Laboratory, National Oceanic and Atmospheric Administration;Department of Oceanography, University of Washington10
 Claire Lo Monaco合作论文数10Jon Olafsson合作论文数9
 Marie-Jose Messias合作论文数College of Life and Environmental Sciences, University of Exeter9
 Ingunn Skjelvan合作论文数9Kumiko Azetsu-Scott合作论文数9X. Lin合作论文数8
 Ryan Woosley合作论文数Earth, Atmospheric and Planetary Sciences, Massachusetts Institute of Technology8Solveig Olafsdottir合作论文数Pelagic Department, Marine and Freshwater Research Institute8
 Jerry Tjiputra合作论文数Division of Climate & Environment, Norce;Bjerknes Centre for Climate Research8I. Skjelvan合作论文数7S. Jutterström合作论文数7L. Mintrop,合作论文数7
 Kjetil Våge合作论文数Geophys Inst, Univ Bergen7John L Bullister合作论文数7J. Blindheim,合作论文数6




