The interpretation of cryo-EM maps often includes the docking of known or predicted structures of the components, which is particularly useful when the map resolution is worse than 4 Å. Although it can be effective to search the entire map to find the best placement of a component, the process can be slow when the maps are large. However, frequently there is a well-founded hypothesis about where particular components are located. In such cases, a local search using a map subvolume will be much faster because the search volume is smaller, and more sensitive because optimizing the search volume for the rotation-search step enhances the signal to noise. A Fourier-space likelihood-based local search approach, based on the previously published em_placement software, has been implemented in the new emplace_local program. Tests confirm that the local search approach enhances the speed and sensitivity of the computations. An interactive graphical interface in the ChimeraX molecular-graphics program provides a convenient way to set up and evaluate docking calculations, particularly in defining the part of the map into which the components should be placed.
Advances in computational tools for atomic model building are leading to accurate models of large molecular assemblies seen in electron microscopy, often at challenging resolutions of 3-4 Å. We describe new methods in the UCSF ChimeraX molecular modeling package that take advantage of machine-learning structure predictions, provide likelihood-based fitting in maps, and compute per-residue scores to identify modeling errors. Additional model-building tools assist analysis of mutations, post-translational modifications, and interactions with ligands. We present the latest ChimeraX model-building capabilities, including several community-developed extensions. ChimeraX is available free of charge for noncommercial use at https://www.rbvi.ucsf.edu/chimerax.
MOTIVATION:Knowledge graphs (KGs) are being adopted in industry, commerce and academia. Biomedical KG presents a challenge due to the complexity, size and heterogeneity of the underlying information. RESULTS:In this work, we present the Scalable Precision Medicine Open Knowledge Engine (SPOKE), a biomedical KG connecting millions of concepts via semantically meaningful relationships. SPOKE contains 27 million nodes of 21 different types and 53 million edges of 55 types downloaded from 41 databases. The graph is built on the framework of 11 ontologies that maintain its structure, enable mappings and facilitate navigation. SPOKE is built weekly by python scripts which download each resource, check for integrity and completeness, and then create a 'parent table' of nodes and edges. Graph queries are translated by a REST API and users can submit searches directly via an API or a graphical user interface. Conclusions/Significance: SPOKE enables the integration of seemingly disparate information to support precision medicine efforts. AVAILABILITY AND IMPLEMENTATION:The SPOKE neighborhood explorer is available at https://spoke.rbvi.ucsf.edu. SUPPLEMENTARY INFORMATION:Supplementary data are available at Bioinformatics online.
Single-cell RNA-sequencing (scRNA-seq) has revolutionized molecular biology and medicine by enabling high-throughput studies of cellular heterogeneity in diverse tissues. Applying network biology approaches to scRNA-seq data can provide useful insights into genes driving heterogeneous cell-type compositions of tissues. Here, we present scNetViz — a Cytoscape app to aid biological interpretation of cell clusters in scRNA-seq data using network analysis. scNetViz calculates the differential expression of each gene across clusters and then creates a cluster-specific gene functional interaction network between the significantly differentially expressed genes for further analysis, such as pathway enrichment analysis. To automate a complete data analysis workflow, scNetViz integrates parts of the Scanpy software, which is a popular Python package for scRNA-seq data analysis, with Cytoscape apps such as stringApp, cyPlot, and enhancedGraphics. We describe our implementation of methods for accessing data from public single cell atlas projects, differential expression analysis, visualization, and automation. scNetViz enables users to analyze data from public atlases or their own experiments, which we illustrate with two use cases. Analysis can be performed via the Cytoscape GUI or CyREST programming interface using R (RCy3) or Python (py4cytoscape).
Single-cell RNA-sequencing (scRNA-seq) has revolutionized molecular biology and medicine by enabling high-throughput studies of cellular heterogeneity in diverse tissues. Applying network biology approaches to scRNA-seq data can provide useful insights into genes driving heterogeneous cell-type compositions of tissues. Here, we present scNetViz — a Cytoscape app to aid biological interpretation of cell clusters in scRNA-seq data using network analysis. scNetViz calculates the differential expression of each gene across clusters and then creates a cluster-specific gene functional interaction network between the significantly differentially expressed genes for further analysis, such as pathway enrichment analysis. To automate a complete data analysis workflow, scNetViz integrates parts of the Scanpy software, which is a popular Python package for scRNA-seq data analysis, with Cytoscape apps such as stringApp, cyPlot, and enhancedGraphics. We describe our implementation of methods for accessing data from public single cell atlas projects, differential expression analysis, visualization, and automation. scNetViz enables users to analyze data from public atlases or their own experiments, which we illustrate with two use cases. Analysis can be performed via the Cytoscape GUI or CyREST programming interface using R (RCy3) or Python (py4cytoscape).
UCSF ChimeraX is the next-generation interactive visualization program from the Resource for Biocomputing, Visualization, and Informatics (RBVI), following UCSF Chimera. ChimeraX brings (a) significant performance and graphics enhancements; (b) new implementations of Chimera's most highly used tools, many with further improvements; (c) several entirely new analysis features; (d) support for new areas such as virtual reality, light-sheet microscopy, and medical imaging data; (e) major ease-of-use advances, including toolbars with icons to perform actions with a single click, basic "undo" capabilities, and more logical and consistent commands; and (f) an app store for researchers to contribute new tools. ChimeraX includes full user documentation and is free for noncommercial use, with downloads available for Windows, Linux, and macOS from https://www.rbvi.ucsf.edu/chimerax.
Background: Identification of cell type subpopulations from complex cell mixtures using single-cell RNA-sequencing (scRNA-seq) data includes automated steps from normalization to cell clustering. However, assigning cell type labels to cell clusters is often conducted manually, resulting in limited documentation, low reproducibility and uncontrolled vocabularies. This is partially due to the scarcity of reference cell type signatures and because some methods support limited cell type signatures. Methods: In this study, we benchmarked five methods representing first-generation enrichment analysis (ORA), second-generation approaches (GSEA and GSVA), machine learning tools (CIBERSORT) and network-based neighbor voting (METANEIGHBOR), for the task of assigning cell type labels to cell clusters from scRNA-seq data. We used five scRNA-seq datasets: human liver, 11 Tabula Muris mouse tissues, two human peripheral blood mononuclear cell datasets, and mouse retinal neurons, for which reference cell type signatures were available. The datasets span Drop-seq, 10X Chromium and Seq-Well technologies and range in size from ~3,700 to ~68,000 cells. Results: Our results show that, in general, all five methods perform well in the task as evaluated by receiver operating characteristic curve analysis (average area under the curve (AUC) = 0.91, sd = 0.06), whereas precision-recall analyses show a wide variation depending on the method and dataset (average AUC = 0.53, sd = 0.24). We observed an influence of the number of genes in cell type signatures on performance, with smaller signatures leading more frequently to incorrect results. Conclusions: GSVA was the overall top performer and was more robust in cell type signature subsampling simulations, although different methods performed well using different datasets. METANEIGHBOR and GSVA were the fastest methods. CIBERSORT and METANEIGHBOR were more influenced than the other methods by analyses including only expected cell types. We provide an extensible framework that can be used to evaluate other methods and datasets at https://github.com/jdime/scRNAseq_cell_cluster_labeling.
Background: Identification of cell type subpopulations from complex cell mixtures using single-cell RNA-sequencing (scRNA-seq) data includes automated steps from normalization to cell clustering. However, assigning cell type labels to cell clusters is often conducted manually, resulting in limited documentation, low reproducibility and uncontrolled vocabularies. This is partially due to the scarcity of reference cell type signatures and because some methods support limited cell type signatures. Methods: In this study, we benchmarked five methods representing first-generation enrichment analysis (ORA), second-generation approaches (GSEA and GSVA), machine learning tools (CIBERSORT) and network-based neighbor voting (METANEIGHBOR), for the task of assigning cell type labels to cell clusters from scRNA-seq data. We used five scRNA-seq datasets: human liver, 11 Tabula Muris mouse tissues, two human peripheral blood mononuclear cell datasets, and mouse retinal neurons, for which reference cell type signatures were available. The datasets span Drop-seq, 10X Chromium and Seq-Well technologies and range in size from ~3,700 to ~68,000 cells. Results: Our results show that, in general, all five methods perform well in the task as evaluated by receiver operating characteristic curve analysis (average area under the curve (AUC) = 0.91, sd = 0.06), whereas precision-recall analyses show a wide variation depending on the method and dataset (average AUC = 0.53, sd = 0.24). We observed an influence of the number of genes in cell type signatures on performance, with smaller signatures leading more frequently to incorrect results. Conclusions: GSVA was the overall top performer and was more robust in cell type signature subsampling simulations, although different methods performed well using different datasets. METANEIGHBOR and GSVA were the fastest methods. CIBERSORT and METANEIGHBOR were more influenced than the other methods by analyses including only expected cell types. We provide an extensible framework that can be used to evaluate other methods and datasets at https://github.com/jdime/scRNAseq_cell_cluster_labeling.
The radical SAM superfamily contains over 100,000 homologous enzymes that catalyze a remarkably broad range of reactions required for life, including metabolism, nucleic acid modification, and biogenesis of cofactors. While the highly conserved SAM-binding motif responsible for formation of the key 5'-deoxyadenosyl radical intermediate is a key structural feature that simplifies identification of superfamily members, our understanding of their structure-function relationships is complicated by the modular nature of their structures, which exhibit varied and complex domain architectures. To gain new insight about these relationships, we classified the entire set of sequences into similarity-based subgroups that could be visualized using sequence similarity networks. This superfamily-wide analysis reveals important features that had not previously been appreciated from studies focused on one or a few members. Functional information mapped to the networks indicates which members have been experimentally or structurally characterized, their known reaction types, and their phylogenetic distribution. Despite the biological importance of radical SAM chemistry, the vast majority of superfamily members have never been experimentally characterized in any way, suggesting that many new reactions remain to be discovered. In addition to 20 subgroups with at least one known function, we identified additional subgroups made up entirely of sequences of unknown function. Importantly, our results indicate that even general reaction types fail to track well with our sequence similarity-based subgroupings, raising major challenges for function prediction for currently identified and new members that continue to be discovered. Interactive similarity networks and other data from this analysis are available from the Structure-Function Linkage Database.
Can virtual reality be useful for visualizing and analyzing molecular structures and three-dimensional (3D) microscopy? Uses we are exploring include studies of drug binding to proteins and the effects of mutations, building accurate atomic models in electron microscopy and x-ray density maps, understanding how immune system cells move using 3D light microscopy, and teaching schoolchildren about biomolecules that are the machinery of life. Virtual reality (VR) offers immersive display with a wide field of view and head tracking for better perception of molecular architectures and uses 6-degree-of-freedom hand controllers for simple manipulation of 3D data. Conventional computer displays with trackpad, mouse and keyboard excel at two-dimensional tasks such as writing and studying research literature, uses for which VR technology is at present far inferior. Adding VR to the conventional computing environment could improve 3D capabilities if new user-interface problems can be solved. We have developed three VR applications: ChimeraX for analyzing molecular structures and electron and light microscopy data, AltPDB for collaborative discussions around atomic models, and Molecular Zoo for teaching young students characteristics of biomolecules. Investigations over three decades have produced an extensive literature evaluating the potential of VR in research and education. Consumer VR headsets are now affordable to researchers and educators, allowing direct tests of whether the technology is valuable in these areas. We survey here advantages and disadvantages of VR for molecular biology in the context of affordable and dramatically more powerful VR and graphics hardware than has been available in the past.
With ever-increasing amounts of sequence data available in both the primary literature and sequence repositories, there is a bottleneck in annotating molecular function to a sequence. This article describes the biocuration process and methods used in the structure-function linkage database (SFLD) to help address some of the challenges. We discuss how the hierarchy within the SFLD allows us to infer detailed functional properties for functionally diverse enzyme superfamilies in which all members are homologous, conserve an aspect of their chemical function and have associated conserved structural features that enable the chemistry. Also presented is the Enzyme Structure-Function Ontology (ESFO), which has been designed to capture the relationships between enzyme sequence, structure and function that underlie the SFLD and is used to guide the biocuration processes within the SFLD.Database URL:http://sfld.rbvi.ucsf.edu/.
Three-dimensional (3D) motifs are patterns of local structure associated with function, typically based on residues in binding or catalytic sites. Protein structures of unknown function can be annotated by comparing them to known 3D motifs. Many methods have been developed for identifying 3D motifs and for searching structures for their occurrence. Approaches vary in the type and amount of input evidence, how the motifs are described and matched, whether the results include a measure of statistical significance, and how the motifs relate to function. Compared to algorithm development, less progress has been made in providing pub licly searchable databases of 3D motifs that are both functionally specific and cover a broad range of functions. A roadblock has been the difficulty of generating detailed structure-function classifications; instead, automated, large-scale studies have relied upon pre-existing classifications of either structure or function. Complementary to 3D motif methods are approaches focused on molecular surface descriptions, global structure (fold) comparisons, predicting interactions with other macromolecules, and identifying physiological substrates by docking databases of small molecules.
UCSF ChimeraX is next-generation software for the visualization and analysis of molecular structures, density maps, 3D microscopy, and associated data. It addresses challenges in the size, scope, and disparate types of data attendant with cutting-edge experimental methods, while providing advanced options for high-quality rendering (interactive ambient occlusion, reliable molecular surface calculations, etc.) and professional approaches to software design and distribution. This article highlights some specific advances in the areas of visualization and usability, performance, and extensibility. ChimeraX is free for noncommercial use and is available from http://www.rbvi.ucsf.edu/chimerax/ for Windows, Mac, and Linux.
Integrating access to web services with desktop applications allows for an expanded set of application features, including performing computationally intensive tasks and convenient searches of databases. We describe how we have enhanced UCSF Chimera (http://www.rbvi.ucsf.edu/chimera/), a program for the interactive visualization and analysis of molecular structures and related data, through the addition of several web services (http://www.rbvi.ucsf. edu/chimera/docs/webservices.html). By streamlining access to web services, including the entire job submission, monitoring and retrieval process, Chimera makes it simpler for users to focus on their science projects rather than data manipulation. Chimera uses Opal, a toolkit for wrapping scientific applications as web services, to provide scalable and transparent access to several popular software packages. We illustrate Chimera’s use of web services with an example workflow that interleaves use of these services with interactive manipulation of molecular sequences and structures, and we provide an example Python program to demonstrate how easily Opal-based web services can be accessed from within an application. Web server availability: http://webservices.rbvi.ucsf.edu/ opal2/dashboard?command=serviceList.
Integrating access to web services with desktop applications allows for an expanded set of application features, including performing computationally intensive tasks and convenient searches of databases. We describe how we have enhanced UCSF Chimera (http://www.rbvi.ucsf.edu/chimera/), a program for the interactive visualization and analysis of molecular structures and related data, through the addition of several web services (http://www.rbvi.ucsf.edu/chimera/docs/webservices.html). By streamlining access to web services, including the entire job submission, monitoring and retrieval process, Chimera makes it simpler for users to focus on their science projects rather than data manipulation. Chimera uses Opal, a toolkit for wrapping scientific applications as web services, to provide scalable and transparent access to several popular software packages. We illustrate Chimera's use of web services with an example workflow that interleaves use of these services with interactive manipulation of molecular sequences and structures, and we provide an example Python program to demonstrate how easily Opal-based web services can be accessed from within an application. Web server availability: http://webservices.rbvi.ucsf.edu/opal2/dashboard?command=serviceList.
Structural modeling of macromolecular complexes greatly benefits from interactive visualization capabilities. Here we present the integration of several modeling tools into UCSF Chimera. These include comparative modeling by MODELLER, simultaneous fitting of multiple components into electron microscopy density maps by IMP MultiFit, computing of small-angle X-ray scattering profiles and fitting of the corresponding experimental profile by IMP FoXS, and assessment of amino acid sidechain conformations based on rotamer probabilities and local interactions by Chimera.
In functionally diverse enzyme superfamilies (SFs), conserved structural and active site features reflect catalytic capabilities 'hard-wired' in each SF architecture. Overlaid on this foundation, evolutionary changes in active site machinery, structural topology and other aspects of structural organization and interactions support the emergence of new reactions, mechanisms, and substrate specificity. This review connects topological with functional variation in each of the haloalkanoic acid dehalogenase (HAD) and vicinal oxygen chelate fold (VOC) SFs and a set of redox-active thioredoxin (Trx)-fold SFs to illustrate a few of the varied themes nature has used to evolve new functions from a limited set of structural scaffolds.
ModBase (http://salilab.org/modbase) is a database of annotated comparative protein structure models. The models are calculated by ModPipe, an automated modeling pipeline that relies primarily on Modeller for fold assignment, sequence-structure alignment, model building and model assessment (http://salilab.org/modeller/). ModBase currently contains 10,355,444 reliable models for domains in 2,421,920 unique protein sequences. ModBase allows users to update comparative models on demand, and request modeling of additional sequences through an interface to the ModWeb modeling server (http://salilab.org/modweb). ModBase models are available through the ModBase interface as well as the Protein Model Portal (http://www.proteinmodelportal.org/). Recently developed associated resources include the SALIGN server for multiple sequence and structure alignment (http://salilab.org/salign), the ModEval server for predicting the accuracy of protein structure models (http://salilab.org/modeval), the PCSS server for predicting which peptides bind to a given protein (http://salilab.org/pcss) and the FoXS server for calculating and fitting Small Angle X-ray Scattering profiles (http://salilab.org/foxs).
Linking proteomics and structural data is critical to our understanding of cellular processes, and interactive exploration of these complementary data sets can be extremely valuable for developing or confirming hypotheses in silico. However, few computational tools facilitate linking these types of data interactively. In addition, the tools that do exist are neither well understood nor widely used by the proteomics or structural biology communities. We briefly describe several relevant tools, and then, using three scenarios, we present in depth two tools for the integrated exploration of proteomics and structural data.
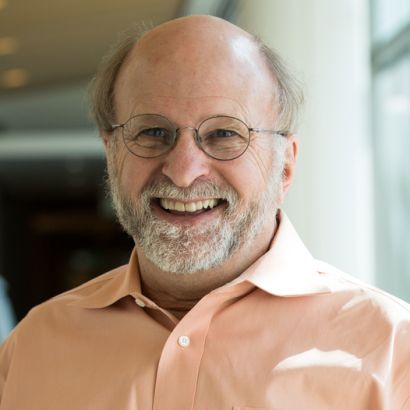 Thomas E. Ferrin合作论文数Department of Pharmaceutical Chemistry, School of Pharmacy, University of California;Department of Bioengineering and Therapeutic Sciences, University of California, San Francisco19
 John H. Morris合作论文数Department of Pharmaceutical Chemistry, University of California San Francisco17Conrad C. Huang合作论文数17
 Patricia Babbitt合作论文数Department of Bioengineering and Therapeutic Sciences, University of California, San Francisco;California Institute for Quantitative Biosciences, University of California, San Francisco;Department of Pharmaceutical Chemistry, School of Pharmacy, University of California, San Francisco12Eric F. Pettersen合作论文数12
 Irwin D. "Tack" Kuntz, Jr合作论文数Department of Pharmaceutical Chemistry, University of California, San Francisco;Molecular Design Institute, University of California, San Francisco;School of Pharmacy, University of California, San Francisco10
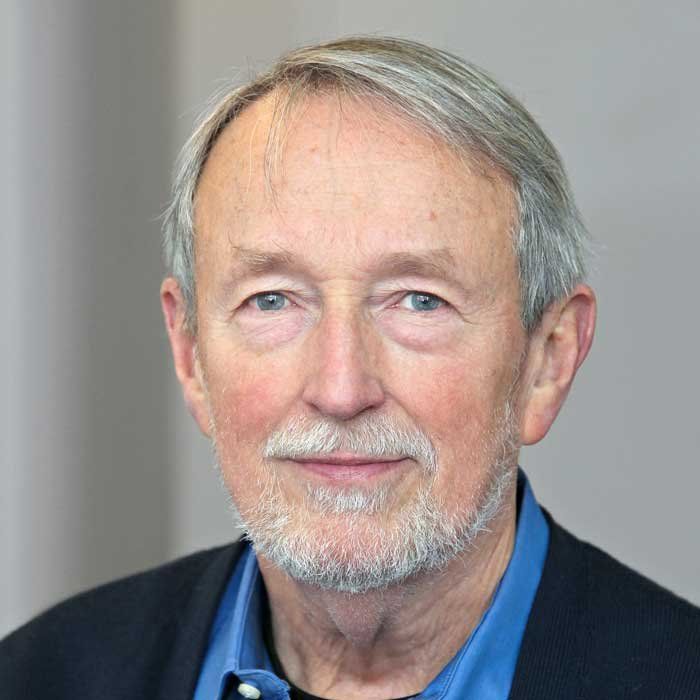 Henry Bourne合作论文数Department of Cellular and Molecular Pharmacology, University of California, San Francisco10Thomas D. Goddard合作论文数8Greg Couch合作论文数6
 Thomas Baranski合作论文数Departments of Medicine and of Molecular Biology & Pharmacology, 660 S. Euclid Ave., Campus Box 8127, St. Louis, Missouri 63110, USA6
 Alex Pico合作论文数Gladstone Institutes6
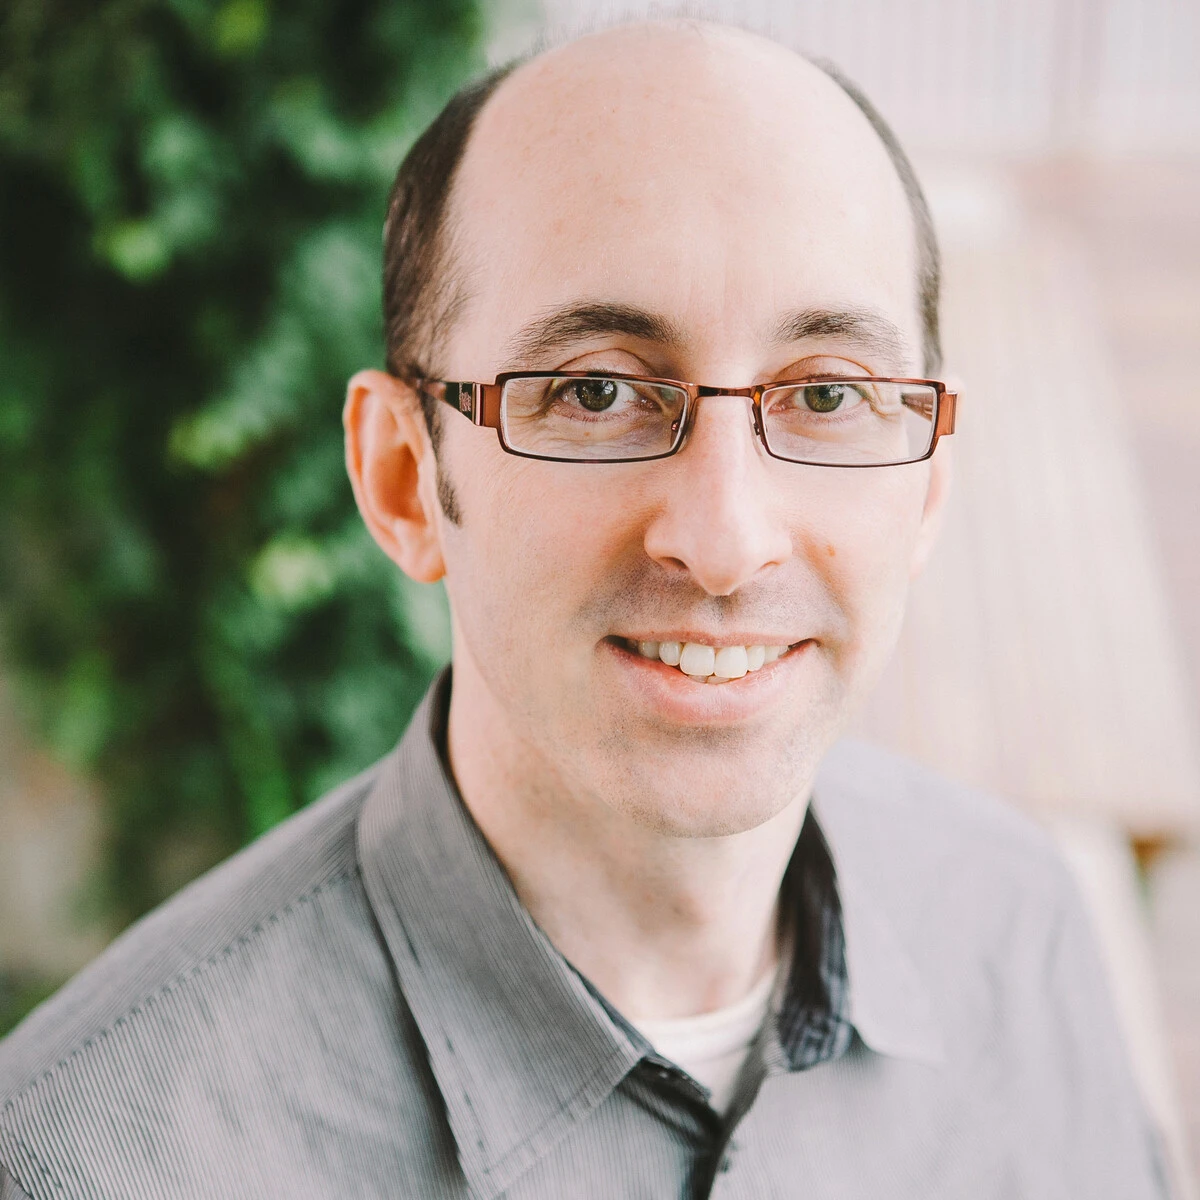 Gary Bader合作论文数Donnelly Centre for Cellular and Biomolecular Research, University of Toronto;Department of Molecular Genetics, Temerty Faculty of Medicine, University of Toronto5Shoshana Brown合作论文数5
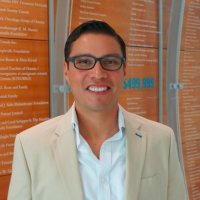 J. Javier Díaz-Mejía合作论文数Terrence Donnelly Center for Cellular and Biomolecular Research, University of Toronto5
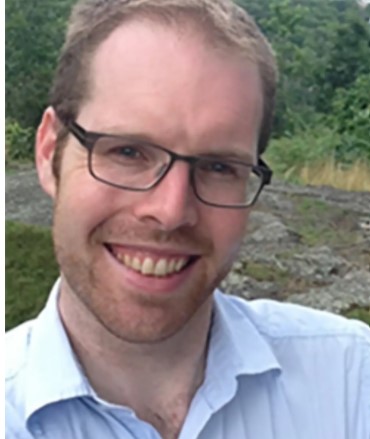 Trevor Pugh合作论文数Department of Medical Biophysics, Temerty Faculty of Medicine, University of Toronto;Princess Margaret Cancer Centre, University Health Network;Translational Genomics Laboratory, Ontario Institute for Cancer Research4Sonya MacParland合作论文数Department of Immunology, Temerty Faculty of Medicine, University of Toronto4Ketela Troy合作论文数4Taroh Iiri合作论文数4
 Eyal Akiva合作论文数Department of Molecular Genetics and Biotechnology;Faculty of Medicine;Hebrew University of Jerusalem;Faculty of Medicine, Hebrew University of Jerusalem4Basil O. Gerber合作论文数4
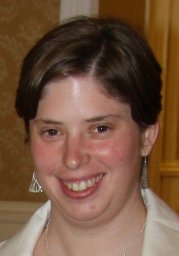 Gemma L. Holliday合作论文数EMBL Outstation, European Bioinformatics Institute Wellcome Trust Genome Campus4Michael A. Hicks合作论文数3Scott C.-H. Pegg合作论文数3
 Søren P Sheikh合作论文数3Ojha Sunil合作论文数3
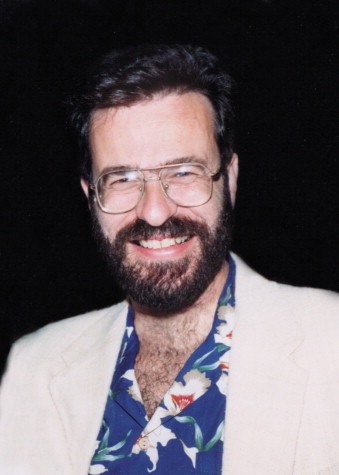 Peter Andrew Kollman合作论文数Department of Pharmaceutical Chemistry, University of California, San Francisco3
 Andrej Sali合作论文数Department of Bioengineering and Therapeutic Sciences, School of Pharmacy, University of California, San Francisco;Department of Pharmaceutical Chemistry, School of Pharmacy, University of California, San Francisco3Benjamin J. Polacco合作论文数Department of Pharmaceutical Chemistry, University of California San Francisco3David Mischel合作论文数3joshua trueheart合作论文数2
 Brian Shoichet合作论文数Department of Pharmaceutical Chemistry, School of Pharmacy, University of California, San Francisco;Department of Cellular and Molecular Pharmacology, University of California, San Francisco2
 Richard A. Lewis合作论文数Cedars-Sinai Medical Center2
 Tristan I. Croll合作论文数Australian Institute for Bioengineering and Nanotechnology, University of Queensland2
 Paul Herzmark合作论文数2
 Ursula Pieper合作论文数National Agricultural Library, US Department of Agriculture Agricultural Research Service;UPsites Web Studio2
 Doug Stryke合作论文数Department of Pharmaceutical Chemistry, University of California San Francisco2Patricia J. Chang合作论文数2Daniel M. Greenblatt合作论文数2Robert A. Nissenson合作论文数2
 Olivier Lichtarge合作论文数Computational and Integrative Biomedical Research Center, Baylor College of Medicine;Dan L Duncan Comprehensive Cancer Center, Baylor College of Medicine;Department of Molecular and Human Genetics, Baylor College of Medicine2Daniel E. Almonacid合作论文数1James W. Caldwell合作论文数1Ben Webb合作论文数1Thomas Skillman合作论文数1Florian Lauck合作论文数1Karin Mullendorff合作论文数1Gabriel Cerono合作论文数1Krish Bharat合作论文数1




