Accurate surface reflectance retrieval in tropical forests remains challenging due to strong directional reflectance effects (BRDF) and limited observation opportunities caused by persistent cloud cover. Here, we present a sensor-adapted, physically based BRDF correction framework specifically designed for Sentinel-2 imagery over dense tropical forests. Using space-for-time substitution to calibrate Ross–Thick Li–Sparse (RTLS) models across central African forests, we derive Sentinel-2–specific parameters for nine spectral bands and apply a rigorous validation scheme based on spatiotemporally independent data.We demonstrate that our original calibration approach is not only feasible but necessary, given the amplitude of directional effects on raw forest reflectance – and the limited performances of MODIS-based correction models. The RTLS model, despite being originally developed for coarser resolutions, remains highly effective at S-2 scale, with mean relative percent absolute differences (MRPAD) reductions by up to 70% compared to uncorrected data, and by more than 50% on average compared to MODIS-derived BRDF parameters. Validation across continents confirmed the generalizability of the proposed coefficients.More than ten years after the launch of Sentinel-2, and as tropical forest monitoring becomes increasingly critical for climate and biodiversity applications, fully exploiting the sensor's spatial and spectral capabilities requires robust BRDF correction. To facilitate operational use, the proposed tools are distributed as both a Google Earth Engine script and an R package, enabling scalable and reproducible directional correction.
Estimating emissions and removals from forest degradation is important, yet challenging, for many countries. This paper reports results from analysis of country reporting (to the United Nations Framework Convention on Climate Change and also to several climate finance initiatives) and key take-aways from a south-south exchange workshop among 17 countries with forest mitigation programmes. During the workshop discussions it became clear that, where forest degradation is a major source of emissions, governments want to include it when reporting on their mitigation efforts. However, challenges to accurately estimating emissions from degradation relate to defining forest degradation and setting the scope for estimating carbon stock changes; to detecting and monitoring degradation using earth observation data; and to estimating associated emissions and removals from field observation results. The paper concludes that recent and ongoing investments into data and analysis methods have helped improve forest degradation estimation, but further methodological work and continued effort will be needed.
Introduction: Costa Rica is committed to addressing environmental issues by involving a range of strategies and policies, with goals of sustainability and conservation. Nonetheless, addressing many challenges remains necessary, with the prominent issue of illegal activities, such as logging and land use change. Objective: To evaluate the direct detection capacity of tree cover losses caused by logging within the various land uses of the landscape, and their relationship with physical variables of the environment such as slope and proximity to the road network using remote sensing techniques. Methods: Tree cover losses were detected using time series analysis of the Normalized Difference Vegetation Index (NDVI) from Landsat and Sentinel images (S2) through the Breaks for Additive Season and Trend (BFAST) algorithm in The Golfo Dulce Forest Reserve (RFGD) and the Amistosa Biological Corridor (CBA). Selected sites where logging was detected were physically visited in the field and inspected using Unmanned Aerial Vehicles (UAVs). The results were analyzed through confusion matrices to determine the algorithms accuracy to detect illegal logging. Results: The study highlighted a significant relationship between NDVI change and logging activities on the ground. In areas with major NDVI changes (less than -500), the model accuracy was greater than 75 %. In addition, there is a significant relationship between logged areas and slope, and distance to roads. Conclusions: The proposed methodological approach allows identifying forest cover logging activities in space and time. It could be adopted and complement field operations to improve monitoring of illegal logging.
A third of the world’s ecosystems are considered degraded, and there is an urgent need for protection and restoration to make the planet healthier. The Sustainable Development Goals (SDGs) target 15.3 aims at protecting and restoring the terrestrial ecosystem to achieve a land degradation-neutral world by 2030. Land restoration through inclusive and productive growth is indispensable to promote sustainable development by fostering climate change-resistant, poverty-alleviating, and environmentally protective economic growth. The SDG Indicator 15.3.1 is used to measure progress towards a land degradation-neutral world. Earth observation datasets are the primary data sources for deriving the three sub-indicators of indicator 15.3.1. It requires selecting, querying, and processing a substantial historical archive of data. To reduce the complexities, make the calculation user-friendly, and adapt it to in-country applications, a module on the FAO’s SEPAL platform has been developed in compliance with the UNCCD Good Practice Guidance (GPG v2) to derive the necessary statistics and maps for monitoring and reporting land degradation. The module uses satellite data from Landsat, Sentinel 2, and MODIS sensors for primary productivity assessment, along with other datasets enabling high-resolution to large-scale assessment of land degradation. The use of an in-country land cover transition matrix along with in-country land cover data enables a more accurate assessment of land cover changes over time. Four different case studies from Bangladesh, Nigeria, Uruguay, and Angola are presented to highlight the prospect and challenges of monitoring land degradation using various datasets, including LCML-based national land cover legend and land cover data.
Ukraine plays an important role in global food security. Ukraine produces about half of the global sunflower oil production, and Ukraine-produced barley, corn, wheat and rapeseed are exported to Europe, China, India, North Africa and the Middle East countries. However, after the invasion of Russia in February 2022 and blocking the ports in Black Sea, the global food prices increased. Uncertainties over crop production over the Russia-occupied territories in Ukraine also impacted the food prices. In this paper, we developed approaches to detect and map crop planted areas over Ukraine using Synthetic Aperture Radar (SAR). This information is very important to assess the agricultural activities, especially on occupied territories, and potentially reduce global food market volatility.
In this work, a multi-sensor approach to extract misclassified oil palm plantations from forest cover map using a modified Pauli Decomposition technique is presented. The proposed method includes the generation of a primary forest cover map built using a Landsat-based Normalized Difference Fraction Index, and then the palm oil plantation is filtered out using scattering mechanisms through the Modified Pauli Decomposition technique based on the fusion of Sentinel 1 and Alos Palsar data. Accuracy assessment of the final product, produces accuracy values of 0.946 for forest class, while the classification accuracy for non-forest class is 0.92.
Ecologists use a wide variety of metrics and software tools to quantify and map spatial patterns in ecological data. For analysis of categorical raster data, we introduce the GuidosToolbox Workbench (GWB), a series of Linux-based command-line modules, implementing popular algorithms from the interactive GuidosToolbox desktop application. We provide an overview of the workbench design, features of the individual modules, and an example implementation on the FAO SEPAL cloud computing environment.
In this work, a multi-sensor approach to separate oil palm plantations from forest cover using NDFI and a modified Pauli Decomposition technique is presented. The main contribution of this research is the potential to reduce misclas-sification of both classes, in the context of automated-base supervised classification algorithms, to decrease uncertainties derived through the detection and mapping process of forest cover. The hereby proposed method includes the generation of a primary forest map cover defining thresholds from a high resolution multi-spectral satellite image, and then the palm oil plantation will be filtered out from this classification using scattering mechanisms by a Pauli Decomposition approach. Preliminary results shown the capabilities of this approach in order to generate complementary information to separate the oil palm plantations from the forest cover classification.
The GFOI MGD provides practical advice related to the development of a National Forest Monitoring System to help meet national and international reporting requirements by: providing user-friendly guidance for linking UNFCCC decisions with IPCC guidance; focusing on how remotely sensed and ground-based data can be effectively combined to improve estimation of predominately forest related GHG emissions and removals, including those related to GHG inventories, REDD+ activities, and Nationally Determined Contributions (NDCs); addressing a gap that would otherwise exist in practical guidance on developing and implementing REDD+ MRV, while maintaining broader relevance to multipurpose monitoring of changes between forest land and non-forest land, particularly the methodologies that are outlined relating to land representation; presenting detailed advice to support decision making and technical implementation, and providing broad principles for the collection and use of data, which will remain relevant even as technologies and methods evolve; illustrating how countries can apply the principles outlined in the document by using existing examples of national experience; highlighting where relevant the broader applicability of the methods described in the development of a multipurpose monitoring system.
In this paper, results related with the assessment of the capabilityto detect forest degradation by analyzing NDFI time series through the BFAST algorithm are presented. Recent studies have shown the potential of the BFAST algorithm applied to a time-series of satellite-derived spectral indices such as NDVI or EVI to detect unambiguous and subtle perturbations of the forest cover canopy both positive (e.g. regeneration) and negative (e.g. deforestation). Similarly, these results suggest the feasibility to distinguish between several types of forest degradation and their causal agents such as selective logging and forest fire. In this context, the results derived from this research show that using NDFI as a data source in the BFAST algorithm improves the detection of forest degradation, and additionally provides information to understand both temporal and spatial approaches related with the dynamics of perturbations of the forest canopy
Information on Earth's land surface and change over time has never been easier to obtain, but making informed decisions to manage land well necessitates that this information is accurate and precise. In recent years, due largely to the inevitability of classification errors in remote sensing-based maps and the marked effects of these errors on subsequent area estimates, sample-based area estimates of land cover and land change have increased in importance and use. Area estimation of land cover and change by sampling is often made more efficient by a priori knowledge of the study area to be analyzed (e.g., stratification). Satellite data, obtained free of cost for virtually all of Earth's land surface, provide an excellent source for constructing landscape stratifications in the form of maps. Errors of omission, defined as sample units observed as land change but mapped as a stable class, may introduce considerable uncertainty in parameter estimates obtained from the sample data (e.g., area estimates of land change). The effects of omission errors are exacerbated in situations where the area of intact forest is large relative to the area of forest change, a common situation in countries that seek results-based payments for reductions in deforestation and associated carbon emissions. The presence of omission errors in such situations can preclude the acquisition of statistically valid evidence of a reduction in deforestation, and thus prevent payments. International donors and countries concerned with mitigating the effects of climate change are looking for guidance on how to reduce the effects of omission errors on area estimates of land change. This article presents the underlying reasons for the effects of omission errors on area estimates, case studies highlighting real-world examples of these effects, and proposes potential solutions. Practicable approaches to efficiently splitting large stable strata are presented that may reduce the effects of omission errors and immediately improve the quality of estimates. However, more research is needed before further recommendations can be provided on how to contain, mitigate and potentially eliminate the effects of omissions errors.
Reducing emissions from deforestation and forest degradation, and enhancing carbon stocks (REDD+) is a crucial component of global climate change mitigation. Remote sensing can provide continuous and spatially explicit above-ground biomass (AGB) estimates, which can be valuable for the quantification of carbon stocks and emission factors (EFs). Unfortunately, there is little information on the fate of the land following tropical deforestation and of the associated carbon stock. This study quantified post-deforestation land use across the tropics for the period 1990–2000. This dataset was then combined with a pan-tropical AGB map at 30 m resolution to refine EFs from forest conversion by matching deforestation areas with their carbon stock before and after clearing and to assess spatial dynamics of EFs by follow-up land use. In Latin America, pasture was the most common follow-up land use (72%), with large-scale cropland (11%) a distant second. In Africa deforestation was often followed by small-scale cropping (61%) with a smaller role for pasture (15%). In Asia, small-scale cropland was the dominant agricultural follow-up land use (35%), closely followed by tree crops (28%). Deforestation often occurred in forests with lower than average carbon stocks. EFs showed high spatial variation within eco-zones and countries. While our EFs are only representative for the studied time period, our results show that EFs are mainly determined by the initial forest carbon stock. The estimates of the fraction of carbon lost were less dependent on initial forest biomass, which offers opportunities for REDD+ countries to use these fractions in combination with recent good quality national forest biomass maps or inventory data to quantify emissions from specific forest conversions. Our study highlights that the co-location of data on forest loss, biomass and fate of the land provides more insight into the spatial dynamics of land-use change and can help in attributing carbon emissions to human activities.
Land cover maps play an integral role in environmental management. However, countries and institutes encounter many challenges with producing timely, efficient, and temporally harmonized updates to their land cover maps. To address these issues we present a modular Regional Land Cover Monitoring System (RLCMS) architecture that is easily customized to create land cover products using primitive map layers. Primitive map layers are a suite of biophysical and end member maps, with land cover primitives representing the raw information needed to make decisions in a dichotomous key for land cover classification. We present best practices to create and assemble primitives from optical satellite using computing technologies, decision tree logic and Monte Carlo simulations to integrate their uncertainties. The concept is presented in the context of a regional land cover map based on a shared regional typology with 18 land cover classes agreed on by stakeholders from Cambodia, Laos PDR, Myanmar, Thailand, and Vietnam. We created annual map and uncertainty layers for the period 2000–2017. We found an overall accuracy of 94% when taking uncertainties into account. RLCMS produces consistent time series products using free long term historical Landsat and MODIS data. The customizable architecture can include a variety of sensors and machine learning algorithms to create primitives and the best suited smoothing can be applied on a primitive level. The system is transferable to all regions around the globe because of its use of publicly available global data (Landsat and MODIS) and easily adaptable architecture that allows for the incorporation of a customizable assembly logic to map different land cover typologies based on the user's landscape monitoring objectives
Land cover monitoring efforts are important for resource planning and ecosystem services in many countries. Collect Earth Online (CEO) is a new, free open source and user-friendly software tool for land monitoring. It is the product of a collaborative effort between NASA, Food and Agriculture Organization of the United Nations (FAO), US Forest Service and Google. This paper provides a full overview of CEO's structure and functionality. Based on the cloud, CEO's structure supports simultaneous data entry by multiple users. No desktop installation is required and only an internet connection is required setting minimal requirements for using the software. Google Earth Engine widgets can be created for assisted plot interpretation such as image collection, time series graphs featuring indices such as Normalized Difference Vegetation Index (NDVI) and related statistics. We also provide a case study and related findings from a CEO workshop held in Myanmar.
Recent years have witnessed the practical value of open-access Earth observation data catalogues and software in land and forest mapping. Combined with cloud-based computing resources, and data collection through the crowd, these solutions have substantially improved possibilities for monitoring changes in land resources, especially in areas with difficult accessibility and data scarcity. In this study, we developed and tested a participatory mapping methodology utilizing the open data catalogues and cloud computing capacity to map the previously unknown extent and species composition of forest plantations in the Southern Highlands area of Tanzania, a region experiencing a rapid growth of smallholder-owned woodlots. A large set of reference data, focusing on forest plantation coverage, species and age information distribution, was collected in a two-week participatory GIS campaign where 22 Tanzanian experts interpreted very high-resolution satellite images in Google Earth with the Open Foris Collect Earth tool developed by the Food and Agriculture Organization of the United Nations. The collected samples were used as training data to classify a multi-sensor image stack of Landsat 8 (2013-2015), Sentinel-2 (2015-2016), Sentinel-1 (2015), and SRTM derived elevation and slope data layers into a 30 m resolution forest plantation map in Google Earth Engine. The results show that the forest plantation area was estimated with high overall accuracy (85%). The interpretation accuracy of local experts was high considering general definition of forest plantation declining with increased details in interpretation attributes. The results showcase the unique value of local expert participation, enabling the collection of thousands of reference samples over a large geographical area in a short period of time simultaneously building the capacity of the experts. However, sufficient training prior to the data collection is crucial for the interpretation success especially when detailed interpretation is conducted in complex landscapes. Since the methodology is built on open-access data and software, it presents a highly feasible solution for repetitive land resource mapping applicable at different spatial scales globally.
 Karis Tenneson合作论文数Spatial Informat Grp Nat Assets Lab, Pleasanton, CA 94566 USA7
 Saah David合作论文数Spatial Informat Grp LLC7
 Frederic Achard合作论文数7
 Martin Herold合作论文数Institute of Environmental Science and Geography, University of Potsdam;GFZ German Research Centre for Geosciences6
 Matthew C. Hansen合作论文数The Global Land Analysis and Discovery Laboratory, Department of Geographical Sciences, College of Behavioral and Social Sciences, University of Maryland5
 Poortinga Ate合作论文数Soil Physics and Land Management, Wageningen University4
 Uddin Kabir合作论文数International Centre for Integrated Mountain Development4
 Louis V. Verchot合作论文数International Center for Tropical Agriculture4
 Githika Tondapu合作论文数Marshall Space Flight Center3Rémi D'Annunzio合作论文数3
 Erith Alexander Munoz合作论文数The Food and Agriculture Organization of United Nations3Kel N. Markert合作论文数SERVIR Sci Coordinat Off, NASA Marshall Space Flight Ctr3
 Veronique De Sy合作论文数3
 Rene Beuchle合作论文数3
 Chris Justice合作论文数Department of Geographical Sciences, College of Behavioral & Social Sciences, University of Maryland College Park3
 Hans-Jurgen Stibig合作论文数3
 Farrukh Ahmed Chishtie合作论文数Department of Applied Mathematics3
 David P. Roy合作论文数Department of Geography, Environment, & Spatial Sciences, College of Social Science, Michigan State University3
 Alfonso Zozaya合作论文数3
 Walter L Ellenburg合作论文数Earth System Science Center, The University of Alabama in Huntsville2
 Pierrick Rambaud合作论文数UN FAO, Rome, Italy2
 Raja Ram Aryal合作论文数Forest Res & Training Ctr2
 Africa Flores合作论文数Earth System Science Center, University of Alabama in Huntsville2
 Quyen Nguyen合作论文数Corresponding author.2Matthew Patterson合作论文数2
 Mir A. Matin合作论文数Int Ctr Integrated Mt Dev2Yelena Finegold合作论文数Food & Agr Org, United Nat2
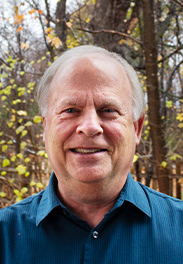 Stephen Stehman合作论文数Department of Sustainable Resources Management, College of Environmental Science and Forestry, State University of New York2
 Nicholas Etienne Clinton合作论文数Google2
 Alice Altstatt合作论文数2A. M. Gerrand合作论文数2
 Joshua H. Goldstein合作论文数Dept Human Dimens Nat Resources, Colorado State Univ2Anssi Pekkarinen合作论文数2
 Inge Jonckheere合作论文数Biosystems Department, Katholieke Universiteit Leuven2
 Arief Wijaya合作论文数Sensing Group, Remote;Institute for Geology;Remote Sensing Group|Institute for Geology2Khun San Aung合作论文数2Bernard Adusei合作论文数2
 Hugh Eva合作论文数2Gregory A. Reams合作论文数2
 Jan G. P. W. Clevers合作论文数Laboratory of Geo-information Science and Remote Sensing, Department of Environmental Sciences, Wageningen University2
 Feng Gao合作论文数1Robert Ochieng合作论文数1gary eilerts合作论文数1Sajana Maharjan合作论文数1Peter Cutter合作论文数1Paul Maus合作论文数1shiroma sathyapala合作论文数1Myat Su Mon合作论文数1




