Author(s): Brian Czech, Eugene Allen, David Batker, Paul Beier, Herman Daly, Jon Erickson, Pamela Garrettson, Valerius Geist, John Gowdy, Lynn Greenwalt, Helen Hands, Paul Krausman, Patrick Magee, Craig Miller, Kelly Novak, Genevieve Pullis, Chris Robinson, Jack Santa-Barbara, James Teer, David Trauger and Chuck Willer Reviewed work(s): Source: Wildlife Society Bulletin, Vol. 31, No. 2 (Summer, 2003), pp. 574-577 Published by: Allen Press Stable URL: http://www.jstor.org/stable/3784341 . Accessed: 09/08/2012 12:03
Color Research & ApplicationVolume 18, Issue 3 p. 223-224 Book Review Understanding Computer Color Matching, by N. S. Gangakhedkar, Rutu Prakashan, Bombay, softbound, 176 pp, $30.00 Eugene Allen, Eugene AllenSearch for more papers by this author Eugene Allen, Eugene AllenSearch for more papers by this author First published: June 1993 https://doi.org/10.1002/col.5080180314AboutPDF ToolsRequest permissionExport citationAdd to favoritesTrack citation ShareShare Give accessShare full text accessShare full-text accessPlease review our Terms and Conditions of Use and check box below to share full-text version of article.I have read and accept the Wiley Online Library Terms and Conditions of UseShareable LinkUse the link below to share a full-text version of this article with your friends and colleagues. Learn more.Copy URL Share a linkShare onFacebookTwitterLinked InRedditWechat No abstract is available for this article. Volume18, Issue3June 1993Pages 223-224 RelatedInformation
AbstractThe Saunderson correction used in turbid‐medium calculations applies only to opaque films. If the film is translucent and free standing, we must use a more comprehensive equation that takes both transmission and reflection into account. The Saunderson correction is valid, however, if the translucent film is laid over an opaque substrate and viewed by reflection only.
AbstractCurrent acceptance of goods for color by the United States Army depends on visual comparison against a standard and as many as eight limit samples. The Army wished to have a numerical method of setting color tolerances to be used with instrumental measurement. Preliminary work with the standards and limit samples indicated that acceptability ellipsoids oriented in the hue, chroma, and lightness directions in CIELAB color space should be set up. To establish the tolerances, we selected pairs of samples from a large number of previous submissions by industry. These pairs represented four graduated lightness steps, four graduated chroma steps, and four graduated hue steps. Six observers looked at each pair ten times, randomly interspersed with other pairs, and issued a pass‐or‐fail judgment each time. From these data we established lightness, chroma, and hue tolerance limits. For an olive green and a tan shade, these tolerances were roughly in the ratio 3:2:1; for a dark blue, the ratios were roughly 2:2:1. We wrote simple equations that can be used in order to determine quickly whether a sample passes or fails.
For colorant-formulation work using sophisticated radiative-transfer methods, we would like to characterize the colorant with as few parameters as possible. A new two-parameter phase function was found to give calculated results close to those of Mie theory for several typical cases. Together with an absorption and a scattering coefficient, we would therefore need only four parameters for accurate results.
The calculation of a tristimulus match in an opaque film using two-constant theory and four colorants can proceed in two stages: first, the computation of a rough match, and second, iteration to an exact match. The same formal matrix is used for the rough solution and for the iterative calculations, but it must be recomputed and reinverted once before the iterative stage of the program.
If we are given the spectrophotometric curves of a color and three colorants to be used in matching it, the computation of the concentrations of the three colorants required for a tristimulus match is a complicated nonlinear problem. However, with the help of an approximating assumption, a linear solution may be obtained by a matrix inversion technique. Although this is an approximate solution, it is better the less meta-meric the match. With this rough solution as a starting point, iteration may be used to approach an exact match to any desired degree of accuracy. The inverted matrix used for the iterative computation is identical to that used for the rough solution.
Because of the variability in the output of the xenon lamp in the Atlas xenon Weather-Ometer, daily monitoring of the ultraviolet energy output is advisable. The monitoring device recommended here is a barrier-layer cell behind an interference filter with a transmission peak near 328 mμ. The device is calibrated in terms of irradiance units at 328 mμ per mV reading. The primary standard is a tungsten ribbon filament lamp issued by the National Bureau of Standards under the designation "Standard of Spectral Radiance for the Region of 0.25 to 2.6 Microns".
An equation is derived from which the fluorescence obtained from a fluorescent whitener on a given substrate can be calculated from several reflectivity measurements. By use of this equation, one can explain theoretically and quantitatively such effects as the shape of the fluorescence vs concentration curve, the effect of the color of the substrate on fluorescence, the effect of the thickness or opacity of the substrate on fluorescence, and the effect of concentration of whitener on the shape of the emission curve.
To use MacAdam charts for chromaticity difference with measurements on a tristimulus colorimeter, one must convert the reflectance readings of sample and standard to CIE chromaticity coordinate differences by a series of calculations involving several steps. Alignment charts are described by which the chromaticity differences can be read directly from the reflectance ratios. The application of this method to the colorimetry of near-white samples is described, and a chromaticity-difference chart is presented from which one can read both the nature of the difference in Munsell terminology and the magnitude in MacAdam units.
Get PDF Email Share Share with Facebook Tweet This Post on reddit Share with LinkedIn Add to CiteULike Add to Mendeley Add to BibSonomy Get Citation Copy Citation Text Eugene Allen, "Convenient Color Indices for Near-White Samples," J. Opt. Soc. Am. 49, 1227-1228 (1959) Export Citation BibTex Endnote (RIS) HTML Plain Text Citation alert Save article
A new method for hand-integration of curves obtained on a General Electric-type recording spectrophotometer has been developed for use where accurate results are desired. A retardation plate is used for constructing a wavelength grid by setting the pen at a maximum or a minimum of the transmission curve of the plate and then allowing the pen to travel up and down the paper. This makes available approximately 55 ordinates for the integration. The curve, plotted on semitransparent paper, is aligned over the grid, and the reflectance or transmittance for each of the grid lines is read off. Each value is then multiplied by an appropriate factor, and the products are summed to give the tristimulus value. This method avoids the tedium and loss of precision of the usual method which makes use of a correction curve derived from the didymium peaks. Errors of paper positioning and irregularity in the wavelength cam will not affect the results by the proposed method.
ADVERTISEMENT RETURN TO ISSUEPREVArticleNEXTMethod of Assay for Ethylenimine DerivativesEugene Allen and William SeamanCite this: Anal. Chem. 1955, 27, 4, 540–543Publication Date (Print):April 1, 1955Publication History Published online1 May 2002Published inissue 1 April 1955https://pubs.acs.org/doi/10.1021/ac60100a014https://doi.org/10.1021/ac60100a014research-articleACS PublicationsRequest reuse permissionsArticle Views84Altmetric-Citations38LEARN ABOUT THESE METRICSArticle Views are the COUNTER-compliant sum of full text article downloads since November 2008 (both PDF and HTML) across all institutions and individuals. These metrics are regularly updated to reflect usage leading up to the last few days.Citations are the number of other articles citing this article, calculated by Crossref and updated daily. Find more information about Crossref citation counts.The Altmetric Attention Score is a quantitative measure of the attention that a research article has received online. Clicking on the donut icon will load a page at altmetric.com with additional details about the score and the social media presence for the given article. Find more information on the Altmetric Attention Score and how the score is calculated. Share Add toView InAdd Full Text with ReferenceAdd Description ExportRISCitationCitation and abstractCitation and referencesMore Options Share onFacebookTwitterWechatLinked InRedditEmail Other access optionsGet e-Alertsclose Get e-Alerts
ADVERTISEMENT RETURN TO ISSUEPREVArticleNEXTDetermining Only One Compound in MixtureEugene Allen and William Rieman, IIICite this: Anal. Chem. 1953, 25, 9, 1325–1331Publication Date (Print):September 1, 1953Publication History Published online1 May 2002Published inissue 1 September 1953https://pubs.acs.org/doi/10.1021/ac60081a007https://doi.org/10.1021/ac60081a007research-articleACS PublicationsRequest reuse permissionsArticle Views49Altmetric-Citations11LEARN ABOUT THESE METRICSArticle Views are the COUNTER-compliant sum of full text article downloads since November 2008 (both PDF and HTML) across all institutions and individuals. These metrics are regularly updated to reflect usage leading up to the last few days.Citations are the number of other articles citing this article, calculated by Crossref and updated daily. Find more information about Crossref citation counts.The Altmetric Attention Score is a quantitative measure of the attention that a research article has received online. Clicking on the donut icon will load a page at altmetric.com with additional details about the score and the social media presence for the given article. Find more information on the Altmetric Attention Score and how the score is calculated. Share Add toView InAdd Full Text with ReferenceAdd Description ExportRISCitationCitation and abstractCitation and referencesMore Options Share onFacebookTwitterWechatLinked InRedditEmail Other access optionsGet e-Alertsclose Get e-Alerts
ADVERTISEMENT RETURN TO ISSUEPREVArticleNEXTSpectrophotometric Determination of One Component in Two-Component MixtureEugene Allen and E. M. HammakerCite this: Anal. Chem. 1952, 24, 8, 1295–1298Publication Date (Print):August 1, 1952Publication History Published online1 May 2002Published inissue 1 August 1952https://pubs.acs.org/doi/10.1021/ac60068a008https://doi.org/10.1021/ac60068a008research-articleACS PublicationsRequest reuse permissionsArticle Views119Altmetric-Citations3LEARN ABOUT THESE METRICSArticle Views are the COUNTER-compliant sum of full text article downloads since November 2008 (both PDF and HTML) across all institutions and individuals. These metrics are regularly updated to reflect usage leading up to the last few days.Citations are the number of other articles citing this article, calculated by Crossref and updated daily. Find more information about Crossref citation counts.The Altmetric Attention Score is a quantitative measure of the attention that a research article has received online. Clicking on the donut icon will load a page at altmetric.com with additional details about the score and the social media presence for the given article. Find more information on the Altmetric Attention Score and how the score is calculated. Share Add toView InAdd Full Text with ReferenceAdd Description ExportRISCitationCitation and abstractCitation and referencesMore Options Share onFacebookTwitterWechatLinked InRedditEmail Other access optionsGet e-Alertsclose Get e-Alerts
ADVERTISEMENT RETURN TO ISSUEPREVArticleNEXTAcid-Base Titrations in Glacial Acetic Acid. Acid Potassium as Primary Standard and Behavior of Crystal Violet IndicatorWilliam Seaman and Eugene AllenCite this: Anal. Chem. 1951, 23, 4, 592–594Publication Date (Print):April 15, 1951Publication History Published online1 May 2002Published inissue 15 April 1951https://pubs.acs.org/doi/10.1021/ac60052a013https://doi.org/10.1021/ac60052a013research-articleACS PublicationsRequest reuse permissionsArticle Views956Altmetric-Citations37LEARN ABOUT THESE METRICSArticle Views are the COUNTER-compliant sum of full text article downloads since November 2008 (both PDF and HTML) across all institutions and individuals. These metrics are regularly updated to reflect usage leading up to the last few days.Citations are the number of other articles citing this article, calculated by Crossref and updated daily. Find more information about Crossref citation counts.The Altmetric Attention Score is a quantitative measure of the attention that a research article has received online. Clicking on the donut icon will load a page at altmetric.com with additional details about the score and the social media presence for the given article. Find more information on the Altmetric Attention Score and how the score is calculated. Share Add toView InAdd Full Text with ReferenceAdd Description ExportRISCitationCitation and abstractCitation and referencesMore Options Share onFacebookTwitterWechatLinked InRedditEmail Other access optionsGet e-Alertsclose Get e-Alerts
 E. M. Hammaker合作论文数3W Seaman合作论文数2Helen Hands合作论文数2WILLIAM RIEMAN合作论文数2Barry Yuhas合作论文数2Brian Czech合作论文数2David L. Trauger合作论文数2
 Chuck Willer合作论文数Coast Range Association1
 John M. Gowdy合作论文数Department of Economics, Rensselaer Polytechnic Institute/Department of Science and Technology Studies, Rensselaer Polytechnic Institute1
 Herman Daly合作论文数School of Public Policy, University of Maryland1
 Pamela Renee Garrettson合作论文数1
 Craig A. Miller合作论文数Hyde Park Animal Clinic;Texas Veterinary Medical Diagnostic Laboratory;Audubon Zoo-Audubon Nature Institute;Texas Veterinary Medical Diagnostic Laboratory, Audubon Zoo-Audubon Nature Institute1
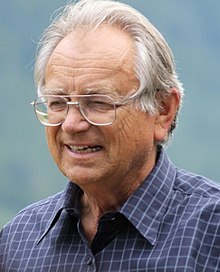 Valerius Geist合作论文数Faculty of Environmental Design, The University of Calgary1Christopher C. Robinson合作论文数1Paul R. Krausman合作论文数1
 Jon D. Erickson合作论文数School of Natural Resources;University of Vermont;School of Natural Resources, University of Vermont1Pat Magee合作论文数1




