BACKGROUND:Emerging evidence points to the beneficial role of greenspace exposure in promoting cardiovascular health. Most studies have evaluated such associations with conventional cardiovascular endpoints such as mortality, morbidity, or macrovascular markers. In comparison, the microvasculature, a crucial compartment of the vascular system where early subclinical signs of cardiovascular problems appear, has not been studied in association with greenspace exposure. The current study assessed the association between surrounding greenness and microvascular status, as assessed by retinal vessel diameters. METHODS:This study included a sample of healthy adults (n = 114 and 18-65 years old) residing in three European cities [Antwerp (Belgium), Barcelona (Spain), and London (UK)]. The exposures to greenspace at the home and work/school locations were characterized as average surrounding greenness [normalized difference vegetation index (NDVI)] within buffers of 100 m, 300 m, and 500 m. The central retinal arteriolar equivalent (CRAE) and central retinal venular equivalent (CRVE) were calculated from fundus pictures taken at three different time points. We developed linear mixed-effect models to estimate the association of greenspace exposure with indicators of retinal microvasculature, adjusted for relevant individual and area-level covariates. RESULTS:We observed the most robust associations with CRVE. Higher levels of greenspace at work/school were associated with smaller retinal venules [(seasonal NDVI) 300m: 3.85, 95%CI -6.67,-1.03; 500m: 5.11, 95%CI -8.04, -2.18]. Findings for surrounding greenness and CRAE were not conclusive. CONCLUSION:Our study suggests an association of greenspace exposure with better microvascular status, specifically for retinal venules. Future research is needed to confirm our findings across different contextual settings.
Previous research has shown that walking and cycling could help alleviate stress in cities, however there is poor knowledge on how specific microenvironmental conditions encountered during daily journeys may lead to varying degrees of stress experienced at that moment. We use objectively measured data and a robust causal inference framework to address this gap. Using a Bayesian Doubly Robust (BDR) approach, we find that black carbon exposure statistically significantly increases stress, as measured by Galvanic Skin Response (GSR), while cycling and while walking. Augmented Outcome Regression (AOR) models indicate that greenspace exposure and the presence of walking or cycling infrastructure could reduce stress. None of these effects are statistically significant for people in motorized transport. These findings add to a growing evidence-base on health benefits of policies aimed at decreasing air pollution, improving active travel infrastructure and increasing greenspace in cities.
BACKGROUND AND AIM Recent studies have shown that active travel is generally associated with lower levels of both perceived and measured stress. Specific microenvironmental conditions encountered during daily journeys, however, may lead to varying degrees of stress experienced at that moment. Our aim is to evaluate how travel mode-specific stress, as measured by Galvanic Skin Response (GSR), varies given different levels of Black Carbon (BC) and greenspace exposure, and by road type. METHODS BC and GSR were collected alongside confounders and travel information from 122 participants across 3 European cities for 3 weeks as part of the Physical Activity through Sustainable Transport Approaches (PASTA) study. Greenspace and road type were identified from the geo-locations recorded by a GPS device also worn by participants. A Bayesian Doubly Robust (BDR) estimation method via bootstrapping (which allows us to incorporate randomness originating from the random nature of the unobserved observations of GSR and to simulate the posterior distribution of GSR given the measured covariates) was employed to estimate the effect of BC, green space and road type on cycling-/walking-/motoring-specific GSR, while accounting for confounders such as physical activity, gender, and age. RESULTS BC significantly increases GSR when people are cycling or walking, but has no statistically significant effect on people in motorized transport. In reverse, greenspace and traveling on roads with active travel infrastructures (i.e. cycleways and/or pedestrian paths) both lead to lower GSR while walking and cycling, with again no effect on people in motorised transport. CONCLUSIONS Decreasing air pollution, improving active travel infrastructure and increasing greenspace along travel routes can reduce stress experienced during active travel. Reducing traffic and improving active travel microenvironments may thus further enhance benefits of walking and cycling in reducing stress in urban populations. KEYWORDS Built environment, urban planning, stress, air pollution, active travel, causal inference.
Many aspects of our life are related to our mobility patterns and individuals can exhibit strong tendencies towards routine in their daily lives. Intrapersonal day-to-day variability in mobility patterns has been associated with mental health outcomes. The study aims were: (a) calculate intrapersonal day-to-day variability in mobility metrics for three cities; (b) explore interpersonal variability in mobility metrics by sex, season and city, and (c) describe intrapersonal variability in mobility and their association with perceived stress.Data came from the Physical Activity through Sustainable Transport Approaches (PASTA) project, 122 eligible adults wore location measurement devices over 7-consecutive days, on three occasions during 2015 (Antwerp: 41, Barcelona: 41, London: 40). Participants completed the Short Form Perceived Stress Scale (PSS-4). Day-to-day variability in mobility was explored via six mobility metrics using distance of GPS point from home (meters:m), distance travelled between consecutive GPS points (m) and energy expenditure (metabolic equivalents:METs) of each GPS point collected (n = 3,372,919). A Kruskal-Wallis H test determined whether the median daily mobility metrics differed by city, sex and season. Variance in correlation quantified day-to-day intrapersonal variability in mobility. Levene's tests or Kruskal-Wallis tests were applied to assess intrapersonal variability in mobility and perceived stress.There were differences in daily distance travelled, maximum distance from home and METS between individuals by sex, season and, for proportion of time at home also, by city. Intrapersonal variability across all mobility metrics were highly correlated; individuals had daily routines and largely stuck to them. We did not observe any association between stress and mobility.Individuals are habitual in their daily mobility patterns. This is useful for estimating environmental exposures and in fuelling simulation studies.
Air pollution is a global threat to public health, especially when considering susceptible populations, such as children. A better understanding of determinants of exposure could help epidemiologists in refining exposure assessment methods, and policy makers in identifying effective mitigation interventions. Through a participatory approach, 73 and 89 schoolchildren were involved in a two-season personal exposure monitoring campaign of equivalent black carbon (EBC) in Milan, Italy. GPS devices, time-activity diaries and a questionnaire were used to collect personal information. Exposure to EBC was 1.3 ± 1.5 μg/m3 and 3.9 ± 3.3 μg/m3 (mean ± sd) during the warm and the cold season, respectively. The highest peaks of exposure were detected during the home-to-school commute. Children received most of their daily dose at school and home (82%), but the highest dose/time intensity was related to transportation and outdoor environments. Linear mixed-effect models showed that meteorological variables were the most influencing predictors of personal exposure and inhaled dose, especially in the cold season. The total time spent in a car, duration of the home-to-school commute, and smoking habits of parents were important predictors as well. Our findings suggest that seasonality, time-activity and mobility patterns play an important role in explaining exposure patterns. Furthermore, by highlighting the contribution of traffic rush hours, transport-related microenvironments and traffic-related predictors, our study suggests that acting on a local scale could be an effective way of lowering personal exposure to EBC and inhaled dose of children in the city of Milan.
Background: Differences in physical effort between cycling for transportation on an electricassisted cycle (EAC) and a conventional cycle (CC) were previously studied. The effect of cycle type on respiratory ventilation and inhaled air pollution dose remains unclear. Objective: The first aim was to predict respiratory ventilation while cycling on a conventional and electric-assisted cycle taking into account personal and route characteristics. The second aim was to predict the dose of inhaled pollutants while cycling on a conventional and electric-assisted cycle using the same independent variables. Methods: Nineteen participants performed a maximal exercise test (lab test) and four cycling trips (field test): flat with CC and EAC, and hilly with CC and EAC. During each trip, heart rate, respiratory ventilation, oxygen uptake, and carbon dioxide production were measured continuously with a portable metabolic system. Cycling time, speed and distance as well as GPS coordinates were also recorded continuously. The ATMO-Street air pollution model was used to estimate black carbon (BC), nitrogen dioxide (NO2), particulate matter (PM2.5 and PM10) inhaled doses post hoc. Factors impacting respiratory ventilation and the dose of inhaled pollutants were estimated through linear mixed modelling including laboratory and field measurements. Results: Mean respiratory ventilation was predicted based on sex (-7.78 L/min for women), cycle type (-17.61 L/min for EAC), height gain (+0.07 L/min) and speed (+1.30 L/min). Inhaled dose of pollutants both for BC dose/km and BC dose/min was primarily predicted by cycle type (-31.62% and -34.68% for EAC compared to CC, respectively). Results were similar for the other pollutants. Conclusions: Cycle type, sex, speed and route topography contribute to the respiratory ventilation and the use of an EAC reduces the dose of inhaled pollutants by 33% compared to the CC. Future projects could develop an app that predicts the cleanest route in real-time based on physical effort and ambient air pollution to increase the health benefits of cycling.
Air pollution is difficult to detect with human senses. It is to a large extent out of sight and out of sense, while causing a burden on our economy, our health and our environment. A relevant illustration of this is the exposure to air pollution during commutes. The air pollution commuters are exposed to remains to a considerable extent a hidden geography, with, for example, a lack of available reliable information regarding the on-the-road concentrations of several air pollutants. This research aims to unravel, to the best possible extent, spatio-temporal air pollution patterns (active) commuters are exposed to. Cyclists and pedestrians can be unaware that they commute in polluted air. They often travel close to motorised traffic, resulting in high exposure to several air pollutants, which have elevated levels on the road due to vehicular emissions. Significantly higher concentrations of particulate matter (<2.5 µm), black carbon and nitrogen dioxide were found on roads with high-traffic intensities than on roads with less traffic, cycling highways or separated cycle lanes. The amplitude of the concentration differences between routes depends on both temporal factors, such as the season, the day of the week, or the time of day, and spatial factors, such as the traffic’s density, the footpath or cycle lane’s location, the architectural makeup (e.g. street canyons) and the meteorological conditions. Using high-resolution air pollution models, it is possible to distinguish between routes of higher and lower air pollution concentrations, allowing active road users to choose an alternative route to lower their air pollution exposure. However, on-the-road concentrations displayed by the Belgian ATMO-Street model are often considerably underestimated, especially for routes with high levels of motorised traffic. In general, for air pollution models to distinguish between routes, a minimum spatial-model resolution of 10 m2 including street configuration effects (e.g. street canyons) is desired. For temporal resolution, static seasonal-hourly raster model data, calculated from a previous year’s hourly data, are sufficient to make a scientifically sound distinction between alternative routes regarding exposure to air pollution. Those tools are a great help in uncovering the spatio-temporal pollution patterns (active) commuters are exposed to and also provide relevant insights to reduce the health and economic burden of air pollution, which is unseen to a large extent and of which most people are not aware. Additional research using microscale measurement setups to further unravel gradients in air pollutant concentrations and further reveal reliable estimates of on-the-road concentrations of those pollutants is recommended.
BACKGROUND:Stress is one of many ailments associated with urban living, with daily travel a potential major source. Active travel, nevertheless, has been associated with lower levels of stress compared to other modes. Earlier work has relied on self-reported measures of stress, and on study designs that limit our ability to establish causation.OBJECTIVES:To evaluate effects of daily travel in different modes on an objective proxy measure of stress, the galvanic skin response (GSR).METHODS:We collected data from 122 participants across 3 European cities as part of the Physical Activity through Sustainable Transport Approaches (PASTA) study, including: GSR measured every minute alongside confounders (physical activity, near-body temperature) during three separate weeks covering 3 seasons; sociodemographic and travel information through questionnaires. Causal relationships between travel in different modes (the "treatment") and stress were established by using a propensity score matching (PSM) approach to adjust for potential confounding and estimating linear mixed models (LMM) with individuals as random effects to account for repeated measurements. In three separate analyses, we compared GSR while cycling to not cycling, then walking to not walking then motorized (public or private) travel to any activity other than motorized travel.RESULTS:Depending on LMM formulations used, cycling reduces 1-minute GSR by 5.7% [95% CI: 2.0-16.9%] to 11.1% [95% CI: 5.0-24.4%] compared to any other activity. Repeating the analysis for other modes we find that: walking is also beneficial, reducing GSR by 3.9% [95% CI: 1.4-10.7%] to 5.7% [95% CI: 2.6-12.3%] compared to any other activity; motorized mode (private or public) in reverse increases GSR by up to 1.1% [95% CI: 0.5-2.9%].DISCUSSION:Active travel offers a welcome way to reduce stress in urban dwellers' daily lives. Stress can be added to the growing number of evidence-based reasons for promoting active travel in cities.
Active travel (walking or cycling for transport) is generally good for health, the environment and the economy. Yet the net effects of changes in active travel on changes in mobility-related CO 2 emissions are complex and under-researched. Here we collected longitudinal data on daily travel behavior, mode choice, as well as personal and geospatial characteristics in seven European cities and derived mobility-related lifecycle CO 2 emissions from daily travel activity over time and space. Fixed- and mixed-effects modelling of longitudinal panel data (n=1849) was performed to assess the associations between changes in lifecycle CO 2 emissions and changes in transport mode use (primary exposure), main mode of travel, and cycling frequency (secondary exposures). Daily mobility-related lifecycle CO 2 emissions were 2.8 kgCO 2 per person at baseline, with car travel contributing 69% and cycling 1%. At follow-up, mobility-related lifecycle CO 2 emissions were -0.52 (95%CI -0.82 to -0.21) kgCO 2 /day lower per additional cycling trip, -0.41 (95%CI -0.69 to -0.12) kgCO 2 /day lower per additional walking trip, and -2.11 (95%CI -1.78 to -2.43) kgCO 2 /day lower per ‘avoided’ car trip. An average person cycling 1 trip/day more and driving 1 trip/day less for 200 days a year would decrease mobility-related lifecycle CO 2 emissions by about 0.5 tonnes over a year. Those who changed from ‘not cycling’ to ‘cycling’ decreased daily CO 2 emissions by -2.54 (95%CI -3.90 to -1.17) kgCO 2 /day. Mobility-related CO 2 emissions decreased by -9.28 (95%CI -11.46 to -7.11) kg/day for those who changed their ‘main mode’ from car, van or motorbike to active travel. Extensive sensitivity analyses by city, journey purpose and key personal characteristics largely confirmed our results. Active travel is shown to substitute for motorized travel, with significant climate change mitigation effects. Even if not all car trips could be substituted by active travel the potential for decreasing emissions is considerable and significant. Investing in and promoting active travel should therefore be a cornerstone of strategies to meet net zero carbon targets, particularly in urban areas, while also improving public health and quality of urban life.
Active travel (walking or cycling for transport) is considered the most sustainable form of personal transport. Yet its net effects on mobility-related CO2 emissions are complex and underresearched. Here we collected travel activity data in seven European cities and derived life cycle CO2 emissions across modes and purposes. Daily mobility-related life cycle CO2 emissions were 3.2 kgCO(2) per person, with car travel contributing 70% and cycling 1%. Cyclists had 84% lower life cycle CO2 emissions than non-cyclists. Life cycle CO2 emissions decreased by 14% per additional cycling trip and decreased by 62% for each avoided car trip. An average person who `shifted travel modes' from car to bike decreased life cycle CO2 emissions by 3.2 kgCO(2)/day. Promoting active travel should be a cornerstone of strategies to meet net zero carbon targets, particularly in urban areas, while also improving public health and quality of urban life.
Air pollution remains a key environmental problem in an increasingly urbanized world 1,2 .To quantify health impacts and support informed policies, the population exposure needs to be accurately monitored.However, the inherent spatial variability of air quality poses a tenacious challenge to this.While concentrations of traffic-related pollutants like nitrogen dioxide (NO 2 ) are known to vary over short distances 3,4 , official monitoring networks remain inherently sparse, as reference stations are costly to construct and operate 5,6 .Here we show that citizen science provides an cost-effective way to collect large, spatially distributed datasets that critically complement official monitoring.The CurieuzeNeuzen project engaged 20.000 citizens across a large European metropolitan region to measure NO 2 concentrations in front of their house using a low-cost sampler design.The resulting dataset reveals the granular structure of air quality with unprecedented detail, and demonstrates that citizen-derived NO 2 data possess suitable quality and spatial representativeness, so they can be used to directly quantify the exceedance of legal thresholds, to critically assess and improve the performance of air quality models, and reliably estimate static and dynamic population exposure.These results illustrate how large-scale citizenbased monitoring can directly contribute to better informed policy decisions about challenging environmental problems.
Background: the relationships between the built environment characteristics and personal factors influencing public transport use and the ways they interact are not well understood. Objective: we aim to advance the understanding of the relationship between built environment and frequency of public transport use in seven European cities, while accounting for other factors, such as individual values and attitudes. Methods: in this population-based cross-sectional study, we collected information on mobility behaviour including frequency of public transport use, individual characteristics, and attitudes towards transport, environment and health issues (N = 9952). Home and work/study built environment characteristics were determined with GIS-based techniques. We also applied factor and principal component analyses to define profiles of potential correlates. Logistic regression analyses for each frequency category of public transport use (1-3 days/month, 1-3 days/week, and daily or almost daily), using as reference "never or less than once a month", were applied. City was included as random effect. Results: Over all, a large percentage of participants reported daily or almost daily public transport use for travel (40.5%), with a wide range across cities (from 7.1% in Orebro to 59.8% in Zurich). Being female, highly educated, a student, or not working increased the odds of higher frequency of using public transport, while having access to a car and/or a bike reduced the odds. Living or working in high-density areas was associated with higher frequency of public transport use, while living or working in low-density areas was associated with lower frequency (1-3 days/month or 1-3 days/week). We observed interactions between built environment characteristics and having access to a car and/or a bike. For instance, greater distance between the residential and the work or study address increased the odds of higher frequency of public transport use, except among participants who owned a car but not a bike. Regarding individual values and attitudes towards public transport use, valuing lower travel cost and shorter travel time was associated with daily or almost daily public transport use, while valuing low exposure to air pollution, personal health benefits while travelling, as well as flexibility and predictability, were associated with more sporadic use. Conclusions: We demonstrate, using one of the largest population-based comprehensive multi-city surveys across European cities with varying social and physical contexts, that dense urban environments, reliable and affordable public transport services, and limiting motorized vehicles in high density areas of the cities will help achieve much needed promotion of public transport use.
Active travel (walking or cycling for transport) is considered the most sustainable form of getting from A to B. Yet the net effects of active travel on mobility-related CO2 emissions are complex and under-researched. Here we collected travel activity data in seven European cities and derived lifecycle CO2 emissions from daily travel activity. Daily mobility-related lifecycle CO2 emissions were 3.2 kgCO2 per person, with car travel contributing 70% and cycling 1%. Cyclists had 84% lower lifecycle CO2 emissions from all daily travel than non-cyclists. Lifecycle CO2 emissions decreased by -14% (95%CI -12% to -16%) per additional cycling trip and decreased by -62% (95%CI -61% to -63%) for each avoided car trip. An average person who ‘shifted travel modes’ from car to bike decreased lifecycle CO2 emissions by 3.2 (95%CI 2.0 to 5.2) kgCO2/day, and using a bike as the ‘main method of travel’ gave 7.1 (95%CI 4.8 to 10.4) kgCO2/day lower lifecycle CO2 emissions than mainly using a car or van. Investing in and promoting active travel should be a cornerstone of strategies to meet net zero carbon targets, particularly in urban areas, while also improving public health and quality of urban life.
Reliable estimates of outdoor air pollution concentrations are needed to support global actions to improve public health. We developed a new approach to estimating annual average outdoor nitrogen dioxide (NO2) concentrations using approximately 20,000 ground-level measurements in Flanders, Belgium combined with aerial images and deep neural networks. Our final model explained 79% of the spatial variability in NO2 (root mean square error of 10-fold cross-validation = 3.58 μg/m3) using only images as model inputs. This novel approach offers an alternative means of estimating large-scale spatial variations in ambient air quality and may be particularly useful for regions of the world without detailed emissions data or land use information typically used to estimate outdoor air pollution concentrations.
Background/Aim: In May 2018, one of the biggest citizen science projects on air pollution was conducted in the region of Flanders, Belgium: the CurieuzeNeuzen (ꞌCurious Nosesꞌ) project. In this project, 20,000 people measured NO2 concentrations at the façade of their residence. The aims of the project were twofold: (1) validation of the air pollution model ATMO-Street on a very high spatial scale, (2) raising awareness on air pollution and have a societal impact. Furthermore, the extensive measurement set can be used for exposure assessment. Methods: Residence-based NO2 can be considered a proxy for personal NO2 exposure. In a subsample of 5,000 participants, the residence-based NO2 was combined with the ATMO-Street model (air pollution model combining LUR modelling for background pollution, dispersion modelling for point and line sources, and street canyon effects) for out-of-home exposure to estimate a time-weighted dynamic exposure to NO2. Results: Residence-based exposure to NO2 was 22.8±6.5 µg/m³. The ATMO-Street model initially underestimated measured concentrations, but after improvements the validation R² increased from 0.52 to 0.58. Time-weighted dynamic exposure was 24.1±5.5 µg/m³. For 64% of the individuals the dynamic exposure was higher than the residence-based measurement. With increasing travel time or distance, the difference between the residence-based exposure and the dynamic exposure increased: travelling for 3 hours per day resulted in a dynamic exposure that was 5 µg/m³ higher than the residence-based measurement. Conclusions: CurieuzeNeuzen resulted in an unprecedented, unique dataset. Before the project, the ATMO-Street model had to be validated with a few dozens of external measurement sites, now 20,000 sites were available. Time-weighting measurements at home and estimates for out-of-home exposure enables a more accurate estimation of the exposure to NO2 and its effects on health, allowing to provide better information and recommendations to policy makers.
Increased cycling uptake can improve population health, but barriers include real and perceived risks. Crash risk factors are important to understand in order to improve safety and increase cycling uptake. Many studies of cycling crash risk are based on combining diverse sources of crash and exposure data, such as police databases (crashes) and travel surveys (exposure), based on shared geography and time. When conflating crash and exposure data from different sources, the risk factors that can be quantified are only those variables common to both datasets, which tend to be limited to geography (e.g. countries, provinces, municipalities) and a few general road user characteristics (e.g. gender and age strata). The Physical Activity through Sustainable Transport Approaches (PASTA) project was a prospective cohort study that collected both crash and exposure data from seven European cities (Antwerp, Barcelona, London, Örebro, Rome, Vienna and Zürich). The goal of this research was to use data from the PASTA project to quantify exposure-adjusted crash rates and model adjusted crash risk factors, including detailed sociodemographic characteristics, attitudes about transportation, neighbourhood built environment features and location by city. We used negative binomial regression to model the influence of risk factors independent of exposure. Of the 4,180 cyclists, 10.2 % reported 535 crashes. We found that overall crash rates were 6.7 times higher in London, the city with the highest crash rate, relative to Örebro, the city with the lowest rate. Differences in overall crash rates between cities are driven largely by crashes that did not require medical treatment and that involved motor-vehicles. In a parsimonious crash risk model, we found higher crash risks for less frequent cyclists, men, those who perceive cycling to not be well regarded in their neighbourhood, and those who live in areas of very high building density. Longitudinal collection of crash and exposure data can provide important insights into individual differences in crash risk. Substantial differences in crash risks between cities, neighbourhoods and population groups suggest there is great potential for improvement in cycling safety.
TPS 651: Air pollution exposure modeling 1, Exhibition Hall, Ground floor, August 27, 2019, 3:00 PM - 4:30 PM Background: Ubiquitous sensing technology provides novel opportunities for integrating activity patterns in exposure assessment. Theoretically promising to generate population-wide activity-based exposures, in reality strong limitations to widespread and large-scale use exist. Methods and results from three contrasting studies are presented. Methods: (1) Mobile phone activity data from 8 million users were obtained from Telecom Italia in 7 cities (aggregate data: presence of users every 15 minutes for 2 months, spatial grid varying from 0.1 to 30km). (2) During one week over a period of 1 year in Barcelona, Spain, 180 commuters were fitted with a smart phone equipped with a geo-tracking and physical activity assessment app. (3) During one week repeated in 3 different seasons, 122 participants from 3 European cities were monitored for BC exposure, geoposition and physical activity. In the first two studies, land use regression air pollution maps were overlaid with the activity data to assess exposures. Activity-weighted exposures were compared to traditional home-based assignments. Results: The scale of spatial aggregation mattered more than accounting for activity patterns in the first study. In the second study, correlations between home-based and activity-based exposures were moderate to high (0.76 Pearson for PM2.5, 0.84 for NO2); travel microenvironments contributed up to 45% of pollution intake, but only 9% of time. Lower contributions from travel (18% intake, 7% time) were found in the 3rd study. Discussion Phone usage data provided by telecom companies has the advantage of enabling representations of movements for broad populations, highlighting exposure hotspots. Aggregated data bypasses issues of privacy which may hinder widespread use of individual phone-based data collection. The level of detail obtained from individual smart phone apps highlights the importance of accounting for activities and intakes, confirmed by much more costly and burdensome air pollution monitoring studies. Methods to bridge approaches need to be investigated.
AIM:To assess the main and interaction effects of black carbon and physical activity on arterial blood pressure in a healthy adult population from three European cities using objective personal measurements over short-term (hours and days) and long-term exposure. METHODS:A panel study of 122 healthy adults was performed in three European cities (Antwerp, Barcelona, and London). In 3 seasons between March 2015 and March 2016, each participant wore sensors for one week to objectively measure their exposure to black carbon and monitor their physical activity continuously. Blood pressure was assessed three times during the week: at the beginning (day 0), in the middle (day 4), and at the end (day 7). Associations of black carbon and physical activity with blood pressure and their interactions were investigated with linear regression models and multiplicative interaction terms, adjusting for all the potential confounders. RESULTS:In multiple exposure models, we did not see any effects of black carbon on blood pressure but did see effects on systolic blood pressure of moderate-to-vigorous physical activity effect that were statistically significant from 1 h to 8 h after exposure and for long-term exposure. For a 1METhour increase of moderate-to-vigorous physical activity, the difference in the expected mean systolic blood pressure varied from -1.46 mmHg (95%CI -2.11, -0.80) for 1 h mean exposure, to -0.29 mmHg (95%CI -0.55, -0.03) for 8 h mean exposure, and -0.05 mmHg (95%CI -0.09, -0.00) for long-term exposure. There were little to no interaction effects. CONCLUSIONS:Results from this study provide evidence that short-term and long-term exposure to moderate-to-vigorous physical activity is associated with a decrease in systolic blood pressure levels. We did not find evidence for a consistent main effect of black carbon on blood pressure, nor any interaction between black carbon and physical activity levels.
Introduction: Measuring bicycling behaviour is critical to bicycling research. A common study design question is whether to measure bicycling behaviour once (cross-sectional) or multiple times (longitudinal). The Physical Activity through Sustainable Transport Approaches (PASTA) project is a longitudinal cohort study of over 10,000 participants from seven European cities over two years. We used PASTA data as a case study to investigate how measuring once or multiple times impacted three factors: a) sample size b) participation bias and c) accuracy of bicycling behaviour estimates. Methods: We compared two scenarios: i) as if only the baseline data were collected (cross-sectional approach) and ii) as if the baseline plus repeat follow-ups were collected (longitudinal approach). We compared each approach in terms of differences in sample size, distribution of sociodemographic characteristics, and bicycling behaviour. In the cross-sectional approach, we measured participants long-term bicycling behaviour by asking for recall of typical weekly habits, while in the longitudinal approach we measured by taking the average of bicycling reported for each 7-day period. Results: Relative to longitudinal, the cross-sectional approach provided a larger sample size and slightly better representation of certain sociodemographic groups, with worse estimates of long-term bicycling behaviour. The longitudinal approach suffered from participation bias, especially the drop-out of more frequent bicyclists. The cross-sectional approach under-estimated the proportion of the population that bicycled, as it captured 'typical' behaviour rather than 7-day recall. The magnitude and directionality of the difference between typical weekly (cross-sectional approach) and the average 7-day recall (longitudinal approach) varied depending on how much bicycling was initially reported. Conclusions: In our case study we found that measuring bicycling once, resulted in a larger sample with better representation of sociodemographic groups, but different estimates of long-term bicycling behaviour. Passive detection of bicycling through mobile apps could be a solution to the identified issues.
 Luc LR Int Panis合作论文数Transportation Research Institute, Hasselt University73
 Audrey J de Nazelle合作论文数Centre for Environmental Policy, Faculty of Natural Sciences, Imperial College London48
 Mark J Nieuwenhuijsen合作论文数Instituto de Salud Global de Barcelona43
 Ione Avila-Palencia合作论文数Urban Hlth Collaborat, Drexel Univ36
 Thomas Gotschi合作论文数School of Planning, Public Policy and Management, College of Design, University of Oregon;University of California, Berkeley;World Health Organization;Transportation and Health Consultancy30
 Esther Anaya Boig合作论文数Corresponding author.29
 Michelle Laeremans合作论文数29
 Arnout R.L. Standaert合作论文数29
 Juan Pablo Orjuela合作论文数School of Geography and the Environment, University of Oxford26
 Christian Brand合作论文数Transport Studies Unit, University of Oxford;Environmental Change Institute, University of Oxford22
 Regine Gerike合作论文数TU Dresden21
 Martine Van Poppel合作论文数20
 Rojas-Rueda David合作论文数Centre for Research in Environmental Epidemiology (CREAL), C/Dr. Aiguader 88, 08003 Barcelona, Spain;Universitat Pompeu Fabra (UPF),;CIBER Epidemiología y Salud Pública (CIBERESP), C/Monforte de Lemos 3-5, 28029 Madrid, Spain.;Centre for Research in Environmental Epidemiology (CREAL),, Universitat Pompeu Fabra (UPF),19
 Sonja Kahlmeier合作论文数Fachhochschule Nordwestschweiz;Fernfachhochschule Schweiz19
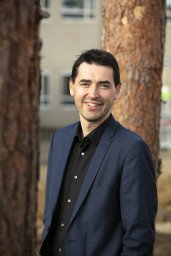 Patrick De Boever合作论文数Environm Risk & Hlth Unit, Flemish Inst Technol Res VITO18
 Tom Cole-Hunter合作论文数18
 Mailin Gaupp-Berghausen合作论文数17
 Elisabeth Raser合作论文数16
 Tim Nawrot合作论文数Centre for Environmental Sciences, Universiteit Hasselt;Leuven University15
 Carrasco-Turigas Glòria合作论文数Centre for Research in Environmental Epidemiology, Barcelona Biomedical Research Park13Gerhard (Geert) Wets合作论文数School of Transportation Sciences, Universiteit Hasselt;Instituut voor Mobiliteit, Universiteit Hasselt;School voor Mobiliteitswetenschappen, Universiteit Hasselt11Francesco Iacorossi合作论文数10
 Erik Stigell合作论文数9
 Sandra Wegener合作论文数7
 Natalie Mueller合作论文数Centre for Research in Environmental Epidemiology (CREAL), C/Dr. Aiguader 88, 08003 Barcelona, Spain;Universitat Pompeu Fabra (UPF),;CIBER Epidemiología y Salud Pública (CIBERESP), C/Monforte de Lemos 3-5, 28029 Madrid, Spain.;Centre for Research in Environmental Epidemiology (CREAL),, Universitat Pompeu Fabra (UPF),7
 Tijs Louwies合作论文数7
 Bianca Cox合作论文数7
 Eline B Provost合作论文数6
 Gudrun Koppen合作论文数Environmental Toxicology, Flemish Institute of Technological Research6Carolien Beckx合作论文数6Francesca Racioppi合作论文数6Albert Ambròs合作论文数5Anna Clark合作论文数5
 Julian Sanchez合作论文数5De Prins Sofie合作论文数Environmental Risk and Health Unit, VITO (Flemish Institute for Technological Research),;Faculty of Pharmaceutical, Biomedical and Veterinary Sciences, University of Antwerp5
 Theo Arentze合作论文数Department of the Built Environment, Eindhoven University of Technology5
 Mireia Gascon合作论文数Barcelona Institute for Global Health5
 B. (Bert) Brunekreef合作论文数Institute for Risk Assessment Sciences, Utrecht University;Department Population Health Sciences, Utrecht University;Faculty of Medicine, Utrecht University4Lefebvre Wouter合作论文数4
 Michael Jerrett合作论文数Center for Occupational and Environmental Health, University of California, Los Angeles;Fielding School of Public Health, University of California, Los Angeles4
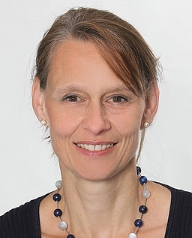 Barbara Hoffmann合作论文数University of Düsseldorf4
 Rob Beelen合作论文数Institute for Risk Assessment Sciences, Utrecht University4
 Marloes Eeftens合作论文数IRAS, Univ Utrecht4Meng Wang合作论文数3Xiuleng Yang合作论文数3Simona Sulikova合作论文数3N. Pieters合作论文数3Christophe Declercq合作论文数3
 Ming-Yi Tsai合作论文数Swiss Tropical and Public Health (TPH) Institute, University of Basel3




