Current observed as well as projected changes in biodiversity are the result of multiple interacting factors, with land use and climate change often marked as most important drivers. We aimed to disentangle the separate impacts of these two for sets of vascular plant, bird, butterfly and dragonfly species listed as characteristic for European dry grasslands and wetlands, two habitats of high and threatened biodiversity. We combined articulations of the four frequently used SRES climate scenarios and associated land use change projections for 2030, and assessed their impact on population trends in species (i.e. whether they would probably be declining, stable or increasing). We used the BIOSCORE database tool, which allows assessment of the effects of a range of environmental pressures including climate change as well as land use change. We updated the species lists included in this tool for our two habitat types. We projected species change for two spatial scales: the EU27 covering most of Europe, and the more restricted biogeographic region of 'Continental Europe'. Other environmental pressures modelled for the four scenarios than land use and climate change generally did not explain a significant part of the variance in species richness change. Changes in characteristic bird and dragonfly species were least pronounced. Land use change was the most important driver for vascular plants in both habitats and spatial scales, leading to a decline in 50-100% of the species included, whereas climate change was more important for wetland dragonflies and birds (40-50 %). Patterns of species decline were similar in continental Europe and the EU27 for wetlands but differed for dry grasslands, where a substantially lower proportion of butterflies and birds declined in continental Europe, and 50 % of bird species increased, probably linked to a projected increase in semi-natural vegetation. In line with the literature using climate envelope models, we found little divergence among the four scenarios. Our findings suggest targeted policies depending on habitat and species group. These are, for dry grasslands, to reduce land use change or its effects and to enhance connectivity, and for wetlands to mitigate climate change effects.
Annual sulfate mass balances have been constructed for four low-lying peat polders in the Netherlands, to resolve the origin of high sulfate concentrations in surface water, which is considered a water quality problem, as indicated amongst others by the absence of sensitive water plant species. Potential limitation of these plants to areas with low sulfate was analyzed with a spatial match-up of two large databases. The peat polders are generally used for dairy farming or nature conservation, and have considerable areas of shallow surface water (mean 16%, range 6-43%). As a consequence of continuous drainage, the peat in these polders mineralizes causing subsidence rates generally ranging between 2 and 10 mm y(-1). Together with pyrite oxidation, this peat mineralization the most important internal source of sulfate, providing an estimated 96 kg SO4 ha(-1) mm(-1) subsidence External sources are precipitation and water supplied during summer to compensate for water shortage, but these were found to be minor compared to internal release. The most important output flux is discharge of excess surface water during autumn and winter. If only external fluxes in and out of a polder are evaluated, inputs average 37 +/- 9 and exports 169 +/- 17 kg S ha(-1) y(-1). During summer, when evapotranspiration exceeds rainfall, sulfate accumulates in the unsaturated zone, to be flushed away and drained off during the wet autumn and winter. In some polders, upward seepage from early Holocene, brackish sediments can be a source of sulfate. Peat polders export sulfate to the regional water system and the sea during winter drainage. The available sulfate probably only plays a minor role in the oxidation of peat: we estimate that this is less than 10% whereas aerobic mineralization is the most important. Most surface waters in these polders have high sulfate concentrations, which generally decline during the growing season when aquatic sediments are a sink. In the sediment, this sulfur is reduced and binds iron more strongly than phosphorus, which can be released to the overlying water and potentially fuels eutrophication. About 76% of the sampled vegetation-sites exceeded a threshold of 50 mg l(-1), SO4, above which sensitive species, such as Stratiotes aloides, and several species of Potamogeton were significantly less abundant. Thus high sulfate concentrations, mainly due to land drainage and consequent mineralization, appear to affect aquatic plant community composition. (C) 2015 Elsevier B.V. All rights reserved.
Assessments of climate change impacts on species are needed for anticipating potential biodiversity losses. Climate change impacts on species are often simulated with climate envelope models, but most climate envelope models do not account for dispersal limitations. Most studies only consider two extreme (and unrealistic) dispersal options: no dispersal versus full dispersal. This study attempts to include dispersal limitation into the calculation of climate change sensitivity scores for a range of vertebrate and plant species. We calculate climate change sensitivity scores -expressed as an index- by using the 'spatial turnover' of a species under climate change, defined as the projected difference between current and future area occupied by a species within a region, and include a dispersal factor to account for dispersal limitations. We calculate climate sensitivity scores with three dispersal factors: d0 (no dispersal), d1 (full dispersal) and with an estimated value of d calculated directly from species specific dispersal data and literature estimates (de). We compared climate sensitivity scores across species groups and European bio-geographical regions in order to determine whether explicitly accounting for dispersal limitations causes significant differences in sensitivity for climate change. Our results show that the climate sensitivity scores calculated with de differ slightly from d0 (no dispersal), but differ significantly from d1 (full dispersal) for the less mobile species groups (amphibian, reptiles, plants). This indicates that assuming full dispersal significantly overestimates the future distribution in Europe under climate change for these species, whereas assuming no dispersal may slightly underestimates this. However, this conclusion could not be drawn for the more mobile birds and mammas: climate sensitivity scores calculated with de are approximately intermediate of those calculated with d0 (no dispersal) and d1 (full dispersal). This indicates that assuming either no or full dispersal results in poor estimates of the future distribution of these species in Europe under climate change, and that dispersal capacity should therefore always be considered when assessing climate change impacts on these species. Disaggregating climate sensitivity scores per European bio-geographical regions reveals that regional climate sensitivity scores are similar to the European level.
Global change in river basins can be anticipated by using downscaled scenarios. This approach is introduced in this chapter, and it is argued that scenarios are a well-developed and suitable tool to explore the uncertain bandwidth of the future states of river basins, their rivers and occupant societies. Quantitative and qualitative scenario exercises are introduced and a worked-out example is presented for the Scheldt river basin.
Downscaled articulations of Intergovernmental Panel on Climate Change (IPCC) Special Report on Emission Scenarios (SRES) have been outlined qualitatively for a hypothetical Southern, Central and Northern European river basin and a time horizon set at 2030. The purpose was to survey the sensitivity of ecosystem state indicators, to assess which drivers would be within the grasp of river basin management and to make a geographic comparison. Expert workshop debates were structured using a sequence of entries on drivers and the wider geographic setting, on the river basin and its hydrology, on pressures and on a range of ecosystem state indicators. The workshop elaborated IPCC-SRES scenarios A1 (global economy) and B2 (regional communities) only, since these are generally considered to be the two most divergent scenarios. Contrasts between these two scenarios in land, resource and energy use as well as in the orientation towards sustainability in governance were thought to lead to distinct contrasts in water and sediment delivery to stream networks, in contaminant loads and their remobilisation and in opportunities for riparian biota to populate available habitat. Also, these contrasts between A1 and B2 are probably most profound in the North and South. In contrast to other scenario assessments in the literature, the workshop found it highly plausible that agricultural land use would expand in the North, notably on deeper soils that had been afforested in previous decades. For the South, uncertainty on the direction of land use change was profound, leading to quite different, sketchy but plausible trajectories. Workshop participants remained cautious in the use of scenarios, because it was felt that adoption of altered lifestyles, transition to a carbon-neutral energy system or a nutrient-balanced, low-external-input agriculture can be charted as scenario elements, but their wholesale assimilation in real societies over the coming decades remains hard to predict. Notably discharge variability was foreseen to be highly responsive to the different scenarios but is considered to be under the influence of a river manager. Major drivers, such as the Common Agricultural Policy of the European Union and world market demand development for dairy or biofuel, will strongly affect land use and soil management. These appear to be largely outside the span of control of river basin authorities. The workshop hoped that risk preparedness in river management would include an identification of such major drivers outside their formal control and of the relevant institutions, both in different sectors and at different levels.
This paper describes a methodology to explore the (future) spatial distribution of biofuel crops in Europe. Two main types of biofuel crops are distinguished: biofuel crops used for the production of biodiesel or bioethanol, and second-generation biofuel crops. A multi-scale, multi-model approach is used in which biofuel crops are allocated over the period 2000-2030. The area of biofuel crops at the national level is determined by a macro-economic model. A spatially explicit land use model is used to allocate the biofuel crops within the countries. Four scenarios have been prepared based on storylines influencing the extent and spatial distribution of biofuel crop cultivation. The allocation algorithm consists of two steps. In the first step, processing plants are allocated based on location factors that are dependent on the type of biofuel crop processed and scenario conditions. In the second step, biofuel crops are allocated accounting for the transportation costs to the processing plants. Both types of biofuel crops are allocated separately based on different location factors. Despite differences between the scenarios, mostly the same areas are showing growth in biofuel crop cultivation in all scenarios. These areas stand out because they have a combination of well-developed infrastructural and industrial facilities and large areas of suitable arable land. The spatially explicit results allow an assessment of the potential consequences of large-scale biofuel crop cultivation for ecology and environment.
Using the systems approach framework (SAF), a coupled model suite was developed for simulating land-use decision making in response to nutrient abatement costs and water and nutrient fluxes in the hydrological network of the Scheldt River, and nutrient fluxes in the estuary and adjacent coastal sea. The purpose was to assess the efficiency of different long-term water quality improvement measures in current and future climate and societal settings, targeting nitrogen (N) load reduction. The spatial-dynamic model suite consists of two dynamically linked modules: PCRaster is used for the drainage network and is combined with ExtendSim modules for farming decision making and estuarine N dispersal. Model predictions of annual mean flow and total N concentrations compared well with data available for river and estuary (r(2) >= 0.83). Source apportionment was carried out to societal sectors and administrative regions; both households and agriculture are the major sources of N, with the regions of Flanders and Wallonia contributing most. Load reductions by different measures implemented in the model were comparable (similar to 75% remaining after 30 yr), but costs differed greatly. Increasing domestic sewage connectivity was more effective, at comparatively low cost (47% remaining). The two climate scenarios did not lead to major differences in load compared with the business-as-usual scenario (similar to 88% remaining). Thus, this spatially explicit model of water flow and N fluxes in the Scheldt catchment can be used to compare different long-term policy options for N load reduction to river, estuary, and receiving sea in terms of their effectiveness, cost, and optimal location of implementation.
A spatially explicit dynamic model was developed that combines water quantity and quality processes for an average Dutch peat polder. The model has been used to calculate the consequences of climate change for surface water level, groundwater level and nitrogen and phosphorus fluxes, based on time series (2036–2065) of the two most extreme climate change scenarios for the Netherlands (G and W+) developed by the Royal Dutch Meteorological Institute. It was calibrated using measured data from two existing polders. The results suggest that surface water levels will not change much in both scenarios. Hence, the current practice of letting extra water in during dry summer periods to maintain sufficient water levels will probably remain a viable solution to temporary summer droughts in the near future as the required water volumes are not likely to increase greatly. Late summer groundwater levels decrease substantially in the W+ scenario but not in the moderate G scenario. This drop in groundwater level would accelerate the on-going process of peat oxidation, resulting in increased soil subsidence, greenhouse gas emissions and nutrient release from mineralisation. The W+ scenario also led to higher nitrogen concentrations and lower phosphorus concentrations in the ditch network. Probably the reduced stream velocity in the W+ scenario results in an increased sedimentation of (adsorbed) phosphate. Sedimentation is a less important process in the nitrogen cycle, and the increased nitrogen concentrations anticipated in summer according to the W+ scenario are therefore probably the consequence of a reduced outlet of water due to increased evaporation. Additionally, an increased delivery of nitrogen through mineralisation could also contribute to the increased nitrogen concentrations in summer.
Methane and carbon dioxide fluxes were quantified for 14 ditches and larger water bodies in Dutch peatlands, surrounded by different habitat types, using concentration changes in floating flux chambers. Average fluxes from these waters were 11 ± 2 (mean ± SE) mg CH4 m−2 h−1 (n = 66) and 86 ± 21 mg CO2 m−2 h−1 (n = 55). Variability among water bodies was substantial in both gases and could be explained by water depth and surrounding habitat. Ditches in intensively used dairy land or rough pastures had significantly higher CH4 emission rates (17 ± 6 and 18 ± 8 mg CH4 m−2 h−1) than those in reed and sedge beds or open water (7 ± 1 and 5 ± 2 mg CH4 m−2 h−1). Bubbles contributed between 34 and 69% to the total CH4 flux, with higher proportions observed in ditches sheltered by tall vegetation. Observed day-time CO2 fluxes were either positive (shaded ditches in reed and sedge stands or rough pasture; 120–150 mg CO2 m−2 h−1) or did not differ from zero (open water, ditches in intensively managed pasture). Since these peatlands have substantial areas of permanent surface water (6–43%), landscape-scale carbon flux estimates are improved by incorporating specific flux estimates for these waters.
This paper describes a methodology to explore the (future) spatial distribution of biofuel crops in Europe. Two main types of biofuel crops are distinguished: biofuel crops used for the production of biodiesel or bioethanol, and second-generation biofuel crops. A multi-scale, multi-model approach is used in which biofuel crops are allocated over the period 2000–2030. The area of biofuel crops at the national level is determined by a macro-economic model. A spatially explicit land use model is used to allocate the biofuel crops within the countries. Four scenarios have been prepared based on storylines influencing the extent and spatial distribution of biofuel crop cultivation. The allocation algorithm consists of two steps. In the first step, processing plants are allocated based on location factors that are dependent on the type of biofuel crop processed and scenario conditions. In the second step, biofuel crops are allocated accounting for the transportation costs to the processing plants. Both types of biofuel crops are allocated separately based on different location factors. Despite differences between the scenarios, mostly the same areas are showing growth in biofuel crop cultivation in all scenarios. These areas stand out because they have a combination of well-developed infrastructural and industrial facilities and large areas of suitable arable land. The spatially explicit results allow an assessment of the potential consequences of large-scale biofuel crop cultivation for ecology and environment.
The European Union aims to increase the share of renewable energy in its total energy consumption to reduce greenhouse gas emissions and make the economy more CO2 neutral. This policy is further motivated by a desire to reduce dependency on fossil fuel imports and to stimulate rural development and the agricultural sector.
This paper presents an assessment of the potential impact of the EUs biofuel directive on European land use and biodiversity. In a spatially explicit analysis, it is determined which ecologically valuable land use types are likely to be directly replaced by biofuel crops. In addition, it is determined which land use types may be indirectly replaced by biofuel crops through competition over land between biofuel and food crops. Four scenarios of land use change are analyzed for the period 2000-2030 while for each scenario two policy variants are analyzed respectively with and without implementation of the biofuel directive. The results indicate that the area of semi natural vegetation, forest and High Nature Value farmland directly replaced by biofuel crops is small in all scenarios and differs little between policy variants. The direct effects of the directive on European land use and biodiversity therefore are relatively minor. The indirect effects of the directive on European land use and biodiversity are much larger than its direct effects. The area semi natural vegetation is found to be 3-8% smaller in policy variants with the directive as compared to policy variants without the directive. In contrast, little difference is found between the policy variants with respect to the forest area. The results of this study show that the expected indirect effects of the directive on biodiversity are much greater than its direct effects. This suggests that indirect effects need to be taken explicitly into account in assessing the environmental effects of biofuel crop cultivation and designing sustainable pathways for implementing biofuel policies.
Water and nutrient budgets were constructed for 13 low-lying peat polders in the Netherlands that varied in elevation relative to sea level (−0.2 to −2.4 m below sea level), land use (7–70% of the total polder area covered by agriculture; largely dairy farming), and surface water prevalence (6–43%). Water balances were verified with chloride budgets and accepted when both met the criterion (total inflows − total outflows)/(total inflows) <0.05. Apart from precipitation and evapotranspiration (overall means 913 vs. 600 mm), in- and outlet (171 vs. 420 mm) as well as in- and outward seepage (137 vs. 174 mm) were important items in the water budgets. Nutrient budgets, however, were dominated by terms related to agricultural land use (~60% of all inputs, 90% of N-removal and 80% of P removal) rather than water fluxes (8% and 5% of N and P inputs; 6 and 18% of outputs). After agriculture (200 kg N ha −1 y −1 ), mineralisation of the peat soil and atmospheric deposition appear to be important inputs (about 94 and 21 kg N ha −1 y −1 ). Major output terms were agricultural output (209 kg N ha −1 y −1 ) and denitrification (95 kg N ha −1 y −1 ). The average N budget was in balance (difference ~1 kg N ha −1 y −1 ), whereas P accumulated in most polders, particularly those under agriculture. The mean P surplus (15 kg P ha −1 y −1 in the 9 mainly agricultural polders) corresponds well with the accumulated difference observed elsewhere (700 kg P ha −1 in the upper 50 cm in a nature reserve versus 1400 under agriculture) after over 50 years of dairy farming. Bulk retention of N and P in these polders is taking place in the peat soil, through temporary sorption to the matrix and N is lost through denitrification. In a principal components analysis combining land use, landscape pattern, water balance and nutrient budget terms, the three-first principal components explained 63% of the variability. The first component (PC) correlated strongly with the percentage of land under agriculture ( r = 0.82) and negatively with the percentage covered by surface water ( r = −0.74). Most input and output terms of the nitrogen budget also correlated with this PC. The second PC covaried distinctly with the total area of a polder ( r = −0.79) and human population density at municipality level ( r = 0.75). Phosphorus loads in inlet and outlet water correlated with this PC. This suggests that the variability in nutrient budgets among polders is largely governed by agricultural land use.
 Jan E Vermaat合作论文数Vrije Universiteit Institute for Environmental Studies13
 Peter Verburg合作论文数Institute for Environmental Studies, Faculty of Science, Vrije Universiteit Amsterdam6
 Martin Banse合作论文数5
 s b hoek合作论文数4Willem Rienks合作论文数4
 Harm van den Heiligenberg合作论文数4
 I.R. Geijzendorffer合作论文数Alterra, Wageningen UR4
 Wim Salomons合作论文数Prof. Wim Salomons IVM-VU4Alison J. Gilbert合作论文数Institute for Environmental Studies, Free University of Amsterdam4Bas Eickhout合作论文数4
 Henk Westhoek合作论文数PBL – Netherlands Environmental Assessment Agency4L.A.E. Vullings合作论文数4
 JCM (Hans) Van Meijl合作论文数Wageningen University & Research3
 Andrzej Tabeau合作论文数Agricultural Economics Research Institute, Wageningen University & Research3meijl van j c m合作论文数2faculteit der aard en levenswetenschappen合作论文数2igor g staritsky合作论文数2
 Jeroen De Klein合作论文数Aquat Ecol & Water Qual Management Grp, Wageningen Univ2
 Lex Bouwman合作论文数Department of Earth Sciences-Geochemistry, Faculty of Geosciences, Utrecht University2
 Catharina Johanna Elizabeth Schulp合作论文数VU University Amsterdam2
 Jos T A Verhoeven合作论文数2A. H. Prins合作论文数2
 Sarian Kosten合作论文数Department of Aquatic Ecology and Water Quality Management, Wageningen University2
 Rob Alkemade合作论文数Faculty of Forestry;Kasetsart University;Faculty of Forestry, Kasetsart University2
 GL (Gerard) Velthof合作论文数Wageningen University and Research2Koen P. Overmars合作论文数Leiden University Institute of Environmental Sciences (CML) Leiden2
 A. J. P. Smolders合作论文数Environmental Biology;Department of Ecology;University of Nijmegen;Department of Ecology, University of Nijmegen2I.G. Staritsky合作论文数1
 Jelle van Minnen合作论文数1
 B. Elbersen合作论文数1w blum合作论文数1Geert Woltjer合作论文数1James Paterson合作论文数Geography and the Lived Environment, School of GeoSciences, The University of Edinburgh1
 Luigi Boitani合作论文数Department of Biology and Biotechnologies, University of Roma "La Sapienza";Fondation Segré1
 Joachim Maes合作论文数Joint Research Centre, European Commission1
 Joop Harmsen合作论文数1
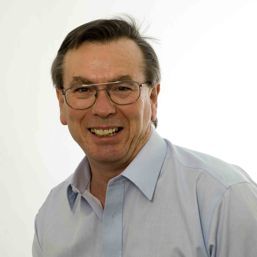 Brian Huntley (B. Huntley)合作论文数Department of Biosciences, University of Durham1
 Rien Aerts合作论文数Amsterdam Ecology/Department of Ecological Science, Vrije Universiteit Amsterdam1Astrid H Prins合作论文数1
 Mar Cabeza合作论文数Department of Biodiversity and Evolutionary Biology, CSIC1
 MM (Martha) Bakker合作论文数Wageningen University1
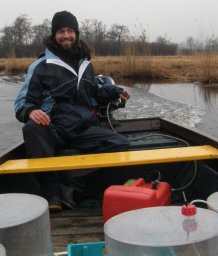 André T. C. Dias合作论文数Institute of Ecological Science, VU University Amsterdam1Regula Billeter合作论文数1Tijs Van Maasakkers合作论文数1
 Steven Broekx合作论文数1
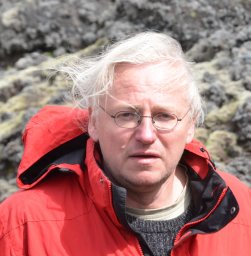 Carl Beierkuhnlein合作论文数Department of Biogeography, University of Bayreuth Biogeography1
 Richard S. P. van Logtestijn合作论文数Department of Geobiology, Utrecht University1
 Hans de Moel合作论文数Institute for Environmental Studies, Vrije Universiteit Amsterdam1
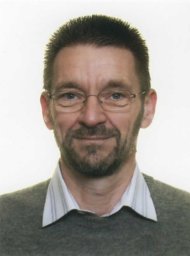 Guy Engelen合作论文数Research Institute for Knowledge Systems1




