This is the first regional porosity/permeability study to incorporate petroleum industry laboratory core analyses submitted to the Ontario government and managed by Ontario's Oil Gas and Salt Resources Library. This study comprises 11,759 analyses for the Early Silurian Lockport Group of southwestern Ontario from 150 drill cores. The Lockport Group consists of a cyclic succession of dolostones and minor limestones comprising, in ascending order: Gasport, Goat Island, Eramosa, and Guelph formations. This stacked carbonate succession was deposited on an eastward-deepening carbonate ramp, extending from Michigan, through southwestern Ontario, to Ohio, Pennsylvania and New York. It is overlain disconformably by restricted marine carbonates, evaporites and mixed shales of the Salina Group, whereas unconformably underlain by one of four formations that include, the Lions Head (a stratigraphic equivalent of part of the Rochester), DeCew, Rochester and Irondequoit. To ensure appropriate stratigraphic assignment of the laboratory test intervals, a quality assurance/quality control review on formational tops was carried out on the 150 cores that were tested. This regional subsurface work resulted in the reassignment of 846 formation tops that were verified by examination of drill core, drill cuttings, and geophysical well data including gamma-ray, neutron and density logs. Core analysis datasets have been validated by summarizing laboratory protocols and standards and reconciling data fields in the core analysis database with auxiliary data, including geophysical logs, thin sections, and core examinaion. This auxiliary data was then used to identify data outliers to update the core analysis database. The measurements of porosity and permeability were then assigned a formation rank plotted on a subregional scale. Average porosity and permeability values have been divided into statistical populations for each formation assigned by three depositional realms. The southwestern Ontario study area has been divided into three paleogeographic settings, based on distinctive lithofacies that correspond to different carbonate depositional regimes and regions of paleokarstification. From northwest to southeast, the lithofacies reflect an inner to outer carbonate ramp setting designated as area 1-3 from northwest to southeast. Area 1 is the inter-pinnacle karst region and includes some of thepinnacle structures within the Lockport Group. This region has the most significant paleokarstification of the upper Lockport Group (Guelph and Goat Island formations) and overlying Salina Group A-unit. Area 2 has rare pinnacle structures, where no porosity/permeability core analyses data are available. Area 3 is the middle to outer portion of the Lockport carbonate ramp, with local development of reef mound phases in the lower Goat Island and Gasport formations. The porosity and permeability variability corresponds with areal distribution of paleokarstification and resulting diagenetic phases in Area 1, and lithofacies variations and temporal/spatial history of karstification in Area 3. Higher porosity and permeability generally coincide with greater thicknesses of the oil and gas reservoir within pinnacles in Area 1 and reef mound phases of Lockport Group and lower Salina Group A-1 Carbonate in Area 3. Within inter-pinnacle karst regions in Area 1, average porosity for each formation is consistently high with little variations. In Area 3, a general increase of porosity and permeability towards the southeast corresponds with lithofacies ranging from restricted lagoonal/platform interior deposits to carbonate bank deposits with local development of reef mound phases in the Gasport and Goat Island formations. There has been significant erosion and karstification within and at the tops of these pinnacles, resulting in higher porosity and permeability of the Guelph and upper Goat Island formations, and the overlying Salina Group A-1 unit. Paleokarstic events have enhanced various porosity types, including intercrystalline, moldic, irregular and fenestral vugs, and cavities.
The regional 3-D geological model of the Paleozoic bedrock of southern Ontario will be published in 2019. The model encompasses all 110,000 km2 of the western St. Lawrence Lowlands region of south-western and south-central Ontario, except for Manitoulin Island. The model is constructed in Leapfrog© Works (Aranz Geo Limited) - an implicit modelling application, with 56 layers representing 70 Paleozoic bedrock formations, the Precambrian basement, and overlying unconsolidated sediments. Layers were constructed using formation depth data from 26,900 petroleum borehole records in the Ontario Petroleum Data System (OPDS), supplemented by hundreds of deep bedrock boreholes compiled by OGS. Formation depth data in the borehole records comprise the primary data input for the 3-D model. Model layers are based on a new lithostratigraphic chart prepared for this project. A new digital bedrock topography surface has also been constructed and is combined with a new digital subcrop geology map to assemble a grid of 3-D points that approximate and constrain the subcrop surface of each modelled formation and better align the layers with expert knowledge and mapped geology. Model development was an iterative cycle of interim model construction, expert geological appraisal to identify errors/inconsistencies in both the model construction and borehole database, followed by QA/QC editing of formation depth data using well records, geophysical logs, drill cuttings and drill core. QA/QC issues included; incorrect borehole location coordinates, data entry errors, missing / inconsistent / incorrect formation contact picks, sparse data, extrapolation issues beneath Lake Huron, mismatch of digital bedrock topography and bedrock geology, and need for improved data filtering algorithms for calculation of formation bottom depths in individual wells. This project has generated a robust lithostratigraphic model which is a logical next step in the evolution of regional geological mapping. It illustrates the geological connections and continuity between the surface and subsurface; a necessary precursor for understanding hydrogeological links between surface water systems and groundwater, and provides a physical basis for future development of a full hydrostratigraphic model for the area. Other practical applications of the model include; natural resource extraction (e.g., water, gypsum, salt, gas, oil, aggregate), site selection for nuclear waste disposal, exploitation of geothermal energy, public outreach and education, identification of gaps in data and knowledge, and shortcomings in modeling algorithms. Users must recognize that the model is a data-driven algorithmic representation of the actual bedrock geology and is not a substitute for detailed geological mapping. The model is considered a work-in-progress subject to future improvements as new and improved data, modeling software, data processing tools, and geological interpretations become available. The availability of OPDS well database was a critical component in the development of the 3-D model. Model development QA/QC has, in turn, improved the quality of the borehole and related databases.
A regional three-dimensional (3-D) lithostratigraphic model of the Paleozoic bedrock of southern Ontario has been completed. The model encompasses the entire Phanerozoic succession of southern Ontario (110 000 km2), consisting of over 1500 m of sedimentary strata straddling regional arch, or forebulge, zones separating the Appalachian foreland basin from the Michigan structural basin. This initiative provides an unprecedented regional 3-D perspective and digital framework based on an updated regional lithostratigraphic chart. Constructed using Leapfrog Works, an implicit modelling software application, the model format can readily support numeric groundwater-flow modelling. Fifty-four Paleozoic bedrock layers representing 70 formations, as well as the Precambrian basement and overlying unconsolidated sediment, were modelled at a spatial resolution of 400 m. Borehole records in Ontario's public petroleum well database (Ontario Petroleum Data System (OPDS)) were the principal data source, supplemented by Ontario Geological Survey (OGS) deep boreholes, measured sections, control points and Michigan boreholes. A newly revised digital bedrock topography surface combined with revised subcrop geology and digitized 3-D surface polyline and point constraints were used to better align the modelled layers and their extrapolation to the subcrop surface. Model development was an iterative cycle of interim modelling, expert geological appraisal, and quality assurance and control (QA/QC) editing of geological data using geophysical logs, drill cuttings and core, supplemented by manual editing of model layers. The 3-D model provides a robust representation of regional bedrock geology. A properly constructed borehole database and its supporting information is an essential requirement for construction of a 3-D model, but data errors, inconsistencies, data gaps, location errors, etc. can compromise the reliability of the model. From 2015 to 2018, project geologists and geological contract staff of the Oil, Gas and Salt Resources Library completed edits to 30 320 formation tops in a total of 7812 wells, resulting in a revised data set and permanent improvements to the petroleum well database. This report highlights the importance of QA/QC of well data, specifically formation top identification, and summarizes the data improvements made in support of the present 3-D model. No seismic data was available.
A preliminary 3D model of the Paleozoic bedrock geology of southern Ontario has been constructed using Leapfrog implicit modelling software, subsurface geological data and expert knowledge. With advances in computer hardware and software, and availability of digital well and drillhole databases it is now possible to model and visualize subsurface geological relationships in 3D at regional scales. This is a valuable tool for geologists in interpreting and understanding the geology and geological history of an area, and for communication of geological concepts to non-geologists. In the virtual visualization environment, the geology can be examined from a number of perspectives interactively. The stratigraphic succession and boundary geometry can be identified by either progressive removal of units or cross-section slicing. In the southern Ontario model features that can be viewed and studied include depositional and erosional limits, reefs, faults, salt dissolution and collapse structures, regional dips, arches, depositional and structural basins, oil and gas traps, and regional aquifers. To increase the visibility of this model and to expand the audience beyond the technical geological client group an animation of the model has been produced. The animation is approximately three minute and thirty seconds long and provides a systematic progression through the model units, provides regional context, an overview to the data support, and illustration and explanation of geological features. Selected geological features are presented and highlighted through graphic techniques supported by embedded imagery, annotations, animations and maps. It previews the shareware viewing software available for viewing of the model and highlights some of the tools available for interacting with the model. Communication of geoscience knowledge to audiences outside of the core geoscience community is key to support groundwater related decision-making. The animation has been released on GEOSCAN; however, is inadequate unless publicized through other mechanisms, public awareness of GSC publication released via Geoscan is limited. To enhance publication visibility the mp4 file was posted on YouTube, LinkedIn, and ResearchGate. In this case, LinkedIn proved to be the most successful in reaching an expanded audience. Within one week of posting the animation was viewed by over 800 people, reaching over 3 times the number of LinkedIn connections attributed to the author. LinkedIn provided summary information by country, title (geologist), and company affiliation. Interest in the model was focused in Ontario; however; significant access to the model also occurred in Vancouver and Perth Australia. Based on company affiliation access was logged from a suite of recognized hydrogeological consultants working in Canada, 3D modelling companies in New Zealand, and provincial agencies, e.g. the Alberta Energy Regulator. Penetration within YouTube (32) and ResearchGate (5, 2 days) was one to two orders of magnitude less than via LinkedIn. Additional social media options such as Mendeley, Facebook, and Twitter were not exploited but likely would provide exposure, at least in part, to complementary audiences rather than targeting the same audiences.
A 3D geological model of the Paleozoic bedrock geology of Southern Ontario is being developed through a collaborative project involving the Ontario Geological Survey (OGS), Geological Survey of Canada (GSC), Ministry of Natural Resources & Forestry (MNRF), and Oil, Gas, Salt, Resources Library (OGSRL). This multi-year initiative involves a number of parallel objectives, including: 1) update of rock unit nomenclature at formation and group levels; 2) characterize criteria for delineating formational contacts; 3) better constrain the bedrock topography surface by integrating data from regional MOECC (water) and OGSRL (oil and gas) wells; 4) develop a revised bedrock topography for Lake Ontario from legacy shallow reflection data; 5) revise formation boundaries to update the Paleozoic bedrock geology maps; and 6) delineate groundwater types (potable vs non-potable) with a focus on potable groundwater within the shallow, karst-influenced, carbonate-dominated and cuesta-forming bedrock successions. The latter two initiatives will extend beyond the scope of the 3D Paleozoic bedrock model project. This project builds upon the OGS mandate to map the potable groundwater resources of Ontario and the GSC mandate to delineate key aquifers across the country. Preliminary 3D geologic models have been developed using LeapfrogTM Hydro implicit modelling software based on more than 26,700 deep petroleum boreholes and published OGS bedrock geology maps. The model area covers approximately 110,000 km2, extending across south-central and southwestern Ontario and beneath the Great Lakes to the US border, but not Manitoulin Island. The model currently comprises 61 layers and attempts to render the bedrock topography, the Precambrian- Paleozoic contact, and the regional variability of 58 Paleozoic bedrock formations plus sediment cover. It is a product of an ongoing, iterative process of interim modelling, model review, and QA/QC editing of formation picks. LeapfrogTM modelling software is used to produce 3D models based upon Radial Basis Functions primarily using the formation depth picks. LeapfrogTM lends itself well to iterative data QA/QC because data inputs can be readily reloaded without the need to re-construct the formation contact structure and model chronostratigraphy. The formation model will eventually be reclassified to a hydrostratigraphic model. In 2015 and 2016 project geologists reviewed over 50,000 formation picks by examination of geophysical logs, core and drill cuttings, and more than 100,000 digital water well records. Issues resolved include: well location errors, formation assignment, anomalous data points, and wells with missing or incorrect formation picks and bedrock characterization. The study integrates traditional outcrop/field- and lab-based protocols and petroleum industry subsurface mapping techniques, with GIS, database mining and queries, and 2D and 3D mapping and modelling techniques. Over the past 12 months, efforts have focused on refining formational contacts and regional distributions of Paleozoic formations, including: 1) stacked Ordovician-, Silurian- and Devonian-age carbonates that form regional karstic escarpments that are variably blanketed by Quaternary sediments; 2) select Devonian and Cambrian siliciclastics; and 3) key regional clay-rich sedimentary rocks and mixed carbonates-siliciclastics that appear to form regional to sub-regional aquitards.
In 2008, the Ontario Geological Survey (OGS) released a map of known and potential karst in southern Ontario. Known karst occurs mostly in areas where glacial overburden is thin (<1m) or absent and in many places the top of bedrock shows evidence of active, ongoing solution-enhancement. Data from deep bedrock boreholes indicate that karst in Ontario's carbonate terrains is much more widespread than can be observed on surface and that it extends into areas covered by thick glacial sediments. Direct evidence for this pre-glacial karst includes: (1) televiewer logs and drill-core showing solution-enhanced bedding planes and sequence boundaries; (2) drill records reporting large cavities in bedrock that are open or filled with glacio-fluvial sediments; (3) epikarst and bedrock conduits in quarries; (4) drift thickness mapping with extensive buried valleys and canyons, some that appear to form natural bridges; and (5) thick glacial sediment-covered areas with extensive interpreted karst rubble at the bedrock surface. Traditional methods for local mapping of subsurface karst and its effects on groundwater cannot be easily adapted for regional-scale studies. Physical techniques include tracer tests and piezometric logging of monitoring wells to detect conduits (by the rapid rise and fall of water levels); chemical techniques include monitoring, at spring vents, of pH, Ca2+, HCO3 - and saturation indices of carbonate minerals to determine the degree of corrosiveness of groundwater. However, these are all proximal techniques that characterize individual, known systems. To date, there are no well-developed regional techniques that can map areas where groundwater is influenced by buried karst over a wide area. Here we describe a methodology that uses dissolved CO2 and O2 in groundwater to map areas in buried karstic carbonates that have a rapid hydraulic connection to surface. O2 originates in the atmosphere and has no geological sources. CO2 in groundwater originates largely in the soil zone and has few other geogenic sources in non-tectonic settings. Because both parameters are attenuated with increasing distance from their sources, a CO2/O2 factor allows for an objective description of how well connected these buried karstic groundwater systems are to meteoric and soil zone recharge sources. An empirically derived lower threshold for the CO2/O2 factor delineates a number of large regions in southern Ontario where groundwater is elevated in either or both gases; all of these are centred on areas of known karst. Groundwater analysis using tritium, nitrate and bacteria (for samples collected from secure-cap water supply wells) show that these areas have younger, more recently recharged groundwater with a relatively rapid connection to the surface environment. Regional CO2/O2 and other chemical, isotopic and bacteriological data were purpose-filtered from the large, publically accessible OGS Ambient Groundwater Geochemistry database. This is an exceptionally well characterized groundwater geochemical dataset for samples collected on a uniform grid from domestic, farm and monitoring wells across southern Ontario. Mapping areas of groundwater vulnerability to surface contamination due to karstic flow systems is another of the many possible uses for this database.
Since the commencement of the Ontario Geological Survey's groundwater initiative in 2001, a wealth of geoscience information that can assist in an improved understanding of the provincial groundwater resources has been collected, analyzed and reported on. The initiative consists of 5 main activities, which produce intimately related data sets, including. 1) A series of digital, fully-attributed, seamless maps including bedrock geology, karst, physiography, surficial geology, surficial sediment thickness and bedrock topography that serve as a foundation for most hydrogeological investigations. 2) 3-D maps of key Paleozoic bedrock units that host important groundwater resources in southern Ontario paying particular attention to identifying the main geologic controls on groundwater flow and mapping and delineating regional scale groundwater flow systems within the context of a sequence stratigraphic framework. Detailed hydrogeological studies were undertaken in the City of Guelph to better understand the lateral continuity of flow zones by integrating the geological dataset with discrete hydraulic tests over short vertical intervals believed to represent flow zones. Reporting on the Niagara Escarpment Silurian projects is nearing completion and a project focussing on Devonian units to the southwest is currently underway. 3) 3-D models of Quaternary sediment in southern Ontario focussing initially on areas either within or adjacent to the Greater Golden Horseshoe. To date, projects have been completed in the Waterloo (GRS03), Barrie-Oro (GRS11), Brantford-Woodstock (GRS10) and Orangeville-Fergus (GRS15) areas. Work in Southern Simcoe County is nearing completion and projects in the Niagara and Central Simcoe County areas are well underway. The 3-D sediment mapping program uses a basin analysis approach similar to that used by the GSC in the Oak Ridges Moraine. Ground and airborne geophysical surveys coupled with surficial sediment mapping and continuous-coring have enabled the development and refinement of conceptual geologic models, critical for the successful construction of 3-D geologic models. Projects in the Ottawa-St. Lawrence and Norfolk areas are scheduled to begin following completion of ongoing projects. 4) The ambient groundwater geochemistry project, which was initiated in 2007, has collected untreated bedrock- and surficial sediment-derived groundwaters at more than 2100 stations across all of southern Ontario, with the aim of understanding relationships between aquifer composition and groundwater quality, as well as understanding the flow history, residence time and vulnerability of individual and regional groundwater sources. The sampling density is approximately 2 stations per 10X10 km block (100 square kilometers). Each record contains 134 fields, 27 of which describe the station and 107 that describe the water and its chemical constituents. Digital datasets and maps were released for all of southern Ontario in 2015 (MRD283-REV) and an accompanying Groundwater Resource Study is currently in preparation. Meanwhile, a similar study is about to begin in the Sudbury region in 2016. 5) Parallel thematic projects including a study of the geology and hydrogeology of the Dundas buried bedrock valley (GRS12) and an assessment of the subsurface sediments in the central Norfolk sand plain (GRS14) were conducted in partnership with the Grand River Conservation Authority.
 A F Bajc合作论文数11E.J. Debicki合作论文数9S. Préfontaine合作论文数9O. Marcus Burnham合作论文数9
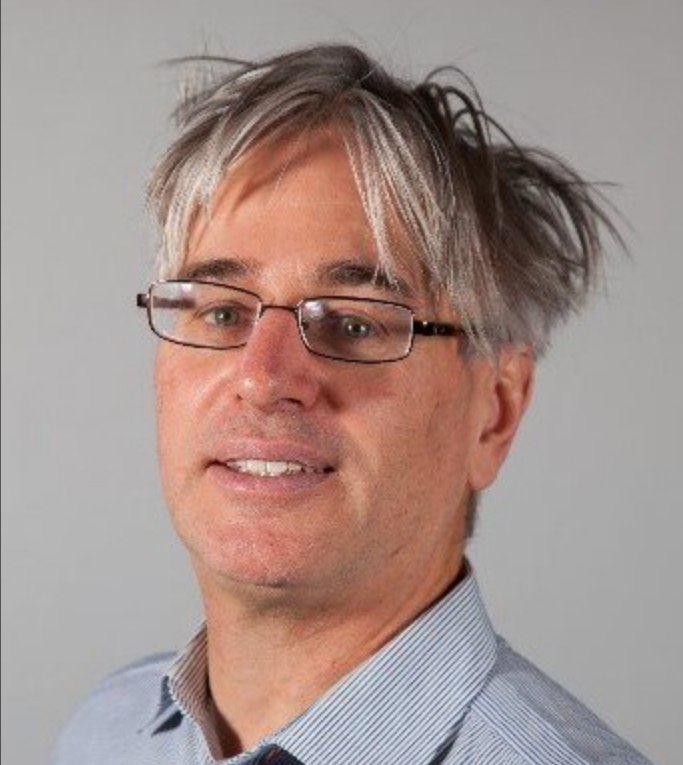 Hazen A. J. Russell合作论文数Geological Survey of Canada9Richard D. Dyer合作论文数9G. P. Beakhouse合作论文数9C.E. Logan合作论文数7R Michael Easton合作论文数7L Sutherland合作论文数6K Yeung合作论文数6T Carter合作论文数5T R Carter合作论文数5L Fortner合作论文数5E. H. Priebe合作论文数5J K Clark合作论文数4S M Hamilton合作论文数3A K Burt合作论文数3R T Metsaranta合作论文数3C Logan合作论文数3R P
M Mulligan合作论文数2Boyan Brodaric合作论文数Natural Resources Canada, Geological Survey of Canada2Peter Barnett合作论文数2R P M Mulligan合作论文数1
Hazen A. J. Russell合作论文数Geological Survey of Canada9Richard D. Dyer合作论文数9G. P. Beakhouse合作论文数9C.E. Logan合作论文数7R Michael Easton合作论文数7L Sutherland合作论文数6K Yeung合作论文数6T Carter合作论文数5T R Carter合作论文数5L Fortner合作论文数5E. H. Priebe合作论文数5J K Clark合作论文数4S M Hamilton合作论文数3A K Burt合作论文数3R T Metsaranta合作论文数3C Logan合作论文数3R P
M Mulligan合作论文数2Boyan Brodaric合作论文数Natural Resources Canada, Geological Survey of Canada2Peter Barnett合作论文数2R P M Mulligan合作论文数1 Robert L. Linnen合作论文数1R. S. Hiebert合作论文数1
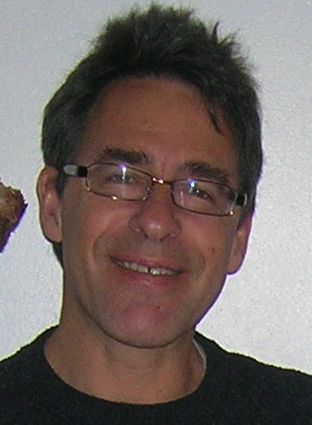 Daniel Kontak合作论文数Harquail School of Earth Sciences, Faculty of Science, Engineering and Architecture, Laurentian University1
 Sandra L. Kamo合作论文数Jack Satterly Geochronology Laboratory, University of Toronto1
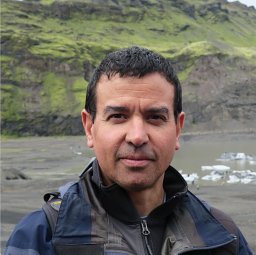 Pedro Jugo合作论文数Department of Earth Sciences;Laurentian University;Department of Earth Sciences, Laurentian University1Simon E. Jackson合作论文数Geological Survey of Canada, Natural Resources Canada1
 Peter Hollings合作论文数Lakehead University1
 Jacob James Hanley合作论文数Southwest Research Institute1
 Bruno Lafrance合作论文数1
 Michael Lesher合作论文数1
 Andrey Bekker合作论文数Department of Earth and Planetary Sciences, University of California, Riverside1
 Anne-Aurelie Sappin合作论文数Département de géologie et de génie géologique, Université Laval1
 Iain M. Samson合作论文数Department of Earth Sciences;University of Windsor;Department of Earth Sciences, University of Windsor1




