This paper focuses on the impact mechanism and trend prediction of AI on carbon emission efficiency in Chinese provinces and regions, and utilizes two-way fixed-effects model, panel threshold model, spatial Durbin model (SDM) and XGBoost machine learning model. The results show that there is significant regional heterogeneity in the promotion of AI on carbon emission efficiency, and there exists a dynamic evolution path of "single-double-three thresholds", which needs to cross the threshold to release the green dividend. Carbon emission efficiency shows a significant positive spatial correlation, and the indirect effect of AI technology spillover in geographically neighboring regions is 0.0379. The XGBoost model realizes high-precision prediction of carbon emission efficiency through data enhancement and parameter optimization, and Jiangsu and Beijing is expected to exceed 0.9 by 2027.The study provides a good basis for the study on the impact of regional differentiated emission reduction policies and development of the "dual carbon" target. The study provides theoretical and methodological support for the synergistic application of regional differentiated emission reduction policies and AI technology under the "dual-carbon" target.
The accurate estimation of crop evapotranspiration (ETc) is essential for precision irrigation, optimal allocation of regional water resources, and efficiency improvement of agricultural water resources. This study developed Random Forest (RF), Support Vector Machine (SVM), Artificial Neural Network (ANN) and Extreme Learning Machine (ELM) models for maize ETc estimation in northwest China. The meteorological data and crop data from 2011 to 2012 were used to train the RF, SVM, ANN and ELM. The models' simulation accuracy was verified by using the data of 2013 under six different input combinations. The input combinations included daily data for crop coefficient (K-c), global solar radiation (R-s), wind speed (u(2)), maximum and minimum air temperatures (T-max and T-min), and maximum and minimum relative humidity (RHmax and RHmin). The results showed that the SVM model achieved the highest simulation accuracy at the seedling emergence to jointing stage and at the grouting to harvest stage of summer maize, with the coefficient of determination (R2) ranging 0.701-0.895 and 0.637-0.841, mean absolute error (MAE) ranging 0.310-0.654 and 0.468-0.743 mm/d, and mean square error (MSE) ranging 0.227-0.722 and 0.513-1.227 mm/d, respectively. The ELM model achieved the highest simu-lation accuracy at the booting to silking stage and during the whole growth period, the coefficient of determi-nation (R-2) ranging 0.601-0.828 and 0.891-0.954, mean absolute error (MAE) ranging 0.418-1.194 and 0.285-0.530 mm/d, and mean square error (MSE) ranging 0.887-2.515 and 0.182-0.587 mm/d, respectively. Considering the accessibility and simulation accuracy of input parameters, the SVMI-2, ELMII-5, SVMIII-4, and ELMIV-2 models were recommended for simulating ETc at the seedling emergence to jointing stage, at the booting to silking stage, at the grouting to harvest stage, and during the whole growth period, with the coefficient of determination (R-2) of 0.796, 0.879, 0.800 and 0.896, mean absolute error (MAE) of 0.416, 0.418, 0.553 and 0.328 mm/d, and mean square error (MSE) of 0.327, 0.887, 0.655 and 0.190 mm/d, respectively. In conclusion, machine learning models can accurately simulate the daily evapotranspiration of maize in northwest China.
Accurate prediction of global solar radiation (Rs) is vital for investment decisions and solar energy distribution. In this study, three hybrid models (ACO-SVM, CS-SVM, and GWO-SVM) based on ant colony optimization (ACO), cuckoo search (CS) and grey wolf optimization (GWO) algorithms were proposed to optimize support vector machine (SVM) for predicting Rs in four climate zones of China (temperate continental zone TCZ, mountain plateau zone MPZ, temperate monsoon zone TMZ, and subtropical monsoon zone SMZ). They were compared with the standalone backpropagation neural network model, decision tree, and support vector machines. The results demonstrated that among the standalone models, support vector machines performed best with the highest accuracy in Rs estimation in each climate zone of China, followed by the decision tree and backpropagation neural network models, with a coefficient of determination (R2) in 0.707–0.882, 0.694–0.881, and 0.681–0.850, respectively. In contrast, the hybrid models exhibited higher accuracy than standalone support vector machines in four climatic regions of China, with the coefficient of determination (R2) increasing by 5.361%, 5.476%, 7.382%, and 10.965%, respectively. Among hybrid models, GWO-SVM performed better than CS-SVM, and both had higher accuracy than ACO-SVM, with the coefficient of determination (R2) in 0.809–0.927, 0.804–0.926, and 0.793–0.930, respectively. Therefore, the hybrid models (ACO-SVM, CS-SVM, and GWO-SVM), especially GWO-SVM and CS-SVM, can significantly improve the accuracy for predicting Rs in various regions of China.
Gait, a unique biometric identifier for recognizing individual identity at a distance, plays an important role in practical applications. Existing gait recognition methods utilize either a gait set or a sequence. However, these methods ignore the periodic characteristic of gait, where actions at one moment are related to actions at another moment. As a result, their recognition accuracy in real scenes can significantly decrease due to noise and frame loss. To deal with this issue, we design a NLGait network to explore the temporal relation among gait frames, which adaptively leverages both local and non-local relations to achieve practical gait recognition. Specifically, we design multi-scale temporal information extractor (MTIE) to capture these relations. Furthermore, we design an attention based adaptive frame fuser (AFF) to aggregate the features of frames in a gait sequence. Extensive experiments have verified the competitive accuracy and robustness of our method. The accuracy of the counterpart methods is degraded by 8.9% and 19.3%, respectively, due to noise and temporal loss, while ours is degraded by only 3.6% and 2.7%.
In this paper, we propose an approach that improves segmentation networks with automatic augmentation networks for dental mesh data. Since conventional data augmentation is to augment all samples uniformly with predefined parameters, it ignores the unique characteristics of a single tooth sample and cannot make good use of the data set. And the traditional method separates data augmentation and segmentation network training, so the augmented data cannot be well adapted to the network to make it play a good role. We adopt a joint optimization strategy to integrate the augmentation network and the segmentation network, so that the augmented tooth data is the most suitable for the segmentation network. In addition, we design new improved loss functions suitable for augmentation and segmentation networks. Experiments have shown that the automatic augmentation network in our proposed method, named MeshAugNet, can effectively improve the segmentation accuracy after it is used for tooth segmentation. In general, this work achieves a combination of 3D dental data auto- augmentation network and segmentation network, which improves the accuracy of tooth segmentation, and can be used to solve the problem of too few samples in tooth datasets.
With the increasing demand for search and rescue, it is highly demanded to detect objects of interest in large-scale images captured by unmanned aerial vehicles (UAVs), which is quite challenging due to extremely small scales of objects. Most existing methods employed a feature pyramid network (FPN) to enrich shallow layers' features by combining deep layers' contextual features. However, under the limitation of the inconsistency in gradient computation across different layers, the shallow layers in FPN are not fully exploited to detect tiny objects. In this article, we propose a scale selection pyramid network (SSPNet) for tiny person detection, which consists of three components: context attention module (CAM), scale enhancement module (SEM), and scale selection module (SSM). CAM takes account of context information to produce hierarchical attention heatmaps. SEM highlights features of specific scales at different layers, leading the detector to focus on objects of specific scales instead of vast backgrounds. SSM exploits adjacent layers' relationships to fulfill suitable feature sharing between deep layers and shallow layers, thereby avoiding the inconsistency in gradient computation across different layers. Besides, we propose a weighted negative sampling (WNS) strategy to guide the detector to select more representative samples. Experiments on the TinyPerson benchmark show that our method outperforms other state-of-the-art (SOTA) detectors.
Traditionally, it is a time-consuming work for experts to accomplish pollen grains classification. With the popularity of deep Convolutional Neural Network (CNN) in computer vision, many automatic pollen grains classification methods based on CNN have been proposed in recent years. However, The CNN they used often focus on the most proniment area in the center of pollen grains and neglect the less discriminative local features in the surrounding of pollen grains. In order to alleviate this situation, we propose two data augmentation operations. Our experiment results on Pollen13K achieve a weighted F1 score of 97.26% and an accuracy of 97.29%.
Digital watermarking has been widely used to protect the copyright and integrity of multimedia data. Previous studies mainly focus on designing watermarking techniques that are robust to attacks of destroying the embedded watermarks. However, the emerging deep learning based image generation technology raises new open issues that whether it is possible to generate fake watermarked images for circumvention. In this paper, we make the first attempt to develop digital image watermark fakers by using generative adversarial learning. Suppose that a set of paired images of original and watermarked images generated by the targeted watermarker are available, we use them to train a watermark faker with U-Net as the backbone, whose input is an original image, and after a domain-specific preprocessing, it outputs a fake watermarked image. Our experiments show that the proposed watermark faker can effectively crack digital image watermarkers in both spatial and frequency domains, suggesting the risk of such forgery attacks.
Plant disease is a significant threat to food security and subsistence farmers. Despite the rapid development of automatic recognition of plant disease under controlled laboratory conditions since the employment of deep learning technology, it is still quite challenging to distinguish plant disease under uncontrolled field conditions. In this paper, based on a backbone convolutional neural network (CNN), we propose an improved CNN model towards field plant disease recognition (FPDR) by exploring the potential and generalization capabilities of the CNN model. To train the model, we propose background replacing to make the model more robust to background distraction, and leaf resizing to deal with inconsistent size and location of disease symptoms. Both background replacing and leaf resizing are used as data augmentation methods of the improved model. To further enhance the feature discriminativeness, we propose channel orthogonal constraint to improve the ability of feature to distinguish similar categories, and utilize species information as an auxiliary species classification task. In addition, we collect 665 plant disease images under field conditions, namely Field-PlantVillage (Field-PV) to remedy for lack of in-the-field images. The Field-PV is only used as an independent test set to evaluate the performance of the method applied to FPDR. Our improved CNN model improves the FPDR accuracy on Field-PV from 41.81% to 72.03%, though only the PlantVillage dataset is used for training. Experimental result on the PlantVillage achieves the state of the art performance (99.84%). Code and data are available at https://github.com/PatrickGui/FPDR/tree/master.
High-throughput genotyping coupled with molecular breeding approaches has dramatically accelerated crop improvement programs. More recently, improved plant phenotyping methods have led to a shift from manual measurements to automated platforms with increased scalability and resolution. Considerable effort has also gone into the development of large-scale downstream processing of the imaging datasets derived from high-throughput phenotyping (HTP) platforms. However, most available tools require some programing skills. We developed PhenoImage – an open-source GUI based cross-platform solution for HTP image processing with the aim to make image analysis accessible to users with either little or no programming skills. The open-source nature provides the possibility to extend its usability to meet user-specific requirements. The availability of multiple functions and filtering parameters provides flexibility to analyze images from a wide variety of plant species and platforms. PhenoImage can be run on a personal computer as well as on high-performance computing clusters. To test the efficacy of the application, we analyzed the LemnaTec Imaging system derived RGB and fluorescence shoot images from two plant species: sorghum and wheat differing in their physical attributes. In the study, we discuss the development, implementation, and working of the PhenoImage .Highlight PhenoImage is an open-source application designed for analyzing images derived from high-throughput phenotyping.
It is challenging to interpret hyperspectral images in an intuitive and meaningful way, as they usually contain hundreds of dimensions. We develop a visualization tool for hyperspectral images based on neural networks, which allows a user to specify the regions of interest, select bands of interest, and obtain hyperspectral classification results in a scatterplot generated from hyperspectral features. A cascade neural network is trained to generate a scatterplot that matches the cluster centers labeled by the user. The inferred scatterplot not only shows the clusters of points, but also reveals relationships of substances. The trained neural network can be reused for time-varying hyperspectral data analysis without retraining. Our visualization solution can keep domain experts in the analytical loop and provide an intuitive analysis of hyperspectral images while identifying different substances, which are difficult to be realized using existing hyperspectral image analysis techniques.
It is challenging to interpret hyperspectral images in an intuitive and meaningful way, as they usually contain hundreds of dimensions. We develop a visualization tool for hyperspectral images based on neural networks, which allows a user to specify the regions of interest, select bands of interest, and obtain hyperspectral classification results in a scatterplot generated from hyperspectral features. A cascade neural network is trained to generate an scatterplot that matches the cluster centers labeled by the user. The inferred scatterplot not only shows the clusters of points, but also reveals relationships of substances. The trained neural network can be reused for time-varying hyperspectral data analysis without re-training. Our visualization solution can keep domain experts in the analytical loop and provide an intuitive analysis of hyperspectral images while identifying different substances, which are difficult to be realized using existing hyperspectral image analysis techniques. HYPERSPECTRAL CAMERA takes images of objects at different wavelengths [1] and can provide abundant spectral information about different objects, thereby being widely applied in many disciplines, such as remote sensing and plant science. Hyperspectral images can be modeled as a hyperspectral cube (Figure 1). However, they are different from traditional volume data, where the spatial dimensions and the spectral dimension have different physical meanings. The x and y dimensions are the spatial axes of the objects in the images. The z or λ axis is the spectral axis, which contains spectral information of substances. Here we define substances as objects that have the same spectral characteristics. Each 2D position in the xy-plane corresponds to a hyperspectral curve that is formed by a series of pixels from the same 2D position of all images along the z or λ axis. Many existing studies investigate how to identify substances from hyperspectral images through clustering, classification, or image fusion techniques [2], [9], but could not meet emerging requirements on finer-grained analysis. For example, in our collaboration with plant scientists, we have collected time-varying hyperspectral images of plants. Our collaborators, who are domain experts in the field of agronomy and horticulture, want to study how to differentiate various parts of IEEE Computer Graphics and Applications Published by the IEEE Computer Society © 2021 IEEE 1 Figure 1. Illustration of hyperspectral images. Hyperspectral images (right) of a rice plant is taken over a series of bands and a fused image (left) is usually generated as the final result. an object with different bands, leading to new analysis requirements: • Extract essential hyperspectral features that can well represent the hyperspectral images. • Support interactive exploration of substances with classification or image fusion results. However, most traditional methods [2], [4], [9] act as black boxes and generate one-time results from all the bands of a whole image, which are less intuitive and flexible for further investigating hyperspectral features. Meanwhile, these methods often lack a support of interactive exploration. Through detailed discussions with our domain experts, several challenges have been identified to meet these requirements. First, domain experts want to interactively select regions of interest (ROIs) and bands of interest (BOIs). While it is relatively easy for users to define ROIs on a 2D image, it is non-trivial to develop an intuitive visualization interface to select BOIs from hundreds or thousands of bands with significant intensity variations. Second, the colors of image fusion results often change according to different user selections of regions or bands, making it challenging for users to identify and track the same substances, particularly with time-varying data. Third, it is difficult for users to characterize features from a large number of hyperspectral bands and identify the correspondence between hyperspectral features and image fusion results. To address these challenges, we advocate combining classification and visualization to develop an interactive analytics pipeline for hyperspectral images. Our work makes the following major contributions: • We explore and identify appropriate hyperspectral information to support interactive selections of ROIs and BOIs. • We devise a new neural network based approach to generate a scatterplot and facilitate users to interactively examine the correspondence between hyperspectral features and substances by brushing the scatterplot. • We use the neural network to generate pseudo colors and lead to stable image fusion results for identifying and tracking substances. We have demonstrated the effectiveness of our approach using datasets from remote sensing and plant phenotyping. Our visualization solution keeps domain experts in the analytical loop. It can facilitate scientists from different domains to effectively study hyperspectral images and gain new discoveries that are not conveyed with existing techniques.
With the development of consumer-level depth sensors, 3D face point cloud data can be easily captured now. However, such data are often accompanied by low resolution, noise, and holes. At the same time, high-precision 3D scanners are bulky and can not be widely used in daily applications due to costs and inconvenience. To fill the gap between low and high resolution 3D faces, we propose a two-stage framework named the face point cloud super-resolution network (FPSRN) to recover high-resolution 3D face data from the low-resolution counterparts. As the human faces can be aligned into a unified coordinate system, we formulate point cloud super-resolution as a z-coordinate prediction problem. Cascaded auto-encoders are employed to retain both global structure and boundary information of different face regions during super-resolution. Compared with state- of-the-art point cloud completion methods and depth estimation methods, our method improves the Earth-Mover’s Distance (EMD) and the Root Mean Square Error (RMSE) metrics by 43% and 25%, respectively.
The use of 3D plant models for high-throughput phenotyping is increasingly becoming a preferred method for many plant science researchers. Numerous camera-based imaging systems and reconstruction algorithms have been developed for the 3D reconstruction of plants. However, it is still challenging to build an imaging system with high-quality results at a low cost. Useful comparative information for existing imaging systems and their improvements is also limited, making it challenging for researchers to make data-based selections. The objective of this study is to explore the possible solutions to address these issues. We introduce two novel systems for plants of various sizes, as well as a pipeline to generate high-quality 3D point clouds and meshes. The higher accuracy and efficiency of the proposed systems make it a potentially valuable tool for enhancing high-throughput phenotyping by integrating 3D traits for increased resolution and measuring traits that are not amenable to 2D imaging approaches. The study shows that the phenotype traits derived from the 3D models are highly correlated with manually measured phenotypic traits (R-2 > 0.91). Moreover, we present a systematic analysis of different settings of the imaging systems and a comparison with the traditional system, which provide recommendations for plant scientists to improve the accuracy of 3D construction. In summary, our proposed imaging systems are suggested for 3D reconstruction of plants. Moreover, the analysis results of the different settings in this paper can be used for designing new customized imaging systems and improving their accuracy.
Facial expression recognition (FER) is still a challenging problem if face images are contaminated by occlusions, which lead to not only noisy features but also loss of discriminative features. To address the issue, this paper proposes a novel adversarial disentangled features learning (ADFL) method for recognizing expressions on occluded face images. Unlike previous methods, our method defines an explicit noise component in addition to the identity and expression components to isolate the occlusion-caused noise features. Besides, we learn shape features with joint supervision of 3D shape reconstruction and facial expression recognition to compensate for the occlusion-caused loss of features. Evaluation on both in-the-lab and in-the-wild face images demonstrates that our proposed method effectively improves FER accuracy for occluded images, and can even deal with noise beyond occlusions.
Water deficit during the early vegetative growth stages of wheat (Triticum) can limit shoot growth and ultimately impact grain productivity. Introducing diversity in wheat cultivars to enhance the range of phenotypic responses to water limitations during vegetative growth can provide potential avenues for mitigating subsequent yield losses. We tested this hypothesis in an elite durum wheat background by introducing a series of introgressions from a wild emmer (Triticum turgidum ssp. dicoccoides) wheat. Wild emmer populations harbor rich phenotypic diversity for drought-adaptive traits. To determine the effect of these introgressions on vegetative growth under water-limited conditions, we used image-based phenotyping to catalog divergent growth responses to water stress ranging from high plasticity to high stability. One of the introgression lines exhibited a significant shift in root-to-shoot ratio in response to water stress. We characterized this shift by combining genetic analysis and root transcriptome profiling to identify candidate genes (including a root-specific kinase) that may be linked to the root-to-shoot carbon reallocation under water stress. Our results highlight the potential of introducing functional diversity into elite durum wheat for enhancing the range of water stress adaptation.
Accurate measurement of seed size parameters is essential for both breeding efforts aimed at enhancing yields and basic research focused on discovering genetic components that regulate seed size. To address this need, we have developed an open-source graphical user interface (GUI) software, SeedExtractor that determines seed size and shape (including area, perimeter, length, width, circularity, and centroid), and seed color with capability to process a large number of images in a time-efficient manner. In this context, our application takes ∼2 s for analyzing an image, i.e., significantly less compared to the other tools. As this software is open-source, it can be modified by users to serve more specific needs. The adaptability of SeedExtractor was demonstrated by analyzing scanned seeds from multiple crops. We further validated the utility of this application by analyzing mature-rice seeds from 231 accessions in Rice Diversity Panel 1. The derived seed-size traits, such as seed length, width, were used for genome-wide association analysis. We identified known loci for regulating seed length (GS3) and width (qSW5/GW5) in rice, which demonstrates the accuracy of this application to extract seed phenotypes and accelerate trait discovery. In summary, we present a publicly available application that can be used to determine key yield-related traits in crops.
A higher minimum (night-time) temperature is considered a greater limiting factor for reduced rice yield than a similar increase in maximum (daytime) temperature. While the physiological impact of high night temperature (HNT) has been studied, the genetic and molecular basis of HNT stress response remains unexplored. We examined the phenotypic variation for mature grain size (length and width) in a diverse set of rice accessions under HNT stress. Genome-wide association analysis identified several HNT-specific loci regulating grain size as well as loci that are common for optimal and HNT stress conditions. A novel locus contributing to grain width under HNT conditions colocalized with Fie1, a component of the FIS-PRC2 complex. Our results suggest that the allelic difference controlling grain width under HNT is a result of differential transcript-level response of Fie1 in grains developing under HNT stress. We present evidence to support the role of Fie1 in grain size regulation by testing overexpression (OE) and knockout mutants under heat stress. The OE mutants were either unaltered or had a positive impact on mature grain size under HNT, while the knockouts exhibited significant grain size reduction under these conditions.
Lignin is a key target for modifying lignocellulosic biomass for efficient biofuel production. Brown midrib 12 (Bmr12) encodes the sorghum caffeic acid O-methyltransferase (COMT) and is one of the key enzymes in monolignol biosynthesis. Loss of function mutations in COMT reduces syringyl (S) lignin subunits and improves biofuel conversion rate. Although lignin plays an important role in maintaining cell wall integrity of xylem vessels, physiological and molecular consequences due to loss of COMT on root growth and adaptation to water deficit remain unexplored. We addressed this gap by evaluating the root morphology, anatomy and transcriptome of bmr12 mutant. The mutant had reduced lateral root density (LRD) and altered root anatomy and response to water limitation. The wildtype exhibits similar phenotypes under water stress, suggesting that bmr12 may be in a water deficit responsive state even in well-watered conditions. bmr12 had increased transcript abundance of genes involved in (a)biotic stress response, gibberellic acid (GA) biosynthesis and signaling. We show that bmr12 is more sensitive to exogenous GA application and present evidence for the role of GA in regulating reduced LRD in bmr12. These findings elucidate the phenotypic and molecular consequences of COMT deficiency under optimal and water stress environments in grasses.
Background Recent advances in image-based plant phenotyping have improved our capability to study vegetative stage growth dynamics. However, more complex agronomic traits such as inflorescence architecture (IA), which predominantly contributes to grain crop yield are more challenging to quantify and hence are relatively less explored. Previous efforts to estimate inflorescence-related traits using image-based phenotyping have been limited to destructive end-point measurements. Development of non-destructive inflorescence phenotyping platforms could accelerate the discovery of the phenotypic variation with respect to inflorescence dynamics and mapping of the underlying genes regulating critical yield components. Results The major objective of this study is to evaluate post-fertilization development and growth dynamics of inflorescence at high spatial and temporal resolution in rice. For this, we developed the P anicle I maging Plat form (PI-Plat) to comprehend multi-dimensional features of IA in a non-destructive manner. We used 11 rice genotypes to capture multi-view images of primary panicle on weekly basis after the fertilization. These images were used to reconstruct a 3D point cloud of the panicle, which enabled us to extract digital traits such as voxel count and color intensity. We found that the voxel count of developing panicles is positively correlated with seed number and weight at maturity. The voxel count from developing panicles projected overall volumes that increased during the grain filling phase, wherein quantification of color intensity estimated the rate of panicle maturation. Our 3D based phenotyping solution showed superior performance compared to conventional 2D based approaches. Conclusions For harnessing the potential of the existing genetic resources, we need a comprehensive understanding of the genotype-to-phenotype relationship. Relatively low-cost sequencing platforms have facilitated high-throughput genotyping, while phenotyping, especially for complex traits, has posed major challenges for crop improvement. PI-Plat offers a low cost and high-resolution platform to phenotype inflorescence-related traits using 3D reconstruction-based approach. Further, the non-destructive nature of the platform facilitates analyses of the same panicle at multiple developmental time points, which can be utilized to explore the genetic variation for dynamic inflorescence traits in cereals.
 Hongfeng Yu合作论文数19
 Harkamal Walia合作论文数University of Nebraska–Lincoln13
 Yu Pan合作论文数9
 Tian Gao (高添)合作论文数Chinese Acad Sci, Inst Appl Ecol, Qingyuan Forest CERN8
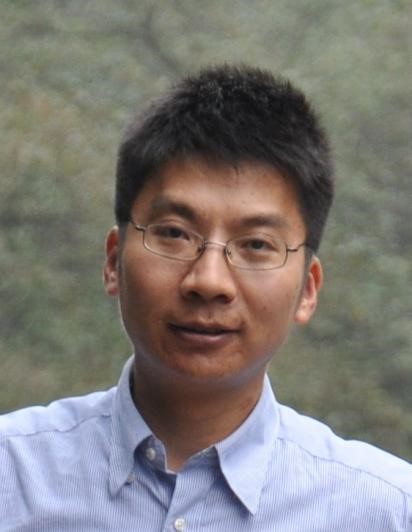 Qijun Zhao (赵启军)合作论文数College of Computer Science, Sichuan University;Tibet University8
 Paul Puneet合作论文数Department of Biosciences, Goethe University6
 Balpreet K Dhatt合作论文数1Department of Agronomy and Horticulture, University of Nebraska-Lincoln5
 Paul E. Staswick合作论文数Department of Agronomy and Horticulture, University of Nebraska–Lincoln5
 Jaspreet S. Sandhu合作论文数Memorial Sloan Kettering Cancer Center;Weill Cornell Medical College5
 Yufeng Ge合作论文数4Kwo-Sen Kuo合作论文数3
 Ruowei Wang合作论文数Sichuan University2Shengling Wen合作论文数2Penghui Gui合作论文数2Larissa Irvin合作论文数Dept Agron & Hort, Univ Nebraska Lincoln2
 Manny Saluja合作论文数Dept Agronom & Horriculture, Univ Nebraska2
 Jieting Wu合作论文数2
 Suresh Thapa合作论文数University of Nebraska-Lincoln2
 Michael L. Rilee合作论文数2Zongjun Wu合作论文数2Bin Zhu合作论文数2Liwen Xing (邢立文)合作论文数2
 Daozhi Gong (龚道枝)合作论文数Institute of Environment and Sustainable Development in Agriculture, Chinese Academy of Agricultural Sciences2
 Morota Gota合作论文数Department of Animal Sciences, University of Wisconsin-Madison2
 Ningbo Cui (崔宁博)合作论文数College of Water Resource & Hydropower, Sichuan University2
 Xi Chen (陈喜)合作论文数School of Earth System Science, Tianjin University2
 Jianxin Sun合作论文数2Scott E. Sattler合作论文数United States Department of Agriculture, University of Nebraska2
 Waseem Hussain合作论文数International Rice Research Institute2Wenjie Dang合作论文数1
 Chenguo Lin (林琛果)合作论文数School of Intelligence Science and Technology, Peking University1Shuiwang Li合作论文数College of Information Science and Engineering, Guilin University of Technology1Quanshan Liu合作论文数1Yuxuan Zha合作论文数1Yanling Li合作论文数1Jaspinder Singh Dharni合作论文数1
 Harel Bacher合作论文数Dept Agron & Hort, Univ Nebraska Lincoln1
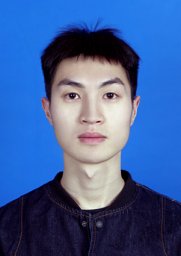 Zongyong Deng合作论文数School of Information Engineering, Ningxia University, Yinchuan, 750021, China1
 Zhengbang Zhu (竺正邦)合作论文数Shanghai Jiao Tong University1
 Mingbo Hong合作论文数Coll Informat & Engn, Sichuan Agr Univ1
 Kan Liu合作论文数Univ Nebraska, Sch Biol Sci, Lincoln, NE 68588 USA1Lina Yu合作论文数University of Nebraska-Lincoln1
 Jun Liu (刘钧)合作论文数四川大学华西口腔医院1
 Distelfeld Assaf合作论文数Dept Mol Biol & Ecol Plants, Tel Aviv Univ1
 Tala Awada合作论文数University of Nebraska1Jianping Zeng合作论文数1Yuchao Yang (杨玉超)合作论文数1
 Maria Arlene Advientoborbe合作论文数1




