Pan-STARRS1 has carried out a set of distinct synoptic imaging sky surveys including the $3π$ Steradian Survey and the Medium Deep Survey in 5 bands ($grizy_{P1}$). The mean 5$σ$ point source limiting sensitivities in the stacked 3$π$ Steradian Survey in $grizy_{P1}$ are (23.3, 23.2, 23.1, 22.3, 21.4) respectively. The upper bound on the systematic uncertainty in the photometric calibration across the sky is 7-12 millimag depending on the bandpass. The systematic uncertainty of the astrometric calibration using the Gaia frame comes from a comparison of the results with Gaia: the standard deviation of the mean and median residuals ($ Δra, Δdec $) are (2.3, 1.7) milliarcsec, and (3.1, 4.8) milliarcsec respectively. The Pan-STARRS system and the design of the PS1 surveys are described and an overview of the resulting image and catalog data products and their basic characteristics are described together with a summary of important results. The images, reduced data products, and derived data products from the Pan-STARRS1 surveys are available to the community from the Mikulski Archive for Space Telescopes (MAST) at STScI.
Aims. We investigate the dynamics of the nebula around the symbiotic star Hen 2–147, determine its expansion parallax, and compare it with the distance obtained via the period–luminosity relation for its Mira variable. Methods. A combination of multi-epoch HST images and VLT integral field high-resolution spectroscopy is used to study the nebular dynamics both along the line of sight and in the plane of the sky. These observations allow us to build a 3D spatio-kinematical model of the nebula, which, together with the measurement of its apparent expansion in the plane of the sky over a period of 3 years, provides the expansion parallax for the nebula. Additionally, SAAO near-infrared photometry obtained over 25 years is used to determine the Mira pulsation period and derive an independent distance estimation via the period–luminosity relationship for Mira variables. Results. The geometry of the nebula is found to be that of a knotty annulus of ionized gas inclined to the plane of sky and expanding with a velocity of ∼90 km s −1 . A straightforward application of the expansion parallax method provides a distance of 1.5 ± 0.4 kpc, which is a factor of two lower than the distance of 3.0 ± 0.4 kpc obtained from the period–luminosity relationship for the Mira (which has a pulsation period of 373 days). The discrepancy is removed if, instead of expanding matter, we are observing the expansion of a shock front in the plane of the sky. This shock interpretation is further supported by the broadening of the nebular emission lines.
We present the characterization of the on-orbit sensitivity of the A CS CCDs cameras. Observations of spectrophotometric standard stars have been used to improve the prelaunch sensitivity and detector quantumefficiency. The new values have been implemented in SYNPHOT which is now able to reproduce the observed count rates to within 0.5% in all broad band filters. For all narrow band filters and two broadband filters (F474W and F606W) a correction factor has been applied to the original filter tr ansmission curve to bring the predicted count rates in agreement with observations. F inally, we calculate the photometric zero points for the WFC and HRC in all thr ee photometric systems used by Synphot, namely VEGAma g, STmag and ABmag.
We have gathered one of the most complete photometric records for the Type Ia supernova (SN Ia) SN 1998aq. Its distance is measured via the multicolor light-curve shape (MLCS) method, a statistical technique to measure distances to supernovae and to account for the inhomogeneity in their luminosities using the shapes of their BVRI light-curves. This method also provides an estimate of the extinction from the host galaxy. The Hubble Space Telescope (HST) Cepheid distance provides an absolute magnitude calibration of this and other local SNe Ia and, in turn, of Hubble flow SNe Ia. Via this process we estimate the Hubble constant.
The verification tests for the ACS Ramp Filter Exposure Time Calculator are presented. Our baseline suite of test cases includes one calculation for all filter modes with the same target, plus one subset for all kinds of targets through the same filter.
The verification tests for the Imaging Exposure Time Calculator for the Advanced Camera for Surveys are presented. Our baseline suite of test cases includes one calculation for all filter modes with the same target, plus one subset for all kinds of targets through the same filter.
The three prisms and the grism in ACS are characterized in terms of the dispersion relations and sensitivity, so that a user can predict count rates and S/N of sources with known flux. These specification should be implemented for point sources in the ACS Exposure Time Calculator (ETC). Since ACS has no entrance slits, spectral resolution is limited by the spatial extent of objects. Introduction The ACS has five objective dispersing modes, as listed in Table 1. Since there are no entrance slits, objects bigger than a few resolution elements will show degraded spectral resolution in the continuum. Table 1. ACS Dispersers Dispersion Relations The linear dispersion for the grism is 40A/px on the WFC and 25A/px on the HRC at field center. The wavelength coverage in first order is from 5500 to 11,000A. Outside this PR110L LiF PRISM SBC PR130L CaF2 PRISM SBC PR200L HRC PRISM HRC G800L GRISM WFC,HRC Copyright© 1999 The Association of Universities for Research in Astronomy, Inc. All Rights Reserved. Instrument Science Report ACS 00-01 range, the sensitivity is only a few percent of the peak throughput at 7000A. Beyond ~11000A, the first order spectrum lies on top of the second order. The dispersions of the three prism modes are defined by meaurements of monochromatic spectra obtained in 1999 May. D. Lindler fit these wavelength vs. pixel (X) data with the usual FOS and STIS dispersion relation: wavelength (Angstroms) = a1 + a2/X + a3/X2 + a4/X3 + a5/X4 where: X = (pixel position a0) The dispersion A/Pixel is: abs( a2/X2 + 2*a3/X3 + 3*a4/X4 + 4*a5/X5 ). For PR110L and PR230L, x is 0 for PR200L. Results are tabulated below. The position of the prism on the detector is determined by the a0 coefficient, which is the pixel position for the long wavelength limit of the spectrum. The choices for a0 in Table 2 represent the dispersion at field center, while the dispersion varies by a total of 6% over the tilted focal plane for the SBC and HRC. The total dispersion variation for G800L on the WFC is 24%. Table 2. Prism Dispersion Coefficients Sensitivity The throughput efficiency of the optical elements have been measured in the lab and are compiled for the dispersers and filters by Z. Tsvetanov at http://adcam.pha.jhu.edu/filters/tables/Master_Table.html. All of the optical elements are entered in the STScI Synphot system (1998), which is used to compute the total system throughput for the combined instrumental and OTA efficiencies as a function of wavelength. The total system sensitivity summed in the cross-dispersion direction but per pixel in the wavelength direction is shown in Figures 1-5 for the five dispersers with a diamond at every pixel. Notice the coarse spacing of the pixels near the long wavelength limits of the three prisms. In particular, PR200L in Figure 3 has little dispersion in the few pixels at the bright head of the LiF PRISM CaF2 PRISM HRC PRISM a0 = 339.33770 354.03448 870.12088 a1 = 1051.6163 1071.7806 1133.2426 a2 = 21150.558 -14967.555 82999.557 a3 = 9237490.7 1947999.0 -828929.38 a4 = 4.9340281e+08 54848094. -4653501.0 a5 = 1.2458532e+10 1.1163562e+09 1.6888817e+08 RMS of fit = 0.18 pixels 0.11 pixels 0.13 pixels
The verification tests for the ACS Ramp Filter Exposure Time Calculator are presented. Our baseline suite of test cases includes one calculation for all filter modes with the same target, plus one subset for all kinds of targets through the same filter.
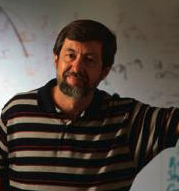 David Branch合作论文数Homer L. Dodge Department of Physics and Astronomy, The University of Oklahoma8
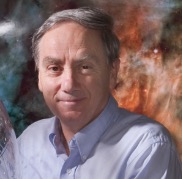 Mario Livio合作论文数Space Telescope Science Institute5
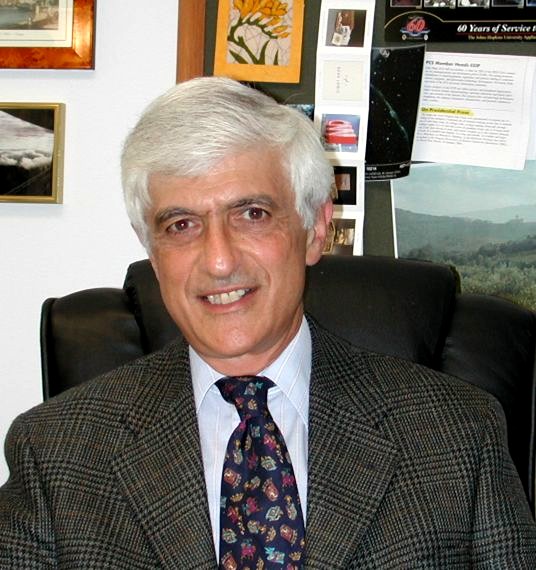 Nino Panagia合作论文数Space Telescope Science Institute/International Center For Relativistic Astrophysics4
 Robert Bohlin合作论文数Fraunhofer-Chalmers Research Centre4
 Bill Sparks合作论文数SETI Institute;Space Telescope Science Institute;University of Hertfordshire4
 f marang合作论文数3John Cowan合作论文数3Christopher R. Eck合作论文数3
 Adam Riess合作论文数William H. Miller III Department of Physics and Astronomy, Krieger School of Arts and Sciences, Johns Hopkins University;Space Telescope Science Institute;National Academy of Sciences3D. van Orsow合作论文数3M. Santander-García合作论文数2F. Macchetto合作论文数2a mampaso合作论文数2
 Anton M. Koekemoer合作论文数Space Telescope Science Institute2Guido De Marchi合作论文数2
 Stefano Casertano合作论文数Space Telescope Science Institute;International Space Science Institute2U. Munari合作论文数Asiago Observatory, University of Padua;National Institute of Astrophysics, Padova2Mark Clampin合作论文数2Duccio Macchetto合作论文数2
 Ralph C. Bohlin合作论文数Space Telescope Science Institute2Colin Cox合作论文数2
 Romano Corradi合作论文数IAC2Cheryl Pavlovsky合作论文数2Sandy Grosvenor合作论文数2Vera Kozhurina-Platais合作论文数2W. M. Wood-Vasey合作论文数1C. Goessl合作论文数1Rae C.合作论文数1ray e kutina合作论文数1T. Goggia合作论文数1S. Chastel合作论文数1B. Shiao合作论文数1K. C. Sahu合作论文数1s watters合作论文数1ML HAZEN合作论文数1sidik isani合作论文数1L. Strolger合作论文数1peter m onaka合作论文数1D. N. A. Murphy合作论文数1W-H Ip合作论文数1Anuradha Korathkar合作论文数1H. C. Ferguson合作论文数1k m smith合作论文数1N. Primak合作论文数1M. E. Huber合作论文数1S. Seitz合作论文数1Peder Norberg合作论文数1N. Metcalfe合作论文数1




