Meta-analysis refers to a collection of methods for combining quantitative information from several sources to give a summary statistic together with its uncertainties. The results strengthen our knowledge beyond that contributed even by multiple single studies and may guide diagnosis and treatment of patients and point toward future research. We illustrate the variety of topics, methods, and statistical techniques through closer scrutiny of a few meta-analyses published during 1989. The many statistical methods for combining data take different forms, and they are based upon different assumptions. We explain the importance, and review the reporting, of eight attributes of meta-analysis: methods of searching, ehgibility criteria, number of articles, outcome variables, study design, results used for combining, homogeneity, and statistical methods. These items may help the reader evaluate a meta-analysis.
This chapter provides advice, with examples, on writing about numbers in the biomedical literature. It discusses the allocation of numbers, provides advice on issues that arise more often in the text, presents a few suggestions about numbers in tables, and deals with some remarks about symbols. Some journals and other sources of advice to writers have a rule that numbers smaller than 10 should be written out in words and larger ones should be given in Arabic numerals. Although scientific journals encourage precise writing, numbers with many distinct digits can lose readers in details when what may be needed primarily is a grasp of the magnitude. Although some manuals of style go into detail about handling numbers in the text, the rules have many exceptions. Some manuals are oriented more toward the humanities or journalistic writing than toward scientific or technical writing.
A healthy young woman accidentally slashed her wrists on a broken windowpane and was rushed to the hospital. Surgery was performed using the anesthetic halothane with results that led everyone to believe that the outcome of the treatment was satisfactory, but a few days later the patient died. The cause was traced to massive hepatic necrosis—so many of her liver cells died that life could not be sustained. Such outcomes are very rare, especially in healthy young people. We members of the general public can take great comfort from the medical profession’s attitude toward mysterious deaths in benign circumstances. Physicians hate them. One night I sat beside a famous surgeon and heard an anthropologist brilliantly describe the power of a witch doctor’s spell to cause the lingering painful death of a tribesman who had offended another. My surgeon friend interrupted this moving story to ask grumpily, “Who performed the autopsy?” He did not gracefully accept the storyteller’s reassurance that no autopsy was necessary, because nothing but the spell had been cast. Among students of modern magic who were present, faint doubts also swirled.
In the 1950s and 1960s in the United States, social research had made considerable progress in the ability to study questions relevant to policy. Most such work had been done in economics. Advances in computers, research on sample surveys, and experience in studying complex questions provided a base for understanding strong investigations. One such strong investigation was the study made by James Coleman and colleagues, the central theme of this chapter.
One of the lucky moments in my life occurred in August 1955, when I became acquainted with Robert E. K. Rourke, who served with me and others on the Commission on Mathematics of the College Entrance Examination Board under the chairmanship of Professor Albert Tucker of the Department of Mathematics of Princeton University.1 The Commission was preparing innovative material for the secondary-school mathematics curriculum. The reason was that the College Entrance Examination Board was sensitive to the criticism that standardized examinations tended to freeze the mathematics curriculum of the schools. The Board did not want to be a roadblock in the path of progress. Rourke was head of mathematics and science at the Kent School in Kent, Connecticut.
How can one persuade an old university to create a new department? Universities are usually organized along disciplinary lines, but at Harvard and many others, statistics has been an exception. Before 1946, few universities in the United States had departments of statistics. When I came to Harvard, statistics, just as today, was taught in various departments throughout the University. Let me list a few teachers and places in 1946: William Leonard Crum and Edwin Frickey in Economics; Saunders MacLane in Mathematics; Richard von Mises in Applied Mathematics; Harold Thomas, Jr., in Engineering (his father had taught me engineering drawing at Carnegie when I was a freshman); Truman Kelley, David Tiedeman, and others in the Graduate School of Education; and Hugo Muench in the Department of Biostatistics, which he chaired beginning in 1947; I taught mathematical statistics for the Department of Mathematics and quantitative methods for Social Relations. The list could readily be lengthened.
At Carnegie, working with E. G. Olds, I had a small taste of research, partly from my work for Olds and partly from my master’s thesis written with him. Still these did not do much to prepare me for research later. At Princeton, Wilks’s idea was that his students should produce a research paper early on to get them into the swing of such things and also to put Wilks himself in the position of being able to prove to the mathematics faculty, when the question of advancing to the doctoral dissertation came up, that the student could do publishable research. He proposed that I examine the distribution of runs above and below the mean.
Examples of Quantitative Studies.- Why Did Dewey Beat Truman in the Pre-election Polls of 1948?.- Sexual Behavior in the United States: The Kinsey Report.- Learning Theory: Founding Mathematical Psychology.- Who Wrote the Disputed Federalist Papers, Hamilton or Madison?.- The Safety of Anesthetics: The National Halothane Study.- Equality of Educational Opportunity: The Coleman Report.- Early Life and Education.- Childhood.- Secondary School.- Carnegie Institute of Technology.- Graduate Schools: Carnegie and Princeton.- Magic.- Beginning Research.- Completing the Doctorate.- Coming to Harvard University.- Organizing Statistics.- Continuing Activities.- Evaluation.- Teaching.- Group Writing.- The Cape.- Biostatistics.- Health Policy and Management.- Health Science Policy.- Editors#x2019 Epilogue.
The manuscript that we inherited went only to around 1990—just before Fred “officially retired” from teaching and administration in 1992. Virginia Mosteller became seriously ill after he completed that draft; she died in 2001. Fred maintained an office in the Department of Statistics at Harvard, and he remained active, even tackling important new projects. He continued to live in the house in Belmont, though he suffered a serious fall in 2002. In January 2004 he moved to Arlington, Virginia, to be near his children and grandson, but he continued to work on multiple projects. Many of his friends and colleagues had occasion to visit with Fred after his move. He died, after an extended illness, on July 23, 2006.
When I worked at the Office of Public Opinion Research with the social psychologist Hadley Cantril, beginning in 1940, I got to know Frederick Williams, a political scientist. He and I collaborated on some articles in the study of public opinion that appeared in a book edited by Hadley Cantril. One day in 1941, Fred said, “Have you thought about the problem of the authorship of the disputed Federalist papers?” I didn’t know there were Federalist papers, much less that both Hamilton and Madison had claimed authorship of some of them. I had attended an engineering school where very little classical literature was taught at the time. I had, however, been reading in the statistical journal Biometrika articles by G. Udny Yule and by C. B. Williams (a different Williams) on the resolution of some disputes about authorship.
 John Tukey合作论文数Princeton University16
 Joseph Lau合作论文数Center for Evidence Synthesis in Health, School of Public Health, Brown University15
 Robert R. Bush合作论文数14Bucknam Mcpeek合作论文数14david l wallace合作论文数13TC CHALMERS合作论文数12
 Graham A. Colditz合作论文数Division of Public Health Sciences, Department of Surgery, School of Medicine, Washington University in St. Louis12
 David C Hoaglin合作论文数Department of Population and Quantitative Health Sciences, University of Massachusetts Medical School11John D. Emerson合作论文数7B Kupelnick合作论文数7
 Catherine S Berkey合作论文数Department of Medicine, Harvard Medical School7
 Stephen E. Fienberg合作论文数Carnegie Mellon University7Elisabeth Burdick合作论文数7Robert E. K. Rourke合作论文数6
 Miech Edward J合作论文数HSR, VA;D Center on Implementing Evidence-Based Practice, Roudebush VA Medical Center;VA HSR&D Center on Implementing Evidence-Based Practice, Roudebush VA Medical Center6
 Richard J. Light合作论文数Harvard Kennedy School, Harvard University6
 Elliott Marshall Antman合作论文数Brigham and Women's Hospital;Harvard Medical School;Boston Biomedical Innovation Center6Thomas C Chalmers合作论文数MetaWorks6Bill Nave合作论文数6Italo F Angelillo合作论文数6j p bunker合作论文数5C Youtz合作论文数5Ballantyne Jane C合作论文数5
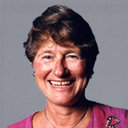 Judith M. Tanur合作论文数University of California5William B. Fairley合作论文数4HS FRAZIER合作论文数4john c bailar合作论文数4Jp Gilbert合作论文数4W. H. Forrest合作论文数4W Kruskal合作论文数UNIV CHICAGO,DEPT STAT,CHICAGO,IL 60637, USA4
 Daniel B. Carr合作论文数Departments of Anesthesia and Medicine, School of Medicine, Tufts University;Department of Public Health and Community Medicine, Tufts Medical Center4Martin F Mckneally合作论文数4Alexia Antczak-Bouckoms合作论文数4Yvonne Bishop合作论文数4H. V. Fineberg合作论文数3George B. Thomas合作论文数3philip j mccarthy合作论文数3Tc Chalmers合作论文数3
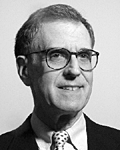 David C. Hoaglin合作论文数3Daniel B Carr合作论文数3
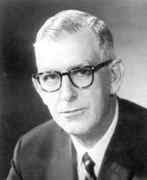 William G. Cochran合作论文数Harvard University3S Klawansky合作论文数3Catherine Berkey合作论文数3L VECCHIARELLI合作论文数2J D Emerson合作论文数2rodney s earle合作论文数2John P. Gilbert合作论文数2d l wallace合作论文数2




