This paper proposes a new method to detect changepoints in the location and scale of univariate data sequences. The proposed method assumes that the data belong to the location‐scale family of distributions and estimate the associated densities nonparametrically. Specifically, the approach does not require knowledge of the functional form of the distribution of the data sequence. As such, the approach can detect changepoints in many distributions. We also propose a new method to detect changes in the location of multivariate sequences, using the marginals and a copula to capture the dependence between variables without the influence of marginal distributions. The performance of the proposed semiparametric approach is contrasted against both other competing nonparametric and Gaussian methods, via simulation studies, as well as applications arising from health and finance.
Nowadays, multivariate functional data are frequently observed in many scientific fields, and the estimation of quantiles of these data is essential in data analysis. Unlike in the univariate setting, quantiles are more challenging to estimate for multivariate data, let alone multivariate functional data. This article proposes a new method to estimate the quantiles for multivariate functional data with application to air pollution data. The proposed multivariate functional quantile model is a nonparametric, time-varying coefficient model, and basis functions are used for the estimation and prediction. The estimated quantile contours can account for non-Gaussian and even nonconvex features of the multivariate distributions marginally, and the estimated multivariate quantile function is a continuous function of time for a fixed quantile level. Computationally, the proposed method is shown to be efficient for both bivariate and trivariate functional data. The monotonicity, uniqueness, and consistency of the estimated multivariate quantile function have been established. The proposed method was demonstrated on bivariate and trivariate functional data in the simulation studies, and was applied to study the joint distribution of PM2.5 and geopotential height over time in the Northeastern United States; the estimated contours highlight the nonconvex features of the joint distribution, and the functional quantile curves capture the dynamic change across time.
In spatial statistics, the kriging predictor is the best linear predictor at unsampled locations, but not the optimal predictor for non-Gaussian processes. In this paper, we introduce a copula-based multiple indicator kriging model for the analysis of non-Gaussian spatial data by thresholding the spatial observations at a given set of quantile values. The proposed copula model allows for flexible marginal distributions while modeling the spatial dependence via copulas. We show that the covariances required by kriging have a direct link to the chosen copula function. We then develop a semiparametric estimation procedure. The proposed method provides the entire predictive distribution function at a new location, and thus allows for both point and interval predictions. The proposed method demonstrates better predictive performance than the commonly used variogram approach and Gaussian kriging in the simulation studies. We illustrate our methods on precipitation data in Spain during November 2019, and heavy metal dataset in topsoil along the river Meuse, and obtain probability exceedance maps.
The global radiosonde archives contain valuable weather data, such as temperature, humidity, wind speed, wind direction, and atmospheric pressure. Being the only direct measurement of these variables in the upper air, they are prone to errors. Therefore, a robust analysis and outlier detection of radiosonde data is essential. Among all the variables, the radiosonde winds, which consist of wind speed and direction, are particularly challenging to analyze. In this article, we treat the wind profiles as bivariate functional data across several pressure levels. Since the bivariate distribution of the components of radiosonde winds at a given pressure level is not Gaussian but instead skewed and heavy-tailed, we propose a set of robust quantile methods to characterize the distribution as well as an outlier detection procedure to identify both magnitude and shape outliers. The proposed methods provide an informative visualization tool for bivariate functional data. We also introduce two methods of predicting this bivariate distribution at unobserved pressure levels. In our simulation study, we show that our methods are robust against different types of outliers and skewed data. Finally, we apply our methods to radiosonde wind data to illustrate our proposed quantile analysis methods for visualization, outlier detection, and prediction.
Background In plant science, the study of salinity tolerance is crucial to improving plant growth and productivity under saline conditions. Since quantile regression is a more robust, comprehensive and flexible method of statistical analysis than the commonly used mean regression methods, we applied a set of quantile analysis methods to barley field data. We use univariate and bivariate quantile analysis methods to study the effect of plant traits on yield and salinity tolerance at different quantiles. Results We evaluate the performance of barley accessions under fresh and saline water using quantile regression with covariates such as flowering time, ear number per plant, and grain number per ear. We identify the traits affecting the accessions with high yields, such as late flowering time has a negative impact on yield. Salinity tolerance indices evaluate plant performance under saline conditions relative to control conditions, so we identify the traits affecting the accessions with high values of indices using quantile regression. It was observed that an increase in ear number per plant and grain number per ear in saline conditions increases the salinity tolerance of plants. In the case of grain number per ear, the rate of increase being higher for plants with high yield than plants with average yield. Bivariate quantile analysis methods were used to link the salinity tolerance index with plant traits, and it was observed that the index remains stable for earlier flowering times but declines as the flowering time decreases. Conclusions This analysis has revealed new dimensions of plant responses to salinity that could be relevant to salinity tolerance. Use of univariate quantile analyses for quantifying yield under both conditions facilitates the identification of traits affecting salinity tolerance and is more informative than mean regression. The bivariate quantile analyses allow linking plant traits to salinity tolerance index directly by predicting the joint distribution of yield and it also allows a nonlinear relationship between the yield and plant traits.
Modern phenotyping techniques yield vast amounts of data that are challenging to manage and analyze. When thoroughly examined, this type of data can reveal genotype-to-phenotype relationships and meaningful connections among individual traits. However, efficient data mining is challenging for experimental biologists with limited training in curating, integrating, and exploring complex datasets. Additionally, data transparency, accessibility, and reproducibility are important considerations for scientific publication. The need for a streamlined, user-friendly pipeline for advanced phenotypic data analysis is pressing. In this article we present an open-source, online platform for multivariate analysis (MVApp), which serves as an interactive pipeline for data curation, in-depth analysis, and customized visualization. MVApp builds on the available R-packages and adds extra functionalities to enhance the interpretability of the results. The modular design of the MVApp allows for flexible analysis of various data structures and includes tools underexplored in phenotypic data analysis, such as clustering and quantile regression. MVApp aims to enhance findable, accessible, interoperable, and reproducible data transparency, streamline data curation and analysis, and increase statistical literacy among the scientific community.
 Ying Sun合作论文数Computer, Electrical and Mathematical Science and Engineering Division. King Abdullah University of Science and Technology4
 Stephanie Saade合作论文数2
 Mark Tester合作论文数Center of Excellence for Sustainable Food Security, Biological and Environmental Science and Engineering Division, King Abdullah University of Science and Technology;Center for Desert Agriculture, King Abdullah University of Science and Technology;The Salt Lab, King Abdullah University of Science and Technology2
 Huixia Wang合作论文数1
 Mohammad Shahid合作论文数1Mitchell J. L. Morton合作论文数Biological and Environmental Science and Engineering (BESE) Division, King Abdullah University of Science and Technology (KAUST),1
 Mariam Awlia合作论文数Div Biol & Environm Sci & Engn BESE, King Abdullah Univ Sci & Technol KAUST1
 Yveline Pailles合作论文数Biol & Environm Sci & Engn Div BESE, King Abdullah Univ Sci & Technol KAUST1Wei Tu合作论文数1
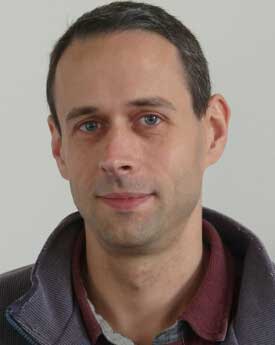 Paul Fearnhead合作论文数School of Mathematical Sciences, Fylde College, Lancaster University1
 Magdalena M Julkowska合作论文数Swammerdam Institute for Life Sciences, University of Amsterdam1
 Idris Eckley合作论文数School of Mathematical Sciences, Lancaster University;Department of Mathematics and Statistics, Lancaster University1
 Linglong Kong合作论文数Department of Mathematical and Statistical Sciences, Faculty of Science, University of Alberta1




