In today’s globally networked world, people are facing dramatically increasing complexity. Part of this complexity is due to the rapidly growing amount of information that is becoming available online. Because knowing more usually leads to better decisions than knowing less (even if the “less” seems clearer and more definite), complex problems require a complex analysis (Davenport & Prusak, 1997), i.e., being aware of the multitude of relevant information available for the decision process, and being able to select the right pieces of information from this multitude. Despite the fact that dealing with complexity is one of the strengths of the human mind, because of the current inflation of information there is a growing need for tools that intelligently assist people in handling complexity.
Tissue Phenomics is the discipline of mining tissue images to identify patterns that are related to clinical outcome providing potential prognostic and predictive value. This involves the discovery process from assay development, image analysis, and data mining to the final interpretation and validation of the findings. Importantly, this process is not linear but allows backward steps and optimization loops over multiple sub-processes. We provide a detailed description of the Tissue Phenomics methodology while exemplifying each step on the application of prostate cancer recurrence prediction. In particular, we automatically identified tissue-based biomarkers having significant prognostic value for low- and intermediate-risk prostate cancer patients (Gleason scores 6-7b) after radical prostatectomy. We found that promising phenes were related to CD8(+) and CD68(+) cells in the microenvironment of cancerous glands in combination with the local micro-vascularization. Recurrence prediction based on the selected phenes yielded accuracies up to 83% thereby clearly outperforming prediction based on the Gleason score. Moreover, we compared different machine learning algorithms to combine the most relevant phenes resulting in increased accuracies of 88% for tumor progression prediction. These findings will be of potential use for future prognostic tests for prostate cancer patients and provide a proof-of-principle of the Tissue Phenomics approach.
The automatic analysis of whole slide images (WSIs) of stained histopathology tissue sections plays a crucial role in the discovery of predictive biomarkers in the field on immuno-oncology by enabling the quantification of the phenotypic information contained in the tissue sections. The automatic detection of cells and nuclei, while being one of the major steps of such analysis, remains a difficult problem because of the low visual differentiation of high pleomorphic and densely cluttered objects and of the diversity of tissue appearance between slides. The key idea of this work is to take advantage of well-differentiated objects in each slide to learn about the appearance of the tissue and in particular about the appearance of low-differentiated objects. We detect well-differentiated objects on a automatically selected set of representative regions, learn slide-specific visual context models, and finally use the resulting posterior maps to perform the final detection steps on the whole slide. The accuracy of the method is demonstrated against manual annotations on a set of differently stained images.
Classifying whole-slide images of prostate cancer resections to derive an accurate prognosis for tumor progression is a highly challenging problem. We here introduce a novel type of high-level features which operate on the gland level for the application in computer-aided prognosis using a Tissue Phenomics approach. Since tissue architecture, and in particular, the gland distribution possibly provide information on the aggressiveness of the individual tumor, our features exploit the spatial relationship of different gland types. Glands are classified into cancerous and healthy glands, and also, into morphological classes based on size and shape. Co-occurrences of the classified glands are quantified and Haralick-like features are computed based on the derived gland co-occurrence matrices. The resulting gland co-occurrence features are mined to automatically determine the best parametrization. In experiments on whole-slide images it turned out that our novel features allow accurate stratification of patients into the prognostic groups tumor progression and nonprogression outperforming clinical features. Our results indicate a strong correlation of tumor progression with invasion phenotypes.
Digital pathology enables applications that are not possible using traditional microscopy and facilitates new ways of handling and presenting whole slide image data, along with quantitative evaluation. Differently stained tissue, highlighting specific biological functions, contains a vast amount of spatial information that must be interpreted by a pathologist. With automated image analysis, some of this information can be quantified and made available for computations such as stain expression analysis. In this contribution we present an automated work-flow where quantitative image analysis results of consecutive, differently stained tissue sections are locally fused by co-registration. The results are spatially resolved feature vectors containing features like the densities of positively marked cell types for different stains, which are - in this sense - hyperspectral. Heat maps with many layers (hyperspectral) are generated from this data, revealing relationships between different stains that would not be evident from single stains alone. These hyperspectral data are also a starting point for further investigations; in supporting biomarker discovery in oncology, a systematic search for properties that correlate with clinical data for a patient cohort can be performed in an highly automated way.
A new analytical technique, with unique advantages over existing molecular sensing methods, would allow the ultrasensitive and selective characterization of biomolecular interactions on a chip.
The routine use of digital pathology by clinicians is just beginning to grow rapidly. This adoption will be accelerated by new software applications that increase pathologists’ productivity and quality of work. Increasingly specific stains are available to better diagnose diseases such as cancer. Pathologists are confronted with growing complexity when correlating images from differently stained tissue sections. Here traditional microscopy, which generally allows local viewing of only one image at a time, reaches its limits. Digital pathology can offer tools to facilitate such tasks when assessing complex cases. In this contribution we present a visualization and navigation platform prototype. The basic viewing functions are implemented in a style analogous to Google Maps. The principles of meaningful navigation, however, are based on two sophisticated image analysis types. Firstly, the user interface is designed to intuitively handle panels of automatically co-registered whole-slide images; secondly, heat maps – the result of quantitative image analysis – help the user to quickly navigate to the relevant regions. Under the assumption that the general image analysis challenges can be met robustly, this prototype was used to collect feedback from more than ten pathologists and to analyze how they operated the system. These results are the basis for product development requirements for clinical pathology applications.
 guenter schmidt合作论文数46Michel Despont合作论文数IBM Research Division, Zurich Research Laboratory31
 Peter Vettiger合作论文数IBM Zurich Research Laboratory31
 M. Athelogou合作论文数29
 Walter Haberle合作论文数24
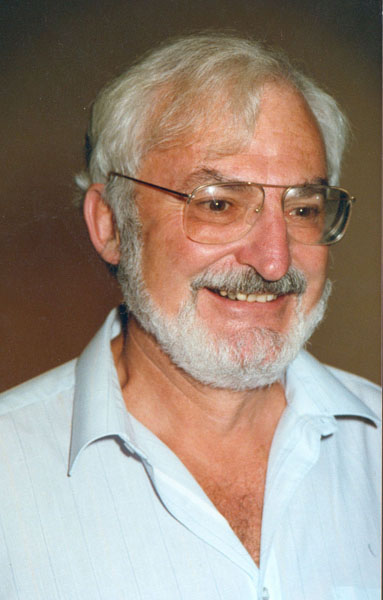 Heinrich Rohrer (海因里希·罗雷尔)合作论文数IBM Zurich Reserach Laboratory22H. Rohrer合作论文数19hugo e rothuizen合作论文数17U Drechsler合作论文数17
 Walter Haeberle合作论文数17
 Christoph Gerber合作论文数Department of Physics, University of Basel17
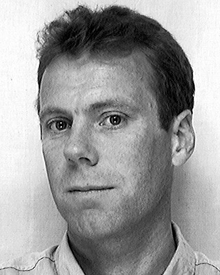 Durig Urs合作论文数16Martin Baatz合作论文数16R. Stutz合作论文数14D. E. SMITH合作论文数12
 Ralf Schonmeyer合作论文数12
 Urs Duerig合作论文数10
 Mark A. Lantz合作论文数Zurich Research Laboratory, IBM Research10
 Evangelos Eleftheriou合作论文数Axelera AI10arno schaepe合作论文数9
 Jürgen Brugger合作论文数Institute of Microengineering, École Polytechnique Fédérale de Lausanne9
 Roland Widmer合作论文数8M Lutwyche合作论文数7H Eckhardt Hoenig合作论文数7MI Lutwyche合作论文数6
 William P. King合作论文数Department of Biomedical and Translational Sciences, Carle Illinois College of Medicine, University of Illinois at Urbana-Champaign;Department of Mechanical Science and Engineering, Grainger College of Engineering, University of Illinois at Urbana-Champaign;Department of Electrical and Computer Engineering, University of Illinois at Urbana-Champaign;Department of Materials Science and Engineering, University of Illinois at Urbana-Champaign;SyBridge Technologies;EDM Intelligent Solutions6
 Kenneth Goodson合作论文数Department of Mechanical Engineering, School of Engineering, Stanford University6
 Harald Fuchs (哈罗德·富克斯)合作论文数Physical Institute, University of Münster;Center of Nanotechnology, University of Münster;Institute of Nanotechnology, Karlsruhe Insitute of Technology6Jürgen Klenk合作论文数6
 Thomas Kenny合作论文数Mechanical Engineering Department, School of Engineering, Stanford University6
 Graham L. W. Cross合作论文数Trinity Nanoscience Laboratory;Trinity College;Trinity Nanoscience Laboratory, Trinity College6J. K. H. Hörber合作论文数6
 Nicolas Brieu合作论文数Département de génie électrique, École Polytechnique de Montréal6
 Haris Pozidis合作论文数IBM Research - Zurich6
 Giovanni Cherubini合作论文数Radiation Laboratories6p bachtold合作论文数5A Baratoff合作论文数5F. Salvan合作论文数5
 Bernd Gotsmann合作论文数IBM Research5
 Alexis Baratoff合作论文数Departement Physik, Philosophisch-Naturwissenschaftliche Fakultät, University of Basel5Arno Schäpe合作论文数5owen feehan合作论文数4t loeliger合作论文数4
 Wolfgang M. Heckl合作论文数School of Education, Technische Universität München4
 Cherubini Giovanni合作论文数IBM Research4F. Ohnesorge合作论文数4Erich P Stoll合作论文数4Harald Hessel合作论文数4




