Introduction Habitat disturbance is a major driver of population declines of woodland caribou in Canada. Habitat restoration is a critical component of a successful, long-term approach to caribou recovery; however, with limited resources, it is important to target areas where restoration efforts will provide maximum benefits to caribou. An increasingly severe fire regime in Canada threatens to re-disturb recently restored areas, limiting their efficacy.Objectives In this study, we evaluate which caribou herd ranges have the highest concentration of high-priority restoration areas and how incorporating burn probability changes priority areas.Methods We apply spatially explicit, Landsat-based maps of forest condition, structure, disturbance, and burn probability to a restoration prioritization framework. We evaluate restoration priority both with and without burn probability.Results We found that incorporating burn probability into restoration prioritization changed the relative ranking of 22% of restoration units considered. For some herds, the concentration of high-priority areas changed dramatically, with the Calendar herd dropping from 49% of restoration units being classified as high priority when not considering burn probability to just 25% when considering burn probability.Conclusion Our findings highlight how disturbance probability can be incorporated when determining areas for restoration and demonstrate how medium-resolution satellite data products can be utilized to inform habitat restoration priorities.
Climate change poses a significant global threat, requiring rapid and effective mitigation strategies to limit future warming. Tree planting is a commonly proposed and readily implementable natural climate solution. It is also a vital component of habitat restoration for the threatened woodland caribou ( Rangifer tarandus) . There is potential for the goals of caribou conservation and carbon sequestration to be combined for co-benefits. We examine this opportunity by estimating the carbon sequestration impacts of tree planting in woodland caribou range in British Columbia (BC), Canada. To do so, we couple Landsat-derived datasets with Physiological Processes Predicting Growth, a process-based model of forest growth. We compare the sequestration impacts of planting informed by woodland caribou habitat needs to planting for maximum carbon sequestration under multiple future climate scenarios including shared socio‐economic pathways (SSP) 2, representing ∼2.7 °C warming, and SSP5, representing ∼4.4 °C warming. Trees were modelled as planted in 2025. Province-wide by 2100, planting for maximum-carbon sequestration averaged 1062 Mg CO _2 · ha ^−1 planted, while planting for caribou habitat resulted in an average of 930 Mg CO _2 · ha ^−1 planted, a reduction of 12%. We found that relative sequestration between herds remained similar across warming scenarios and that, for most ecotypes, sequestration increased from 5% to 7% between the coldest (∼2.7 °C warming) and warmest (∼4.4 °C warming) scenario. Variability in the relative sequestration impacts of planting strategies was observed between herds, highlighting the importance of spatially-explicit, herd-level analysis of future forest growth when planning restoration activities. Our findings indicate a large potential for co-benefits between carbon sequestration and woodland caribou habitat restoration across BC in all warming scenarios modelled. They also underscore the value of process-based forest growth models in evaluating the carbon implications of tree planting and habitat restoration across large areas under a changing climate.
Habitat disturbance is a major driver of the decline of woodland caribou ( Rangifer tarandus caribou ) in Canada. Different disturbance agents and regimes negatively impact caribou populations to different degrees. It is therefore critical that land managers and scientists studying caribou have a detailed understanding of the disturbance regimes affecting caribou habitat. In this work we use recent advances in satellite-based disturbance detection to quantify polygonal forest disturbance regimes affecting caribou ecotypes and herds in British Columbia (BC) from 1985 to 2019. Additionally, we utilize this data to investigate harvesting rates since the implementation of the Species at Risk Act (SARA) and publication of recovery strategies for caribou in BC. Southern Mountain caribou herds are the most threatened yet experienced the highest rates of disturbance, with 22.75% of forested habitat within their ranges disturbed during the study period. Over the study period, we found that in total, 16.4% of forested area was disturbed across all caribou herd ranges. Our findings indicate that caribou in BC face high, and in many cases increasing, levels of habitat disturbance. Our results provide a detailed understanding of the polygonal disturbance regimes affecting caribou in BC at the herd scale, and highlight the need for effective implementation of policies aimed at preserving caribou habitat.
AimThere is widespread support that species richness increases with the available energy of an ecosystem, but the mechanisms underlying this driver of biodiversity patterns remain elusive. We evaluated gradients of functional diversity to test whether the higher species richness of productive, structurally diverse environments is due to a greater range of niches being supported by the abiotic conditions present (environmental filtering), greater availability of biotic resource and habitat niches (more niches) or increasing functional similarity of species (niche packing).LocationAustralia.TaxonBirds and mammals.MethodsWe used structural equation modelling to evaluate the relative contributions of climatic harshness (actual evapotranspiration, AET) and the availability of resource (gross primary productivity, GPP) and habitat (tree height) niches on taxonomic richness and functional richness, dispersion and evenness. We performed parallel analyses within 15 bioclimatic zones and continentally to evaluate the scaling of biodiversity gradients and the shifting balance between niche-based mechanisms along environmental gradients.ResultsAll continental diversity gradients were primarily associated with energy variables, but while species richness of both taxa and all functional diversity measures of bird assemblages increased with AET, mammal functional diversity was more strongly associated with GPP gradients. Results were more variable at the regional scale, but species richness gradients along tree height (birds and mammals) and GPP (mammals) within bioclimatic zones tended not to be paralleled by increases in functional richness or dispersion.Main ConclusionsThe niche-based explanations of biodiversity gradients varied in importance with scale, position on environmental gradients and taxonomic group. At the continental extent, bird biodiversity gradients were structured by environmental filtering by climatic harshness, while mammal biodiversity was related to the increasing availability of resource niches with increasing productivity. Niche packing was more prominent at the regional scale, especially in bioclimatic zones where productivity and vegetation height were less limiting, and in mammal assemblages, suggesting that biodiversity patterns scale differently for birds and mammals.
Abstract For various temperate ungulate species, recent research has highlighted the potential for spring vegetation phenology (“green‐up”) to influence individual condition, with purported benefits to population productivity. However, few studies have been able to measure the benefit on vital rates directly, and fewer still have investigated the comparative influence of other phenological periods on ungulate vital rates. In this study, we tracked phenological changes throughout the duration of the growing season and examined how their timing affected the probability of pregnancy in an ungulate population. We did this for elk (Cervus canadensis) across the Greater Yellowstone Ecosystem (GYE) by sampling 1106 adult females in winter at 25 sites over a 13‐year period and assessing sources of variation in pregnancy using a Bayesian hierarchical model. Pregnancy rates were generally high across the GYE (82.4%), and the primary influences on probability of pregnancy were the timing of vegetation senescence (“brown‐down”) in autumn and exposure to the reproductive disease brucellosis. Earlier forage brown‐down in fall negatively influenced the probability of pregnancy of elk aged 6–9 years by an estimated 17.2% within the range (ca. 32 days) of observed brown‐down end dates. While summer habitat quality has been inferred to influence elk pregnancy previously, our findings specify the key influence of foraging conditions later in the seasonal cycle, immediately before the breeding season. The reproductive disease brucellosis was also an important factor, reducing the probability of pregnancy by 12.4% in elk in the 6‐ to 9‐year age class. Because pregnancy was tested before most disease‐induced abortions occur, the apparent mechanism for this effect is a prolonged reduction in fertility beyond the period of initial exposure in which fetal mortality is typically expected. Our results prompt greater scrutiny of the combined effects of late‐season phenology and disease on reproductive rates and population productivity in temperate ungulates.
Understanding biodiversity pressures associated with recreation and tourism is a major challenge for conservation planning and landscape management. While estimates of landscape use are often collected using mechanisms such as park entry fees and traffic density estimates, these data do not provide substantial detail about the spatial location or intensity of recreation and tourism across biodiversity management areas. To better predict patterns of recreation and tourism likelihood to support conservation planning, we used social network data from Facebook(()(TM)()), Flickr(()(TM)()), Google(()(TM)()), Strava(()(TM)()), and Wikilocs(()(TM)()) along with a suite of remote-sensing-derived environmental covariates in a maximum entropy (MaxEnt) presence-only modelling framework. Social network samples were compiled and processed to reduce sampling bias and spatial autocorrelation. Road access, climate data, and remote sensing covariates describing vegetation greenness, disturbance, topography, and moisture were used as predictor variables in the MaxEnt modelling framework. Our focus site was a grizzly bear (Ursus arctos) management area in west-central Alberta, Canada. Individual models were developed for each social network dataset, as well as a combined model including all the samples. Mean cross-validated AUC, partial ROC, and true skill statistics (TSS) were used to evaluate model accuracy. Results indicated that the covariates proposed were able to best model Strava and Wikilocs activity (TSS = 0.69 and 0.50, respectively), while samples from Flickr or the combination of all social networks were least accurate (TSS = 0.32). The "access" covariate was most important for MaxEnt training gain across a number of social network models, highlighting the importance of access for recreation and tourism likelihood. The summer heat moisture index and normalized burn ratio were also useful spatial covariates in many predictions. Recreation and tourism likelihood maps were combined with grizzly bear telemetry data to examine how recreation and tourism may affect grizzly bear behaviour. All social network models found a similar influence on grizzly bear behaviour, with increasing recreation and tourism use resulting in decreased foraging behaviour and increased rapid movement, suggesting that the models developed here are useful tools for predicting grizzly bear behaviour and planning conservation strategies for the species.
Changing climates are altering wildlife habitats and wildlife behavior in complex ways. Here, we examine how changing spring snow cover dynamics and early season forage availability are altering grizzly bear (Ursus arctos) behavior postden emergence. Telemetry data were used to identify spring activity dates for 48 individuals in the Yellowhead region of Alberta, Canada. Spring activity date was related to snow cover dynamics using a daily percent snow cover dataset. Snow melt end date, melt rate, and melt consistency explained 45% of the variation in spring activity date. We applied this activity date model across the entire Yellowhead region from 2000 to 2016 using simulated grizzly bear home ranges. Predicted spring activity date was then compared with a daily spring forage availability date dataset, resulting in "wait time" estimates for four key early season forage species. Temporal changes in both spring activity date and early season forage "wait times" were assessed using non-parametric regression. Grizzly bear activity date was found to have either remained constant (95%) or become earlier (5%) across the study area; virtually no areas with significantly later spring activity dates were detected. Similarly, the majority of "wait times" did not change (85%); however, the majority of significant changes in "wait times" for the four early season forage species indicated that "wait times" were lessening where changes were detected. Our results show that spring activity date is largely dictated by snow melt characteristics and that changing snow melt conditions may result in earlier spring activity. However, early season food stress conditions are likely to remain unchanged or improve as vegetation phenology also becomes earlier. Our findings extend the recent work examining animal movement in response to changing phenology from migratory birds and ungulates to an apex predator, further demonstrating the potential effects of changing climates on wildlife species.
Migration is an effective behavioral strategy for prolonging access to seasonal resources and may be a resilient strategy for ungulates experiencing changing climatic conditions. In the Greater Yellowstone Ecosystem (GYE), elk are the primary ungulate, with approximately 20,000 individuals migrating to exploit seasonal gradients in forage while also avoiding energetically costly snow conditions. How climate‐induced changes in plant phenology and snow accumulation are influencing elk migration timing is unknown. We present the most complete record of elk migration across the GYE, spanning 9 herds and 414 individuals from 2001 to 2017, to evaluate the drivers of migration timing and test for temporal shifts. The timing of elk departure from winter range involved a trade‐off between current and anticipated forage conditions, while snow melt governed summer range arrival date. Timing of elk departure from summer range and arrival on winter range were both influenced by snow accumulation and exposure to hunting. At the GYE scale, spring and fall migration timing changed through time, most notably with winter range arrival dates becoming almost 50 days later since 2001. Predicted herd‐level changes in migration timing largely agreed with observed GYE‐wide changes—except for predicted winter range arrival dates which did not reflect the magnitude of change detected in the elk telemetry data. Snow melt, snow accumulation, and spring green‐up dates all changed through time, with different herds experiencing different rates and directions of change. We conclude that elk migration is plastic, is a direct response to environmental cues, and that these environmental cues are not changing in a consistent manner across the GYE. The impacts of changing elk migration timing on predator–prey dynamics, carnivore–livestock conflict, disease ecology, and harvest management across the GYE are likely to be significant and complex.
At high herbivore density, herbivory can reduce forage abundance, potentially contributing to habitat degradation and driving changes in herbivore population size or range use, in accordance with the exploitation ecosystem hypothesis. The migratory Rivière-George caribou herd (RGH, Rangifer tarandus) of the Quebec-Labrador Peninsula (Canada) has experienced a large decline in population size since the population peaked in the early 1990s, with similarly large changes in seasonal range use. Demographic changes are suspected to have influenced forage abundance and caribou range use through density-dependent interactions between caribou and their habitat. We used the Normalized Difference Vegetation Index (NDVI) to examine relationships between RGH caribou density and range productivity from 1991 to 2011. A modelling approach was used to control for the response of climate and to isolate the influence of caribou herbivory on primary productivity. Significant negative relationships were identified between caribou density and primary productivity, after controlling for climatic variation, for the global RGH calving grounds (r2 = 0.54–0.55) and summer range (r2 = 0.42–0.51), but not for the “core” ranges, where caribou density was highest. Positive temporal trends in primary productivity appeared to reflect the decline in RGH population size, suggesting vegetation recovery following reductions in caribou abundance. Climate warming (of up to + 1.5 °C per decade) was most responsible for the strong positive trends in primary productivity observed over the 1991–2011 period, but decreases in RGH herbivory likely also contributed to the increases in range productivity. Forage access likely improved over the study period, which may have influenced RGH range use and habitat selection.
AimTo quantify changes in vegetation productivity over the past three decades across five barren ground caribou (Rangifer tarandus groenlandicus) herd ranges and assess how these changes are influencing caribou movement rates. LocationNorthwest Territories and Nunavut, Canada. MethodsAs an indicator of vegetation productivity, the enhanced vegetation index (EVI) was calculated on newly developed cloud-free, gap-free, Landsat surface reflectance image composites representing 1984-2012. Changes in EVI were assessed on a pixel basis using Theil-Sen's nonparametric regression and compared across herd ranges and land cover types using generalized least squares regression. Animal movement velocity was calculated from caribou telemetry data and generalized additive mixed models were used to link movement rates with vegetation productivity during the post-calving phase of the year (July and August). ResultsVegetation productivity increased across the five caribou herd ranges examined. The largest productivity increase occurred over the ranges of the most western herds, with the largest observed changes in grassland or shrub habitats. Caribou tended to move more slowly through tundra habitats with elevated levels of productivity to a point, while grasslands movement rates decreased linearly with increasing productivity. Movement velocities peaked at intermediate productivity levels in shrub habitats. Main conclusionsOver the three decades of collected data, barren ground caribou habitats have become more productive, which is consistent with other studies that have documented increases in Arctic vegetation productivity. The more western herds, whose ranges are also closest to the Arctic Ocean, experienced the largest increases in productivity. Finally, we demonstrate that barren ground caribou movement patterns will likely change as a result of changing vegetation productivity in complex manners depending on herd, habitat type and the magnitude of change in vegetation productivity.
Determining drivers of species richness is recognised as highly complex, involving many synergies and interactions. We examine the utility of newly available remote sensing representations of vegetation productivity and vegetation structure to examine drivers of species richness at continental and regional scales. We related richness estimates derived from stacked species distribution models for birds, mammals, amphibians, and reptiles to estimates of actual and potential evapotranspiration (AET and PET), forest structure, and forest productivity across Australia as a whole as well as by bioclimatic zones. We used structural equation modeling to partition correlations between climate energy and vegetation attributes and their subsequent associations with species richness. Continentally, vertebrate richness patterns were strongly related to patterns of energy availability. Richness of amphibians, mammals, and birds were positively associated with AET. However, reptile richness was most strongly associated with PET. Regionally, forest structure and productivity associations with bird, mammal, and amphibian richness were strongest. Again, reptile richness associated most strongly with PET. Our results suggest that a hierarchy of drivers of broad‐scale vertebrate richness patterns exist (reptiles excluded): 1) climate energy is most important at the continental scale; next, 2) vegetation productivity and vegetation structure are most important at the regional scale; except 3) at low extremes of climate energy when energy becomes limiting.
Lichens form a critical portion of barren ground caribou (Rangifer tarandus groenlandicus) diets, especially during winter months. Here, we assess lichen mat volume across five herd ranges in the Northwest Territories and Nunavut, Canada, using newly developed composite Landsat imagery. The lichen volume estimator (LVE) was adapted for use across 700 000 km 2 of barren ground caribou habitat annually from 1984-2012. We subsequently assessed how LVE changed temporally throughout the time series for each pixel using Theil-Sen's slopes, and spatially by assessing whether slope values were centered in local clusters of similar values. Additionally, we assessed how LVE estimates resulted in changes in barren ground caribou movement rates using an extensive telemetry data set from 2006-2011. The Ahiak/Beverly herd had the largest overall increase in LVE (median = 0.033), while the more western herds had the least (median slopes below zero in all cases). LVE slope pixels were arranged in significant clusters across the study area, with the Cape Bathurst, Bathurst, and Bluenose East herds having the most significant clusters of negative slopes (more than 20% of vegetated land in each case). The Ahiak/Beverly and Bluenose West had the most significant positive clusters (16.3% and 18.5% of vegetated land respectively). Barren ground caribou displayed complex reactions to changing lichen conditions depending on season; the majority of detected associations with movement data agreed with current understanding of barren ground caribou foraging behavior (the exception was an increase in movement velocity at high lichen volume estimates in Fall). The temporal assessment of LVE identified areas where shifts in ecological conditions may have resulted in changing lichen mat conditions, while assessing the slope estimates for clustering identified zones beyond the pixel scale where forage conditions may be changing. Lichen volume estimates associated with barren ground caribou movement metrics in an expected manner and, as such, show value for future habitat assessments.
The probability of bleaching occurrence in a given year between 1985 and 2010 was spatially modelled across the world’s warmwater coral reefs at 0.04° X 0.04° latitude-longitude resolution using indicator kriging. Probabilities were not estimated for years in which there were no reports or the modeled semi-variograms failed to converge due to the low number of bleaching observations that year. Please consult the manuscript and the authors before employing this data. The gridded maps are provided in geotiff format.
Episodes of mass coral bleaching have been reported in recent decades and have raised concerns about the future of coral reefs on a warming planet. Despite the efforts to enhance and coordinate coral reef monitoring within and across countries, our knowledge of the geographic extent of mass coral bleaching over the past few decades is incomplete. Existing databases, like ReefBase, are limited by the voluntary nature of contributions, geographical biases in data collection, and the variations in the spatial scale of bleaching reports. In this study, we have developed the first-ever gridded, global-scale historical coral bleaching database. First, we conducted a targeted search for bleaching reports not included in ReefBase by personally contacting scientists and divers conducting monitoring in under-reported locations and by extracting data from the literature. This search increased the number of observed bleaching reports by 79%, from 4146 to 7429. Second, we employed spatial interpolation techniques to develop annual 0.04° × 0.04° latitude-longitude global maps of the probability that bleaching occurred for 1985 through 2010. Initial results indicate that the area of coral reefs with a more likely than not (>50%) or likely (>66%) probability of bleaching was eight times higher in the second half of the assessed time period, after the 1997/1998 El Niño. The results also indicate that annual maximum Degree Heating Weeks, a measure of thermal stress, for coral reefs with a high probability of bleaching increased over time. The database will help the scientific community more accurately assess the change in the frequency of mass coral bleaching events, validate methods of predicting mass coral bleaching, and test whether coral reefs are adjusting to rising ocean temperatures.
Fire regimes are changing throughout the North American boreal forest in complex ways. Fire is also a major factor governing access to high-quality forage such as terricholous lichens for barren-ground caribou ( Rangifer tarandus groenlandicus). Additionally, fire alters forest structure which can affect barren-ground caribou's ability to navigate in a landscape. Here, we characterize how the size and severity of fires are changing across five barren-ground caribou herd ranges in the Northwest Territories and Nunavut, Canada. Additionally, we demonstrate how time since fire, fire severity, and season result in complex changes in caribou behavioural metrics estimated using telemetry data. Fire disturbances were identified using novel gap-free Landsat surface reflectance composites from 1985 to 2011 across all herd ranges. Burn severity was estimated using the differenced normalized burn ratio. Annual area burned and burn severity were assessed through time for each herd and related to two behavioural metrics: velocity and relative turning angle. Neither annual area burned nor burn severity displayed any temporal trend within the study period. However, certain herds, such as the Ahiak/Beverly, have more exposure to fire than other herds (i.e. Cape Bathurst had a maximum forested area burned of less than 4 km 2). Time since fire and burn severity both significantly affected velocity and relative turning angles. During fall, winter, and spring, fire virtually eliminated foraging-focused behaviour for all 26 years of analysis while more severe fires resulted in a marked increase in movement-focused behaviour compared to unburnt patches. Between seasons, caribou used burned areas as early as 1-year postfire, demonstrating complex, nonlinear reactions to time since fire, fire severity, and season. In all cases, increases in movement-focused behaviour were detected postfire. We conclude that changes in caribou behaviour immediately postfire are primarily driven by changes in forest structure rather than changes in terricholous lichen availability.
Regulatory and certification agencies need historical fire pattern information across the Canadian boreal forest to support natural disturbance-based management. Landsat-derived spectral indices have been used extensively to map burn severity in North America. However, satellite-derived burn severity is difficult to define and quantify, and relies heavily on ground truth data for validation, which hinders fire pattern analysis over broad scales. It is therefore critical to translate burn severity estimates into more quantifiable measurements of post-fire conditions and to provide more cost-effective methods to derive validation data. We assessed the degree to which Landsat-derived indices and ancillary data can be used to classify canopy mortality for 10 fires in the boreal forest of Alberta and Saskatchewan, Canada. Models based on two and three mortality classes had overall accuracies of 91 and 72% respectively. The three-level classification has more utility for resource management, with improved accuracy at predicting unburned and complete canopy mortality classes (93 and 66%), but is relatively inaccurate for the partial mortality class (56%). The results presented here can be used to assess the suitability of different canopy mortality models for forest fire management goals, to help provide objective, consistent and cost-effective results to analyse historical fire patterns across the Canadian boreal forest.
Most efforts to link remote sensing to species distributions and movement have focused on indirect estimates of traits based on components of physiological and functional biodiversity. Such a view reflects one perspective on the general needs (habitat) of species. However, information on the vertical and horizontal structure of habitat may play a critical role in defining what a suitable habitat is. The development and application of highly accurate airborne laser scanning (ALS) systems, which are capable of describing the three-dimensional distribution of vegetation, have significant potential value in deriving quantitative relationships between species distributions and their habitat structure. In this paper we review the use of ALS for biodiversity studies, and propose a three-dimensional index which captures the three main components of vertical and horizontal vegetation structure: height, cover, and complexity. Once developed, we apply the index across the forested area of the Canadian province of Alberta, and compare and contrast the differences across natural subregions and land cover types. We also demonstrate how the index can be used with biodiversity data, in this case examining patterns in avian species richness. We conclude with a discussion on the potential use of the habitat structure index with other biodiversity-related research. (C) 2016 Elsevier Ltd. All rights reserved.
Barren ground caribou (Rangifer tarandus groenlandicus) herds experience significant fluctuations in abundance through time. A proposed hypothesis for these fluctuations involves the overgrazing of vegetation on herd summer ranges at high herd densities resulting in a reduction in available forage. Semi-domesticated reindeer (Rangifer tarandus) herds in Scandinavia negatively affect vegetation productivity at high herd densities and exclosure experiments have indicated that overgrazing may also affect barren ground caribou herds. However, overgrazing of summer range vegetation has yet to be tested at the landscape level or related to herd densities for barren ground caribou herds. Accordingly, the question examined in this study was — does barren ground caribou herd density have an effect on summer range vegetation productivity? To answer this question, summer home ranges for four herds in the Northwest Territories and Nunavut, Canada, were delineated using caribou telemetry data. Yearly overall productivity and vegetation seasonality (the change between the maximum and minimum productivity throughout the year) metrics were calculated by year using Moderate Resolution Imaging Spectroradiometer and Advanced Very High Resolution Radiometer data and related to herd densities. Overall vegetation productivity was negatively related to herd density, indicating that some summer range degradation may have occurred at high densities. Conversely, and contrary to our expectations, vegetation seasonality was positively related to herd density. The Bathurst herd, which experienced densities more than three times those of the other herds examined, had the least negative association with overall productivity. Given the negative relationship detected between each herd's densities and overall vegetation productivity, it is likely that some summer range degradation occurred as herd densities increased. Considering the results of the Bathurst herd however, it is difficult to conclude that overgrazing has been a major factor governing herd abundance in the herds examined here. This study demonstrated the utility of archived remotely sensed productivity data and how productivity indices can be useful tools for providing information on large mammal grazing impacts.
 Nicholas Coops合作论文数Department of Forest Resources Management, Faculty of Forestry, The University of British Columbia;Department of Geography, Faculty of Arts, The University of British Columbia17
 Txomin Hermosilla合作论文数Department of Forest Resources Management, University of British Columbia5
 Douglas K. Bolton合作论文数Indigo4
 Mike Wulder合作论文数Canadian Forest Service, Natural Resources Canada4
 Margaret E. Andrew合作论文数Department of Land, Air, and Water Resources, University of California, Davis4
 Simon Donner合作论文数Department of Geography, University of British Columbia3
 Joanne White合作论文数Canadian Forest Service, Natural Resources Canada3Sarah R. Dewey合作论文数2Alyson B. Courtemanch合作论文数2
 Eric K Cole合作论文数US Fish & Wildlife Serv, Natl Elk Refuge2
 Cole Burton合作论文数Department of Forest Resources Management, Faculty of Forestry, The University of British Columbia2
 Arthur Middleton合作论文数Department of Environmental Science, Policy and Management, College of Natural Resources, University of California, Berkeley2
 Gordon B Stenhouse合作论文数2
 Wiebe Nijland合作论文数2McWhirter Douglas E合作论文数2
 Trisalyn Nelson合作论文数Department of Geography, University of Victoria2
 Christopher W. Bater合作论文数Department of Forest Resources Management, University of British Columbia2
 Scott Nielsen合作论文数Department of Biological Sciences, University of Alberta2
 Scott Heron合作论文数James Cook University2
 Matthew Kauffman合作论文数US Geological Survey2
 Piotr Tompalski合作论文数Natural Resources Canada2
 J. John Stadt合作论文数Alberta Sustainable Resource Development Forest Management Branch2
 Jerod A. Merkle合作论文数2M. Paul Atwood合作论文数1Rebecca K. Fuda合作论文数1James C. Maltman合作论文数1Jean-Simon Michaud合作论文数1Nancy Mahony合作论文数1
 Vivek Srivastava合作论文数1Allen Brett Campeau合作论文数1Cameron J. R. McClelland合作论文数1
 Ignacio San-Miguel合作论文数Integrated Remote Sensing Studio, Univ British Columbia1
 Sean P. Kearney合作论文数Crops Research Laboratory, USDA-ARS1
 Ethan E Berman合作论文数Department of Forest Resources Management, University of British Columbia1
 Tristan R. H. Goodbody合作论文数1Scurlock Brandon M合作论文数1Juan M. Morales合作论文数Laboratorio Ecotono, Inibioma-Conicet, Universidad Nacional del Comahue1
 Johan T. Du Toit合作论文数Department of Wildland Resources, The S.J. & Jessie E. Quinney College of Natural Resources, Utah State University1
 Brown Glen S合作论文数1
 Thomas Connor合作论文数School of Biosciences, Cardiff University;Public Health Wales1Edwards William H合作论文数1David W. Andison合作论文数1
 Mark C. Drever合作论文数Faculty of Forestry, University of British Columbia1
 Steeve D. Côté合作论文数Department of Biology, Faculty of Science and Engineering, Laval University1David D. Gustine合作论文数1
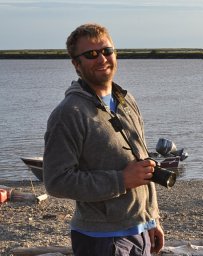 Trevor C. Lantz合作论文数Department of Biological Sciences, University of Alberta1Jared D. Rogerson合作论文数1
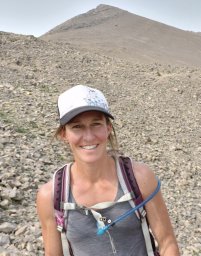 Kelly M. Proffitt合作论文数Department of Ecology, Montana State University1
 Daniel R Macnulty合作论文数Department of Ecology, Evolution, and Behavior, University of Minnesota1




