Permafrost degradation in Arctic lowlands is a critical geomorphic process, increasingly driven by climate warming and infrastructure development. This study applies an integrated geophysical and surveying approach - Electrical Resistivity Tomography (ERT), Ground Penetrating Radar (GPR), and thaw probing - to characterize near-surface permafrost variability across four land use types in Utqia & gdot;vik, Alaska: gravel road, snow fence, residential building and undisturbed tundra (with intact vegetation cover and natural drainage). Results reveal pronounced heterogeneity in thaw depths (0.2 to >1 m) and ice content, shaped by both natural features such as ice wedges and frost heave and anthropogenic disturbances. Roads and snow fences altered surface drainage and snow accumulation, promoting differential thaw, deeper active layers, and localized ground deformation. Buildings in permafrost regions alter the local thermal regime through multiple interacting factors - for example, solar radiation, thermal leakage, snow cover dynamics, and surface disturbance, among others. ERT identified high-resistivity zones (>1000 Omega m) interpreted as ice-rich permafrost and low-resistivity features (<5 Omega m) likely associated with cryopegs or thaw zones. GPR delineated subsurface stratigraphy and supported interpretation of ice-rich layers and permafrost features. These findings underscore the strong spatial coupling between surface infrastructure and subsurface thermal and hydrological regimes in ice-rich permafrost. Geophysical methods revealed subsurface features and thaw depth variations across different land use types in Utqia & gdot;vik, highlighting how infrastructure alters permafrost conditions. These findings support localized assessment of ground stability in Arctic environments.
Both theory and observations suggest that tree intrinsic water use efficiency (iWUE)-the ratio of photosynthetic carbon assimilation to stomatal conductance to water-increases with atmospheric CO2. However, the strength of this relationship varies across sites and species, prompting questions about additional physiological constraints and environmental controls on iWUE. In this study, we analyzed tree core carbon isotope ratios to examine trends in, and drivers of, iWUE in 12 tree species common to the temperate forests of eastern North America, where forests have experienced changes in CO2, climate, and atmospheric pollution in recent decades. Across all site-species combinations, we found that tree iWUE increased 22.3% between 1950 and 2011, coinciding with a 25.2% increase in atmospheric CO2. iWUE trajectories varied markedly among tree functional groups and within species across sites. Needleleaf evergreen iWUE increased until circa 2002 before declining in recent years, while iWUE of broadleaf deciduous species continued to increase. The analysis of environmental controls on iWUE trends revealed smaller increases in iWUE in trees subjected to higher atmospheric pollution loads. Our results suggest that tree functional characteristics and atmospheric pollution history influence tree response to atmospheric CO2, with implications for forest carbon and water balance in temperate regions.
The Arctic is warming faster than anywhere else on Earth, placing tundra ecosystems at the forefront of global climate change. Plant biomass is a fundamental ecosystem attribute that is sensitive to changes in climate, closely tied to ecological function, and crucial for constraining ecosystem carbon dynamics. However, the amount, functional composition, and distribution of plant biomass are only coarsely quantified across the Arctic. Therefore, we developed the first moderate resolution (30 m) maps of live aboveground plant biomass (g m(-2)) and woody plant dominance (%) for the Arctic tundra biome, including the mountainous Oro Arctic. We modeled biomass for the year 2020 using a new synthesis dataset of field biomass harvest measurements, Landsat satellite seasonal synthetic composites, ancillary geospatial data, and machine learning models. Additionally, we quantified pixel-wise uncertainty in biomass predictions using Monte Carlo simulations and validated the models using a robust, spatially blocked and nested cross-validation procedure. Observed plant and woody plant biomass values ranged from 0 to similar to 6000 g m(-2) (mean approximate to 350 g m(-2)), while predicted values ranged from 0 to similar to 4000 g m(-2) (mean approximate to 275 g m(-2)), resulting in model validation root-mean-squared-error (RMSE) approximate to 400 g m(-2) and R-2 approximate to 0.6. Our maps not only capture large-scale patterns of plant biomass and woody plant dominance across the Arctic that are linked to climatic variation (e.g., thawing degree days), but also illustrate how fine-scale patterns are shaped by local surface hydrology, topography, and past disturbance. By providing data on plant biomass across Arctic tundra ecosystems at the highest resolution to date, our maps can significantly advance research and inform decision-making on topics ranging from Arctic vegetation monitoring and wildlife conservation to carbon accounting and land surface modeling.
Abstract Mapping and managing invasive plants are top priorities for land managers, but traditional approaches are time and labor‐intensive. To improve detection efforts, we explored the effectiveness of hyperspectral, drone‐based detection algorithms that incorporate phenology. We collected fine‐resolution (3 cm) hyperspectral images using a drone equipped with a Nano‐Hyperspec imager on seven dates from April to November, 2020 and then used a subsample of pixels from the images to develop multitemporal detection algorithms for three invasive plant species within heterogeneous vegetation communities. The three species are invasive in much of the U.S. and in Virginia, where the data were collected: Ailanthus altissima (tree of heaven), Elaeagnus umbellata (autumn olive), and Rhamnus davurica (Dahurian buckthorn). We determined when each species could be accurately detected, what spectral features allowed for detection, and the consistency of those features over a growing season. All three species could be detected in June. Only E. umbellata had consistently accurate algorithms and used consistent features in the visible and red edge across the growing season. Its most accurate detection algorithms in the summer included features in the yellow‐orange spectral region. A. altissima and R. davurica were both detectable in the mid‐ and late‐growing seasons, with little overlap in key spectral features across dates. Our results indicate that even a small subset of data from hyperspectral imagery can be used to accurately detect invasive plants in heterogeneous plant communities, and that incorporating species‐specific phenological traits into detection algorithms improves detection, laying methodological and theoretical groundwork for the future of invasive species management.
Arctic landscapes occupy a nexus of environmental change processes, globally significant soil carbon stores, wildlife populations, and subsistence-based human societies. In response to rapid climate warming, tundra ecosystems are experiencing widespread changes to vegetation and underlying permafrost, coupled with an array of ecological disturbances that are expected to intensify in the future. Declines in the extent of the cryosphere on land (permafrost and seasonal snow) and offshore (sea-ice) raise the question of whether and for how long warmer portions of the Low Arctic will fit established concepts of “what is Arctic,” given the influence the cryosphere has historically had on tundra ecosystem structure and function. The era of spaceborne observation of circumpolar tundra greenness, in the form of the Normalized Difference Vegetation Index (NDVI), has entered its fifth decade and provides foundational information concerning ecosystem conditions and responses to climatic trends, variability, ecological disturbance, and successional processes. Here we review the evolving story of Arctic greening, and synthesize long-term spaceborne records of NDVI, climatic data, field observations, and the knowledge base of Arctic residents to place the last four decades of Arctic environmental change in context, and establish expectations and research priorities for the coming decade. Greenness dynamics display high spatio-temporal variability, reflecting complex interactions of climatic warming and variability, landscape history, ecological disturbance, and other factors. Nonetheless, long-term increases in NDVI—commonly known as “the greening of the Arctic”—remain prominent across large areas in all available long-term spaceborne datasets and align with long-term shifts in vegetation structure documented in disparate Arctic regions. Common shifts reported from the Low Arctic, such as shrubification, generally portend declines in floristic diversity, and shifts in fauna that favor boreal forest species. Despite lingering uncertainties regarding trend attribution and sources of interannual variability, the sequence of record-high circumpolar tundra greenness values observed since 2020 provides strong evidence that Arctic tundra ecosystems have entered a state without historic precedent on timescales approaching a millennium.
Forest clearing for agricultural use followed by cropland or pasture abandonment is a leading cause of forest disturbance. While theoretical models broadly predict the biogeochemical and structural dynamics of secondary forest succession following disturbances, much remains unknown regarding how specific components of biogeochemical cycling vary through secondary succession. Here we investigate two post‐agricultural disturbance chronosequences at Blandy Experimental Farm in Boyce, VA, each consisting of an early, mid, and late successional field (∼20, ∼35, and ∼100 years old, respectively). We collected data observing a wide range of ecosystem N pools, transformations, and fluxes, including soil, litter, and foliar N; net N mineralization and nitrification; soil N leaching potential; and soil and foliar 15 N natural abundance. We found that total soil N increased throughout secondary succession; while litter N concentration decreased in late succession, total litter mass increased, so total litter N increased as well. Foliar N concentration increased from early to late succession, among and within species. While soil ammonium concentration decreased through succession, soil nitrate concentration increased. Net N mineralization and nitrification both increased throughout succession, and a greater proportion of mineralized N was nitrified later in succession. Isotopic analysis suggested high N‐fixation in mid‐succession, and these observations taken together indicated high N availability and a relatively open N cycle later in succession in this system. Comprehensive field observations such as these are essential for honing a mechanistic understanding of successional systems and making predictions about the biogeochemical cycling and ecosystem function of current and future successional forests.
Arctic ecosystems are experiencing extreme climatic, biotic and physical disturbance events that can cause substantial loss of plant biomass and productivity, sometimes at scales of >1000 km2. Collectively known as browning events, these are key contributors to the spatial and temporal complexity of Arctic greening and vegetation dynamics. If we are to properly understand the future of Arctic terrestrial ecosystems, their productivity, and their feedbacks to climate, understanding browning events is essential. Here we bring together understanding of browning events in Arctic ecosystems to compare their impacts and rates of recovery, and likely future changes in frequency and distribution. We also seek commonalities in impacts across these contrasting event types. We find that while browning events can cause high levels of plant damage (up to 100% mortality), ecosystems have substantial capacity for recovery, with biomass largely re-established within five years for many events. We also find that despite the substantial loss of leaf area of dominant species, compensatory mechanisms such as increased productivity of undamaged subordinate species lessen the impacts on carbon sequestration. These commonalities hold true for most climatic and biotic events, but less so for physical events such as fire and abrupt permafrost thaw, due to the greater removal of vegetation. Counterintuitively, some events also provide conditions for greater productivity (greening) in the longer-term, particularly where the disturbance exposes ground for plant colonisation. Finally, we find that projected changes in the causes of browning events currently suggest many types of events will become more frequent, with events of tundra fire and abrupt permafrost thaw expected to be the greatest contributors to future browning due to their severe impacts and occurrence in many Arctic regions. Overall, browning events will have increasingly important consequences for ecosystem structure and function, and for feedback to climate.
Ice-wedge polygons in Arctic tundra landscapes influence hydrology, nutrients, thermal regimes, and vegetation. Ice-wedges are particularly vulnerable to warming events, and widespread degradation has been observed in recent decades. While increased vegetation growth is predicted to offset some of the nutrient losses from thawing Arctic soils, evolving Arctic vegetation carbon and nitrogen stocks are poorly understood. To explore effects of warming and ice-wedge degradation on Arctic vegetation, we used aboveground plant biomass data from stages of ice-wedge degradation at two northern Arctic tundra sites (Jago River and Prudhoe Bay, AK) to parameterize and test a nutrient-based, plant community and ecosystem model (ArcVeg) incorporating ice-wedges within a landscape for different Arctic tundra locations. Warming increased both aboveground and belowground biomass but introducing ice-wedge degradation led to shrub loss and a shift from terrestrial moss and shrub-dominated communities to aquatic moss and graminoid-dominated communities. In northern locations, degradation reduced vegetation C and N stocks due to biomass loss, whereas at the southern location, total plant C and N increased substantially due to moss proliferation. Model predictions suggest that ice-wedge degradation effects are accentuated under warming, and southern Arctic tundra aquatic moss proliferation may offset or even exceed biomass lost.
Tundra shrub expansion is a central form of change in warming Arctic ecosystems, but the pace of shrubification varies across spatial scales, complicating efforts to understand its drivers and consequences. Here, we apply convolutional neural networks (CNNs) to very‐high resolution satellite image pairs acquired 10–15 years apart (circa 2005–2019) to identify spatio‐temporal patterns of tall shrub (> ~1.5 m height) expansion and their relationships to environmental covariates and antecedent shrub cover in three upland‐dominated Siberian Arctic landscapes. We developed human‐interpreted training datasets for CNN modelling of tall shrub occurrence and change for nearly 1 million 12 × 12 m image tiles using four canopy cover classes: Tundra lacking tall shrubs; Colonization with isolated shrubs; Open Shrub with discontinuous cover of mature shrubs; and Closed Shrub with dense cover of mature shrubs. F1 scores for the canopy cover maps ranged 0.83–0.92, and classification confidence was high (>0.8) in both time periods for 62% of image tiles. We evaluated canopy class occurrence with respect to landscape‐scale environmental covariates related to topography, insolation, wetness and proximity to established shrubs. We detected increases in tall shrub cover in all three landscapes, but the rate of increase varied substantially (+2.4 to 26.1% decade −1 ). Locally, the distribution of canopy cover classes was strongly influenced by topographically derived metrics of wetness and potential insolation. Shrub colonization was further conditioned by proximity to pre‐existing shrubs. Synthesis . We found that mature, long‐established shrubs (i.e. the Open Shrub and Closed Shrub classes) were closely linked to well‐drained landscape positions; however, closed shrub stands were more likely to occur on warmer, south‐facing slopes, while Open Shrub predominated on cooler slope aspects. Contemporary shrub colonization has occurred on flatter landscape positions and across wider gradients of insolation and moisture. In our study region, northward shrubline advance appears most closely tied to microsites with favourable drainage and edaphic conditions; subsequent seed production and ameliorating effects support canopy infilling, particularly on warmer hillslope aspects. The techniques employed here provide insights into the susceptibility of landscapes to future shrub expansion and help address geographic bias regarding Arctic shrubification and its environmental drivers.
Plant biomass is a fundamental ecosystem attribute that is sensitive to rapid climatic changes occurring in the Arctic. Nevertheless, measuring plant biomass in the Arctic is logistically challenging and resource intensive. Lack of accessible field data hinders efforts to understand the amount, composition, distribution, and changes in plant biomass in these northern ecosystems. Here, we present The Arctic plant aboveground biomass synthesis dataset , which includes field measurements of lichen, bryophyte, herb, shrub, and/or tree aboveground biomass (g m −2 ) on 2,327 sample plots from 636 field sites in seven countries. We created the synthesis dataset by assembling and harmonizing 32 individual datasets. Aboveground biomass was primarily quantified by harvesting sample plots during mid- to late-summer, though tree and often tall shrub biomass were quantified using surveys and allometric models. Each biomass measurement is associated with metadata including sample date, location, method, data source, and other information. This unique dataset can be leveraged to monitor, map, and model plant biomass across the rapidly warming Arctic.
Monitoring ecosystems should allow comparisons at local, regional, and continental scales. To this end, methodologies must capture the spatial and temporal variability caused by natural and anthropic factors, and metrics must be sensitive and responsive to environmental changes. Our aim in this research was to determine which ecosystem functioning attributes that can be captured through remote sensing best represent the spatial and temporal variability of terrestrial biomes on a global scale and to generate an array of biome-like entities, i.e., global ecosystem functional types, exclusively based on functional variables. We also evaluated the degree of complementarity of attributes and their phenometrics to describe ecosystem functioning. Using MODIS products, we estimated the seasonal dynamics of four variables related to carbon gains (the enhanced vegetation index, EVI), the radiation balance (surface albedo and surface temperature), and water dynamics (evapotranspiration). The four functional variables were evaluated in terms of (1) spatial heterogeneity and temporal variability, (2) the possibility of capturing that variability using a group of phenometrics with a clear ecological meaning, and (3) the complementarity between the most relevant functional attributes. We developed a global ecosystem functional type (GEFT) characterization that incorporated the three most informative and independent phenometrics of the four variables.Our analyses showed that the water cycle, radiation and heat balance of the surface, and carbon dynamics variability of the ecosystems of the entire planet can be synthesized by three common phenometrics that, applied to a functional variable, conform to an ecosystem functional attribute (i.e. magnitude, seasonality, and phenology of each functional dimensions). Global Ecosystem Functional Types (GEFTs) can not only track the spatial heterogeneity but also its temporal dynamics. By defining GEFTs based on the water cycle, energy balance of the surface, and carbon dynamics, we can characterize Earth's ecosystem typology in a consistent way across the whole biosphere.
Adjustments in foliar photoprotective pigments are crucial for plant adaptation to harsh environments, serving as indicators of environmental stress. However, understanding when and where these adjustments occur across diverse biomes remains unclear due to challenges in large-scale observation. Here, we propose a novel approach to assess dynamics in photoprotective pigments at the canopy level using a new index derived from space-borne optical sensors. This approach generates a global map depicting the daily mean shortwave radiation threshold at which adjustments typically occur under prevailing climatic conditions. The global average of this threshold is 262 ± 50 W m⁻2, with lower values at high latitudes and peaks near 40° in both hemispheres. Temperature exerts a stronger influence on this latitudinal pattern than humidity. Future projections suggest a decrease in this threshold over northern high latitudes, implying exacerbated vulnerability under identical radiation levels due to negative warming responses. Based on this threshold, a high-stress zone around 60°N is identified and is predicted to shift southward in the future. These findings bridge critical gaps in photoprotection research and offer a new perspective on understanding the biogeochemical cycles of global ecosystems. This framework can also enhance our ability to predict the fate of diverse ecosystems under future climate.
Significant progress in permafrost carbon science made over the past decades include the identification of vast permafrost carbon stocks, the development of new pan-Arctic permafrost maps, an increase in terrestrial measurement sites for CO2 and methane fluxes, and important factors affecting carbon cycling, including vegetation changes, periods of soil freezing and thawing, wildfire, and other disturbance events. Process-based modeling studies now include key elements of permafrost carbon cycling and advances in statistical modeling and inverse modeling enhance understanding of permafrost region C budgets. By combining existing data syntheses and model outputs, the permafrost region is likely a wetland methane source and small terrestrial ecosystem CO2 sink with lower net CO2 uptake toward higher latitudes, excluding wildfire emissions. For 2002-2014, the strongest CO2 sink was located in western Canada (median: -52 g C m-2 y-1) and smallest sinks in Alaska, Canadian tundra, and Siberian tundra (medians: -5 to -9 g C m-2 y-1). Eurasian regions had the largest median wetland methane fluxes (16-18 g CH4 m-2 y-1). Quantifying the regional scale carbon balance remains challenging because of high spatial and temporal variability and relatively low density of observations. More accurate permafrost region carbon fluxes require: (a) the development of better maps characterizing wetlands and dynamics of vegetation and disturbances, including abrupt permafrost thaw; (b) the establishment of new year-round CO2 and methane flux sites in underrepresented areas; and (c) improved models that better represent important permafrost carbon cycle dynamics, including non-growing season emissions and disturbance effects. Climate change and the consequent thawing of permafrost threatens to transform the permafrost region from a carbon sink into a carbon source, posing a challenge to global climate goals. Numerous studies over the past decades have identified important factors affecting carbon cycling, including vegetation changes, periods of soil freezing and thawing, wildfire, and other disturbance events. Overall, studies show high wetland methane emissions and a small net carbon dioxide sink strength over the terrestrial permafrost region but results differ among modeling and upscaling approaches. Continued and coordinated efforts among field, modeling, and remote sensing communities are needed to integrate new knowledge from observations to modeling and predictions and finally to policy. Rapid warming of northern permafrost region threatens ecosystems, soil carbon stocks, and global climate targets Long-term observations show importance of disturbance and cold season periods but are unable to detect spatiotemporal trends in C flux Combined modeling and syntheses show the permafrost region is a small terrestrial CO2 sink with large spatial variability and net CH4 source
The direction and magnitude of tundra vegetation productivity trends inferred from the normalized difference vegetation index (NDVI) have exhibited spatiotemporal heterogeneity over recent decades. This study examined the spatial and temporal drivers of Moderate Resolution Imaging Spectroradiometer Max NDVI (a proxy for peak growing season aboveground biomass) and time-integrated (TI)-NDVI (a proxy for total growing season productivity) on the Yamal Peninsula, Siberia, Russia between 2001 and 2018. A suite of remotely-sensed environmental drivers and machine learning methods were employed to analyze this region with varying climatological conditions, landscapes, and vegetation communities to provide insight into the heterogeneity observed across the Arctic. Summer warmth index, the timing of snowmelt, and physiognomic vegetation unit best explained the spatial distribution of Max and TI-NDVI on the Yamal Peninsula, with the highest mean Max and TI-NDVI occurring where summer temperatures were higher, snowmelt occurred earlier, and erect shrub and wetland vegetation communities were dominant. Max and TI-NDVI temporal trends were positive across the majority of the Peninsula (57.4% [5.0% significant] and 97.6% [13.9% significant], respectively) between 2001 and 2018. Max and TI-NDVI trends had variable relationships with environmental drivers and were primarily influenced by coastal-inland gradients in summer warmth and soil moisture. Both Max and TI-NDVI were negatively impacted by human modification, highlighting how human disturbances are becoming an increasingly important driver of Arctic vegetation dynamics. These findings provide insight into the potential future of Arctic regions experiencing warming, moisture regime shifts, and human modification, and demonstrate the usefulness of considering multiple NDVI metrics to disentangle the effects of individual drivers across heterogeneous landscapes. Further, the spatial heterogeneity in the direction and magnitude of interannual covariation between Max NDVI, TI-NDVI, and climatic drivers highlights the difficulty in generalizing the effects of individual drivers on Arctic vegetation productivity across large regions.
Biodiversity, when viewed through the combined lenses of compositional, structural, and functional attributes, provides for a holistic understanding of the complexities found within community assemblages and ecosystems. However, advancement in our understanding of how ecosystem functional diversity interacts with structural and compositional diversity metrics is lacking, in part because universally applied methodologies to derive ecosystem functional classifications are still under development and vary widely across scales, extents and biomes. This study presents a methodology to construct ecosystem functional types (EFTs), or areas of the land surface that function similarly, using the MODIS NDVI record, for the terrestrial circumpolar Arctic. EFTs were derived from the seasonal dynamics of NDVI, over the Arctic tundra at 250 m resolution and compared to bioclimate subzones and to structurally and compositionally defined vegetation units of the Circumpolar Arctic Vegetation Map (CAVM). Correspondence analyses of CAVM EFTs to previously delineated CAVM bioclimatic subzones, physiognomic (vegetation) units and floristic provinces revealed a general congruence, indicating convergence across composition, structure, and function; yet also demonstrated substantial functional variability even within bioclimate subzones and vegetation units. Strong latitudinal gradients in ecosystem function are present, with EFT richness ranging from low (34) in northernmost regions to high (45) in southernmost regions. Locally, the mountainous regions of northern Alaska, and eastern and western Siberia had high spatial variability in ecosystem functioning. Aside from these generalities, we found that EFTs varied widely within individual mapped vegetation units, successfully capturing the functional dimension of biodiversity across the circumpolar Arctic tundra.
Modeling Arctic-Boreal vegetation is a challenging but important task, since this highly dynamic ecosystem is undergoing rapid and substantial environmental change. In this work, we synthesized information on 18 dynamic vegetation models (DVMs) that can be used to project vegetation structure, composition, and function in North American Arctic-Boreal ecosystems. We reviewed the ecosystem properties and scaling assumptions these models make, reviewed their applications from the scholarly literature, and conducted a survey of expert opinion to determine which processes are important but lacking in DVMs. We then grouped the models into four categories (specific intention models, forest species models, cohort models, and carbon tracking models) using cluster analysis to highlight similarities among the models. Our application review identified 48 papers that addressed vegetation dynamics either directly (22) or indirectly (26). The expert survey results indicated a large desire for increased representation of active layer depth and permafrost in future model development. Ultimately, this paper serves as a summary of DVM development and application in Arctic-Boreal environments and can be used as a guide for potential model users, thereby prioritizing options for model development.
Rapid atmospheric warming and sea-ice retreat are driving widespread changes in Arctic ecosystems, among the most pervasive of which is the "greening of the Arctic"-an increase in the cover and biomass of vegetation observed by satellites across much of the Arctic tundra biome. Determining the drivers, impacts, and feedbacks of Arctic greening requires continued investment in robust field, remote-sensing, and model-based capabilities, and improved integration of the knowledge base of Arctic peoples. These tools and approaches support the triangulation of complex problems and the development of improved projections for the warmer Arctic tundra biome of the future.
Satellite-derived Ecosystem Functional Types (EFTs) are increasingly used in ecology and conservation to characterize ecosystem heterogeneity. The diversity of EFTs, also known as Ecosystem Functional Diversity (EFD), has been suggested both as a potential metric of ecosystem-level biodiversity and as a predictor for ecosystem functioning, ecosystem services, and resilience. However, the impact of key methodological choices on patterns of EFTs and EFD have not been formally assessed. Using Costa Rica as a study system, we compared EFTs and EFD, derived from MODIS and Landsat data using different methodological assumptions, at both national and local extents. Our results showed that the regional spatial patterns of EFTs and EFD derived from 250 m MODIS and 30 m Landsat are notably different. The selection of sensors for deriving EFTs and EFD is dependent on the study area, data quality, and the research objective. Given its finer spatial resolution, Landsat has greater capacity to differentiate more EFTs than MODIS, though MODIS could be a better choice in frequently cloudy areas due to its shorter revisiting time. We also found that the selection of spatial extent used to derive EFD is critical, as smaller extents (e.g., at a local rather than a national scale) can show much higher diversity. However, diversity levels derived at smaller extents appear to be nested within the diversity levels derived at larger extents. As EFTs and EFD continue to develop as a tool for ecosystem ecology, we highlight the important methodological choices to ensure that these metrics best fit research objectives.
 D. A. Walker合作论文数Department of Biology and Wildlife, Faculty of Biology and Wildlife, University of Alaska Fairbanks101
 Uma S Bhatt合作论文数U. Illinois Champaign-Urbana47
 Martha K. Raynolds合作论文数39
 Frost Gerald V合作论文数Department of Environmental Sciences, University of Virginia36
 Gensuo Jia (贾根锁)合作论文数Institute of Atmospheric Physics, Chinese Academy of Sciences;University of Chinese Academy of Sciences29
 Bruce C. Forbes合作论文数Rovaniemi, University of Lapland25
 Vladimir E. Romanovsky合作论文数Permafrost Laboratory, Geophysical Institute, University of Alaska Fairbanks22M. K. Raynolds合作论文数22
 Ryan Emanuel合作论文数Department of Geology, Appalachian State University21
 Josefino Comiso合作论文数Cryospheric Sciences Laboratory, Goddard Space Flight Center, National Aeronautics and Space Administration20
 Brian Leonard Mcglynn合作论文数Department of Land Resources and Environmental Sciences, Montana State University19Daniel L. Welsch合作论文数Canaan Valley Institute19Jorge E. Pinzon合作论文数19
 Diego A. Riveros-Iregui合作论文数Department of Land Resources and Environmental Sciences, Montana State University16Patrick Kuss合作论文数15
 Compton J. Tucker合作论文数NASA Goddard Space Flight Center14
 Amanda Armstrong合作论文数Department of Environmental Sciences, University of Virginia14
 Marina O. Leibman合作论文数13
 Gregory S. Okin合作论文数Department of Geography, College of Social Sciences, University of California, Los Angeles12
 Scott Goetz合作论文数Global Earth Observation & Dynamics of Ecosystems Lab, Northern Arizona University;School of Informatics, Computing, and Cyber Systems, Northern Arizona University12
 Gareth Phoenix合作论文数School of Biosciences, Faculty of Science, The University of Sheffield12Patrick J. Webber合作论文数12
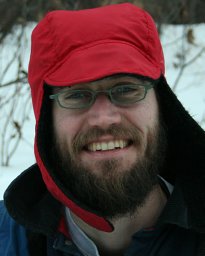 Ronald P. Daanen合作论文数12
 Alexander Kholodov合作论文数Univ Alaska Fairbanks, Inst Geophys, Fairbanks, AK 99775 USA11
 Marcel Buchhorn合作论文数Remote Sensing Unit, Flemish Inst Technol Res VITO11
 Indy Burke合作论文数School of the Environment, Yale University11
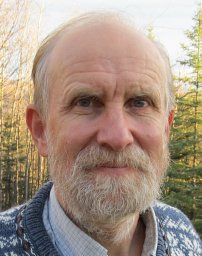 M. Torre Jorgenson合作论文数Alaska Biological Research Inc;Arctic Institute of North America;Alaska Biological Research Inc, Arctic Institute of North America11
 Chien-Lu Ping合作论文数Agricultural and Forestry Experiment Station, University of Alaska Fairbanks11
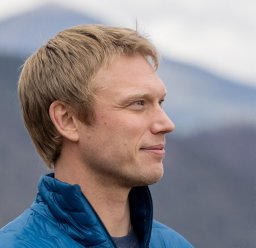 Logan T. Berner合作论文数Department of Environmental Science, Western Washington University11
 John E. Walsh合作论文数Department of Climate, Meteorology & Atmospheric Sciences, School of Earth, Society & Environment, University of Illinois Urbana-Champaign;International Arctic Research Center, University of Alaska Fairbanks10
 Georgiy Matyshak合作论文数10
 Chris Derksen合作论文数Climate Research Division, Environment and Climate Change Canada10
 Hans Tømmervik合作论文数Norwegian Institute for Nature Research;Norwegian University of Science and Technology;Norwegian Institute for Nature Research, Norwegian University of Science and Technology10
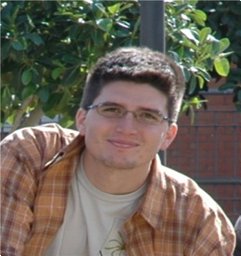 Domingo Alcaraz-Segura合作论文数Department of Environmental Sciences Clark Hall, University of Virginia10
 James E. Overland合作论文数Pacific Marine Environmental Laboratory|NATIONAL OCEANIC AND ATMOSPHERIC ADMINISTRATION10Nikolay I. Shiklomanov合作论文数George Washington University9
 Isla Myers-Smith合作论文数Global Change, School of GeoSciences, The University of Edinburgh9
 Mary-Louise Timmermans合作论文数Department of Earth & Planetary, Yale University9
 Xavier Fettweis合作论文数Department of Geography 2, University of Liège;Department of Geography 2, University of Liège9
 Anna Liljedahl合作论文数9
 Breen Amy L合作论文数9Sharon L. Smith合作论文数9
 Kaisa Lakkala合作论文数9
 William A. Gould合作论文数USDA Forest Service, International Institute of Tropical Forestry9
 Marco Tedesco合作论文数City University of New York9
 Fred J.A. Daniels合作论文数9
 Germar Bernhard合作论文数Biospherical Instruments Inc9
 Peter Bieniek合作论文数9Craig E. Tweedie合作论文数Department of Biological Sciences, University of Texas at El Paso9




