Accurate estimation of rainfall-derived inflow and infiltration (RDII) is essential for effective management of municipal wastewater systems. Traditional flow meters often face limitations in sewer environments due to issues with accuracy, installation, and maintenance, and the analysis of RDII flow data relies on manual calibration that is time-consuming and subjective. The recent advancements in smart sensors indicate the beginning of a new era of sewer flow monitoring and analysis, but this could be hindered by the lack of methods to effectively utilize the enhanced sensor data for RDII analysis. This study is the first attempt to integrate smart sewer monitoring with ensemble optimization to automate RDII assessment. The state-of-the-art SmartCover sensors were deployed in two contrasting sewersheds in South Texas, and an ensemble of five optimization algorithms was developed for the automatic calibration of the RTK model, a widely used RDII model. Sixteen RDII events were analyzed, covering a wide range of rainfall depths (14-111 mm) and peak intensities (2.8-83.8 mm/h). Results showed that ensemble calibration improved accuracy by 5 % in calibration and 17 % in validation compared to the best single algorithm. The calibrated R parameters suggested that the residential sewershed could be controlled by slow infiltration through old and leaky pipes, while the quick response of the institutional sewershed could be caused by the surface inflow. This approach establishes a scalable benchmark for linking smart sensor monitoring with ensemble-based RDII assessment, enabling utilities to enhance RDII characterization and management, reduce the risk of sewer overflows, and strengthen wastewater infrastructure resilience.
Unreliable and unequal public water supply already affects around one billion urban residents around the world. In many cities, informal water markets have emerged to fill public supply gaps by delivering water via tanker trucks, depleting scarce rural groundwater sources. A quintessential example of this can be found in the highly water-scarce country of Jordan. In Jordan, intermittent public water supply and rapid urban growth have led to a surge of uncontrolled groundwater abstractions by pervasive illegal tanker water markets. Here, we use a rigorous coupled human-natural systems model to assess a range of policy options for mitigating the groundwater impacts of informal water markets in Jordan with regards to their effectiveness and impacts on household water access. The model represents spatially distributed feedbacks between Jordan’s water sector and groundwater resources in country-wide scenario simulations until 2050. We find that investments in supply augmentation have limited impact on tanker water demand, unless they are combined with a more equitable and efficient distribution of public water supply. Jordan’s current policy of closing illegal tanker wells is found to impede the access of water-stressed households to tanker deliveries. Approaches for the legalization of tanker water markets provide more efficient policy options. Policy design is shown to be decisive for safeguarding household water access. Our findings show that understanding the role of informal water markets in urban water supply can be critical for reconciling sustainable groundwater management and household water security.
The intertidal zone, serving as a dynamic interface, presents a challenging environment for understanding the transport of spilled oil. This study explores the resuspension of stranded oil and the formation of suspended oil-particle aggregates (OPAs) under varying sediment properties, water chemistry, hydrodynamic forces, and biodegradation conditions. Findings reveal that sediment grain size and mineralogical structure influence oil resuspension and OPA formation but function through distinct mechanisms. Mixed sediments exhibit variable oil-mineral interaction regimes and sediment cohesiveness, which together govern oil resuspension and OPA formation. An increase in ionic strength can largely constrain the resuspension of stranded oil by promoting the swelling of the montmorillonite interlayer space and reducing the electrostatic repulsion among oil-contaminated particles, particularly at low ionic concentrations where oil resuspension is highly sensitive to changes in ionic strength. Both natural and commercial amphiphilic compounds facilitated oil resuspension; however, excessive concentrations of commercial amphiphilic compounds hindered oil resuspension. Stronger hydrodynamic disturbances promoted OPA fragmentation while simultaneously driving oil resuspension, potentially expanding contamination areas. Biodegradation altered oil composition, thereby improving its adhesion to sediments and reducing resuspension, but it may pose challenges for sediment cleanup due to its increased recalcitrance. These findings highlight the complexity of stranded oil behavior in intertidal zones and contribute to the development of targeted cleanup strategies for specific conditions of affected intertidal zones.
Objective: This study aims to utilize the Machine Learning (ML) model to produce highprecision maps of urban ground subsidence susceptibility, providing a scientific basis for disaster prevention and mitigation efforts in the Kunming Basin. Methods: In this patent study, remote sensing interpretation of Kunming City was conducted using SBAS-InSAR technology to acquire subsidence data. Based on the frequency ratio method, ten evaluative factors with strong correlations were selected to establish an evaluation index system for the subsidence susceptibility of the Kunming Basin. Five models, including CNN, Back Propagation Neural Network (BPNN), Genetic Algorithm optimized BPNN (GA-BPNN), Particle Swarm Optimization optimized BPNN (PSO-BPNN), and Radial Basis Function Neural Network (RBFNN), were employed. The frequency ratio method and the ROC curve were used to compare the effectiveness and precision of these models. Results: The frequency ratio method indicated that the CNN model had the highest values in the very high and high susceptibility areas, reaching 4.10, which was the highest among all models; in the very low and low susceptibility areas, its value was 0.34, which was the lowest among the models. The ROC curve demonstrated that the CNN model, based on deep learning (AUC = 0.952), was more precise than the machine learning-based models such as BPNN (AUC = 0.896), RBFNN (AUC = 0.917), GA-BPNN (AUC = 0.890), and PSO-BPNN (AUC = 0.906). Conclusion: The CNN model has predicted that 81.06% of the ground subsidence grid cells fall into the very high and high susceptibility categories, demonstrating good predictive performance. According to the established evaluation index system for ground subsidence susceptibility, the fundamental causes of ground subsidence in the Kunming Basin are identified as poor soil mechanical properties and low bearing capacity, while construction activities have exacerbated the development of ground subsidence.
This study evaluates a popular approach to assessing stormwater utility fees in the context of social equity. Analyses are based on comparing single-family land parcels in different neighborhoods of Corpus Christi, a U.S. city in the state of Texas that recently introduced a stormwater fee program. The stormwater fees are based on the same stormwater runoff factor for all single-family residential land parcels. We instead derive stormwater runoff estimates from parcel-scale impervious area measurements through the application of a machine-learning model to high-resolution remote sensing data. The difference between the official runoff factor and our estimate tends to be larger among land parcels in census tracts with proportionally more low-income and Hispanic households. This finding at odds with the ability-to-pay principle is attributable to the association of different neighborhoods' sociodemographic compositions with their housing development patterns. Our work not only contributes to the design of a stormwater fee program that better characterizes the generation of stormwater runoff but it also helps city officials alleviate social inequity for homeowners in economically disadvantaged communities.
Municipalities worldwide implement stormwater management programs to mitigate the hydrological and water quality impacts of stormwater runoff. Stormwater utility fees (SWUF) are often used to fund such important programs by collecting revenue from residential and commercial properties. However, existing SWUFs often solely rely on the estimate of impervious surfaces and do not consider other environmental, infrastructure, and socioeconomic factors in the generation and effects of stormwater runoff. This study is the first attempt to propose a reconstruction of SWUFs from the perspectives of social equity and environmental justice. The method aims to address disparities in fee rates among residential parcels, focusing on helping economically disadvantaged communities. It integrates drainage service, potential contribution to non-point source pollution, and socioeconomic status through two alternative schemes. The two schemes allocate fees based on combined rankings of the three factors at the level of census block groups. The proposed method was applied to 88 180 residential parcels in Corpus Christi, Texas, a mid-sized coastal community. The results suggest that over 70% of the disadvantaged communities would benefit from the reconstructed SWUFs without affecting the targeted funding for stormwater infrastructure. This method builds on publicly available datasets and offers an adaptive framework for other municipalities to incorporate additional factors or datasets, representing an exploratory step toward achieving more equitable stormwater management practices.
. Sediment plumes are generated from both natural and human activities in benthic environments, increasing the turbidity of the water and reducing the amount of sunlight reaching the benthic vegetation. Seagrasses, which are photosynthetic bioindicators of their environment, are threatened by chronic reductions in sunlight, impacting entire aquatic food chains. Our research uses unmanned aerial vehicle (UAV) aerial video and imagery to investigate the characteristics of sediment plumes generated by a model of anthropogenic disturbance. The extent, speed, and motion of the plumes were assessed as these parameters may pertain to the potential impacts of plume turbidity on seagrass communities. In a case study using UAV video, the turbidity plume was observed to spread more than 200 ft over 20 min of the UAV campaign. The directional speed of the plume was estimated to be between 10.4 and 10.6 ft/min. This was corroborated by observation of the greatest plume turbidity and sediment load near the location of the disturbance and diminishing with distance. Further temporal studies are necessary to determine any long-term impacts of human activity-generated sediment plumes on seagrass beds.
The quantification of urban impervious area has important implications for the design and management of urban water and environmental infrastructure systems. This study proposes a deep learning model to classify 15‐cm aerial imagery of urban landscapes, coupled with a vector‐oriented post‐classification processing algorithm for automatically retrieving canopy‐covered impervious surfaces. In a case study in Corpus Christi, TX, deep learning classification covered an area of approximately 312 km2 (or 14.86 billion 0.15‐m pixels), and the post‐classification effort led to the retrieval of over 4 km2 (or 0.18 billion pixels) of additional impervious area. The results also suggest the underestimation of urban impervious area by existing methods that cannot consider the canopy‐covered impervious surfaces. By improving the identification and quantification of various impervious surfaces at the city scale, this study could directly benefit a variety of environmental and infrastructure management practices and enhance the reliability and accuracy of processed‐based models for urban hydrology and water infrastructure.
Impervious surfaces increase surface runoff, leading to elevated flood risks and nonpoint source pollution. Predicting impervious surface ratios is essential for various urban management practices, ranging from drainage infrastructure design and water quality assessment to utility fee evaluation and flood risk mitigation. Traditionally, the information on impervious surface ratios is often estimated by city managers and engineers based on empirical values and assumptions. Recent studies have highlighted aerial image classification using machine learning and deep learning models, but such approaches are computationally intensive. We propose a graph neural network (GNN)-driven method, named GraphParcelNet, for advancing the quantification of parcel-level impervious surface ratios at the city scale. To our best knowledge, we are the first to transform land parcel datasets, consisting of vector data in geometric shapes (polygons), into a graph model that considers the spatial relationships between parcels. By utilizing a GNN-based approach, GraphParcelNet enhances the representation of spatial dependencies, resulting in more accurate and reliable predictions over traditional methods. Our experimental results demonstrate that GraphParcelNet outperforms previous methods, providing an accurate measurement for impervious surface ratios.
Digital elevation models (DEM) are one of the most fundamental inputs for hydrological modeling. It has been a common practice to remove all surface depressions in a DEM as they are assumed to be data errors. The emerging technology of unmanned aircraft systems (UAS) provides an opportunity to re-examine this assumption at the hyperspatial resolution. This study was the first attempt to characterize small surface depressions in urban environments using UAS imagery. Using an urban area in south Texas as the study site, UAS flights were conducted to yield hybrid DEMs at the resolution of 8-14 cm, coupled with comprehensive ground truth collection. Surface depressions identified from the UAS DEMs were first corrected based on the vertical accuracy of DEMs and then validated through field surveys, with comparisons to two existing LiDAR DEMs (1-m and 10-m). The hydrological impacts of different DEM-derived estimates of catchment depression storage were examined using the Curve Number method across different design storms. Results show that the UAS DEMs outperformed the LiDAR DEMs in describing the microtopographic control of urban overland flow and associated hydrological connectivity across built and natural features. The 8-cm UAS DEM revealed 926% more depression storage than the 10-m LiDAR DEM. This demonstrates a compelling correlation between increasing DEM resolution and enhanced quantification of depression volume. Consequently, the increased depression storage reduced surface runoff by 41% under a two-year design storm and 13% under a 200-year design storm. The results suggest a strong relationship between the DEM resolution and the derived depression estimates, aligning with the fractal nature of watershed systems. Also, the results indicate that the centimeter-level UAS DEMs were not immune from problems. They could yield fake depressions caused by factors such as vegetation, temporary street objects, and underground sewer pipes. The findings of this study suggest the need to quantify the relationships between DEM resolution and associated hydrological attributes and develop new digital drainage analysis algorithms that could effectively incorporate UAS data into urban hydrological modeling.
Scarce and unreliable urban water supply in many countries has caused municipal users to rely on transfers from rural wells via unregulated markets. Assessments of this pervasive water re-allocation institution and its impacts on aquifers, consumer equity and affordability are lacking. We present a rigorous coupled human–natural system analysis of rural-to-urban tanker water market supply and demand in Jordan, a quintessential example of a nation relying heavily on such markets, fed by predominantly illegal water abstractions. Employing a shadow-economic approach validated using multiple data types, we estimate that unregulated water sales exceed government licences 10.7-fold, equalling 27% of the groundwater abstracted above sustainable yields. These markets supply 15% of all drinking water at high prices, account for 52% of all urban water revenue and constrain the public supply system’s ability to recover costs. We project that household reliance on tanker water will grow 2.6-fold by 2050 under population growth and climate change. Our analysis suggests that improving the efficiency and equity of public water supply is needed to ensure water security while avoiding uncontrolled groundwater depletion by growing tanker markets.
Land subsidence is an important cause of relative sea-level rise along the Gulf Coast. There is a lack of effective monitoring of coastal subsidence with high accuracy and high spatial resolution for improving coastal risk assessment and mitigation. This study is the first attempt to integrate satellite interferometric synthetic aperture radar (InSAR) and airborne light detection and ranging (LiDAR) methods to investigate the spatiotemporal pattern of coastal subsidence. The study area is around Eagle Point, Texas, a region known for its fast rate of relative sea-level rise in recent decades. From 2006 to 2011, the line-of-sight velocities were up to-33 mm/year based on ascending ALOS-1 PALSAR-1 images. From 2016 to 2021, the vertical velocities were up to-34 mm/ year based on ascending and descending Sentinel-1 images. Additional details of the subsidence pattern were revealed by incorporating the surface difference derived from 1-m airborne LiDAR results. Comparisons of the InSAR-derived velocities from image time series and the LiDAR-derived surface changes from time-lapsed ob-servations were conducted at different spatial levels with linkages to land cover patterns and topography. The results showed that local subsidence rates could vary significantly below the spatial resolution of InSAR results, indicating a valuable role of airborne LiDAR results in extending InSAR results to parcel and building levels and explaining subpixel uncertainties. Also, subsidence appeared to be stronger in vegetated areas than in developed areas and negatively correlated with surface imperviousness. The magnitude of subsidence was not correlated with elevation along selected transect lines. Overall, this study demonstrated the benefits of combining InSAR results with other geospatial datasets to characterize coastal subsidence. In particular, the high vertical accuracy of InSAR results and the high spatial resolution of airborne LiDAR results could be complementary, highlighting the necessity of multi-resolution data fusion to support studies on coastal flood vulnerability, infrastructure reliability, and erosion control.
Seawater desalination is one of the most popular options to alleviate the water crisis worldwide. Effective management of a seawater desalination system is thus critical. In this study, a fuzzy robust optimization programming model, named FROP, has been proposed to provide robust decision support for seawater desalination management under consideration of environmental pollution control and uncertainty. The major contributions of the proposed FROP model include the following: (1) it is designed for effectively addressing the interactions among seawater desalination development, desalted water distribution, water requirement, and control of environmental pollutant emission within an integrated seawater desalination system; (2) it is an effective decision support tool for decision-makers to provide robust planning strategies through simultaneously considering the optimality robustness and feasibility robustness; (3) it can quantify imprecise and vague uncertainties related to the various aspects of the integrated seawater desalination system expressed as fuzzy parameters; and (4) it can address the tradeoffs among meeting the economic objective and environmental protection requirements and guaranteeing the stability of the system (i.e., risk of violating system constraints) under uncertainty. In order to demonstrate its applicability, the FROP model is applied in a hypothetical seawater desalination management system which is consistent with management schemes in practices. The results indicate that despite a higher total system cost, the management objective and environmental requirements are met, whereas a lower total system cost results in a higher risk of violating the constraints and the possibility of destabilizing the system. The FROP model is helpful for decision-makers to develop robust and cost-effective management schemes for seawater desalination systems under different economic and environmental constraints and complex uncertain conditions.
Limited water availability, population growth, and climate change have resulted in freshwater crises in many countries. Jordan's situation is emblematic, compounded by conflict-induced population shocks. Integrating knowledge across hydrology, climatology, agriculture, political science, geography, and economics, we present the Jordan Water Model, a nationwide coupled human-natural-engineered systems model that is used to evaluate Jordan's freshwater security under climate and socioeconomic changes. The complex systems model simulates the trajectory of Jordan's water system, representing dynamic interactions between a hierarchy of actors and the natural and engineered water environment. A multiagent modeling approach enables the quantification of impacts at the level of thousands of representative agents across sectors, allowing for the evaluation of both systemwide and distributional outcomes translated into a suite of water-security metrics (vulnerability, equity, shortage duration, and economic well-being). Model results indicate severe, potentially destabilizing, declines in freshwater security. Per capita water availability decreases by approximately 50% by the end of the century. Without intervening measures, >90% of the low-income household population experiences critical insecurity by the end of the century, receiving <40 L per capita per day. Widening disparity in freshwater use, lengthening shortage durations, and declining economic welfare are prevalent across narratives. To gain a foothold on its freshwater future, Jordan must enact a sweeping portfolio of ambitious interventions that include large-scale desalinization and comprehensive water sector reform, with model results revealing exponential improvements in water security through the coordination of supply- and demand-side measures.
Quantifying the spatiotemporal distribution of water resources is still a key constraint onwater resources management against the background of climate change and human activities. To investigate the interaction of climate variability and human activities on blue and greenwater scarcity (BWand GW-scarcity), the soil and water assessment tool (SWAT) model was used to simulate BW and GW-scarcity and its spatiotemporal distribution under scenarios of single or combined land-use change and climate variability. Multivariate statistical methods were used to identify the main factors affecting blue/green water and confirm the hot spots of water management. Taking the rapidly-developing Xiangjiang River Basin (XRB) in China as an example, where the urbanization rate increased from 42.15% in 2008 to 56.02% in 2018, the results showed that BW-scarcity was mainly affected by precipitation (r = 0.425) and population (r = -0.612), while GW-scarcity was mainly affected by agriculture (r = 0.429) and urban land (r = -0.593). The hot spot areas of blue and greenwater (BWand GW) shortage accounted for 29.7%, 4.6% and 3.4% of the total area in the lower reach, middle reach and upper reach of XRB, respectively. The rapid development of urbanization in the lower reach of the XRB caused serious shortage of BWand GW resources. This study would provide useful information for water resources management in corresponding human-water system. Future research should focus on how to optimize water resource allocation upstream and downstream of the basin. (c) 2020 Elsevier Ltd. All rights reserved.
The quantification of impervious surface through remote sensing provides critical information for urban planning and environmental management. The acquisition of quality reference data and the selection of effective predictor variables are two factors that contribute to the low accuracies of impervious surface in urban remote sensing. A hybrid method was developed to improve the extraction of impervious surface from high-resolution aerial imagery. This method integrates ancillary datasets from OpenStreetMap, National Wetland Inventory, and National Cropland Data to generate training and validation samples in a semi-automatic manner, significantly reducing the effort of visual interpretation and manual labeling. Satellite-derived surface reflectance stability is incorporated to improve the separation of impervious surface from other land cover classes. This method was applied to 1-m National Agriculture Imagery Program (NAIP) imagery of three sites with different levels of land development and data availability. Results indicate improved extractions of impervious surface with user’s accuracies ranging from 69% to 90% and producer’s accuracies from 88% to 95%. The results were compared to the 30-m percent impervious surface data of the National Land Cover Database, demonstrating the potential of this method to validate and complement satellite-derived medium-resolution datasets of urban land cover and land use.
The utilization of high-resolution aerial imagery such as the National Agriculture Imagery Program (NAIP) data is often hampered by a lack of methods for retrieving surface reflectance from digital numbers. This study developed a new relative radiometric correction method to retrieve 1 m surface reflectance from NAIP imagery. The advantage of this method lies in the adaptive identification of pseudoinvariant (PIV) pixels from a time series of Landsat images that can fully characterize the temporally spectral variations of land surface. The identified PIV pixels allow for an effective conversion of digital numbers to surface reflectance, as demonstrated through the validation at 150 sites across the contiguous United States. The results show substantial improvement in the agreement of NAIP-derived normalized difference vegetation index (NDVI) values with Landsat-derived NDVI reference. Across the sites, root mean square error and mean absolute error were reduced from 0.37 ± 0.14 to 0.08 ± 0.07 and from 0.91 ± 0.64 to 0.18 ± 0.52, respectively. Over 70% PIV pixels on average were derived from vegetated areas, while water and developed areas together contributed 27% of the PIV pixels. As the NAIP program is continuing to generate new images across the country, the advantages of its high spatial resolution, national coverage, long time series, and regular revisits will make it an increasingly crucial data source for a variety of research and management applications. The proposed method could benefit many agricultural, hydrological, and urban studies that rely on NAIP imagery to quantify land surface patterns and dynamics. It could also be applied to improve the preprocessing of high-resolution aerial imagery in other countries.
We calculated the environmental pollution index based on entropy method,analyzed its spatial features of clustering and agglomerating according to Moran scatter plot and LISA gathering figures,and investigated the impact factors of environmental pollution by using the spatial panel data model.The results indicated that the environment pollution level and associated development trend of China presented a certain degree of fluctuations;however,the industrial pollution emissions were relatively stable,and household living pollution became the main source for regional pollution.In addition,the environmental pollution showed strong regional differences,featured by significant spatial clustering and agglomeration.The results also manifested that the influences of different factors on environmental pollution varied in their direction and strength.Specifically,scientific technology,openness,and environmental awareness exerted reverse influences on the environmental pollution.This is because the openness and scientific technology can improve environmental quality,and the environmental awareness can lead to low environmental pollution,but with time-lag effects.Based on those findings,we put forward some suggestions in related policy,including strengthening cooperation in regional environmental governance,moderating agglomeration of population space,enlarging the scale of environmental governance investment,deepening the opening-up level,and encouraging innovation in industrial science and technology.
 Gordon Huang (黄国和)合作论文数Faculty of Engineering and Applied Science, University of Regina;School of Environment, Beijing Normal University23
 Steven Gorelick合作论文数Department of Earth System Science, Stanford University10
 Jingcheng Han (韩京成)合作论文数College of Chemistry and Environmental Engineering, Shenzhen University8
 Zhong Li合作论文数7
 Nicolas Avisse合作论文数7Jim Yoon合作论文数6
 Guangming Zeng (曾光明)合作论文数College of Environmental Science & Engineering, Hunan University6
 Amaury Tilmant合作论文数6Philip Selby合作论文数5Stephen Knox合作论文数5
 Thibaut Lachaut合作论文数5
 Julien Harou合作论文数Department of Mechanical, Aerospace and Civil Engineering, School of Engineering, Faculty of Science and Engineering, The University of Manchester5
 Bernd Klauer合作论文数Technical Computer Sc. Dep., J.W.Goethe-University5
 Samer Talozi合作论文数5
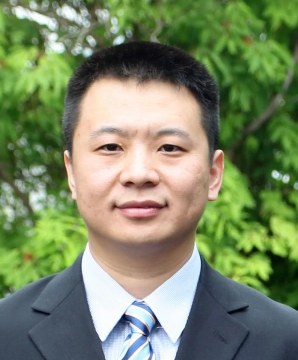 Xiaodong Zhang (张晓东)合作论文数School of Environmental Science and Engineering, Shandong University5
 Christian Klassert合作论文数Department of Bioenergy, UFZ - Helmholtz-Centre for Environmental Research5Katja Sigel合作论文数5
 Daanish Mustafa合作论文数Department of Geography, School of Global Affairs, Faculty of Social Science & Public Policy, King’s College London5
 Zhongwu Li (李忠武)合作论文数School of Geographic Sciences, Hunan Normal University4
 Yongping Li (李永平)合作论文数School of Environment, Beijing Normal Univeristy4
 Erik Gawel合作论文数Helmholtz-Centre for Environmental Research;Department of Economics, University of Leipzig4Dunling Wang合作论文数4
 Paul V Zimba合作论文数Catfish Genetics Research Unit, U.S. Department of Agriculture—Agriculture Research Service4
 Josue Medellin-Azuara合作论文数4Bushra Bataineh合作论文数3deepthi rajsekhar合作论文数3
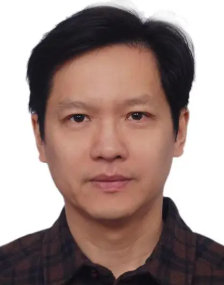 Li He (何理)合作论文数School of Civil Engineering, Tianjin University3
 Jim Lee合作论文数Texas A&M University-Corpus Christi3
 Jianbing Li (李建兵)合作论文数College of Environmental Science & Engineering, Hunan University;University of Northern British Columbia3
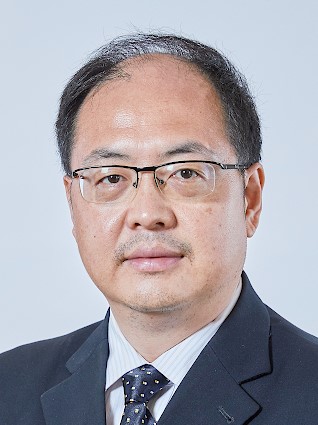 Xiaosheng Qin合作论文数School of Civil and Environmental Engineering, College of Engineering, Nanyang Technological University3YuLing Wan合作论文数2
 Yuxia Huang合作论文数2
 Wen Zhong合作论文数Conrad Blucher Institute for Surveying and Science, Texas A&M University-Corpus Christi2
 Windham-Myers Lisamarie合作论文数U.S. Geological Survey2
 Wang Xiuquan合作论文数School of Climate Change and Adaptation, University of Prince Edward Island2Kevan B. Moffett合作论文数Department of Environmental Earth System Science, Stanford University2
 Philippe Tissot合作论文数Conrad Blucher Institute, Texas A&M University-Corpus Christi2
 Amit Chakma合作论文数The University of Western Australia2
 Chunjiang An合作论文数2
 Yuefei Huang (黄跃飞)合作论文数State Key Laboratory of Hydroscience and Engineering, Department of Hydraulic Engineering, School of Civil Engineering, Tsinghua University2ZHUGE Yi-si (诸葛亦斯)合作论文数1W. C. Christine合作论文数1P. T. Paitoon合作论文数1Manqin Lei合作论文数1Renfei Liao合作论文数1YaXiong Hong合作论文数1Zhenming Wu合作论文数1Zheng Cui合作论文数1
 Brian Baetz合作论文数Department of Civil Engineering, Faculty of Engineering, McMaster University1




