This chapter focuses on the development of some procedures employed in simple linear regression analysis. It explains how to fit a simple linear regression model to a given set of data and perform a residual analysis to check the validity of the model under consideration. The chapter discusses estimation problems for the regression coefficients. It then focuses on developing hypothesis tests concerning these regression parameters. The analysis of variance approach to simple regression analysis is just another technique for the various problems discussed in the chapter. Before presenting this technique in more detail, the chapter defines certain terms commonly used in an analysis of variance. The chapter also explains how to estimate the regression coefficients using the method of least squares, and how to estimate the expected response, predict future observation values, and find their confidence intervals using the given confidence coefficients.
This chapter considers an important class of factorial designs in which each of the k factors has only two levels. Since these designs have exactly 2k treatments, they are usually referred to as 2k factorial designs. The 2k factorial designs are used extensively to study another important class of designs called response surface designs. The chapter explains how to design and conduct special kinds of experiments in engineering or other scientific fields involving two or more factors, when the factors are available at two levels, and discusses how to create blocking appropriately to avoid any kind of confounding. It explores how to create blocking using appropriate interactions when experiments are designed using only one-half or one-quarter replication of a 2k design, and describes the residual analysis to check the adequacy of the models under consideration. The chapter also explains Yates' algorithm for the 2k factorial designs.
Response surface methodology (RSM) allows an experimenter to explore an unknown functional relationship between a response variable Y and k controlled or independent variables. The method was introduced by Box and Wilson. The main goals of RSM are to use a sequence of planned experiments to seek an optimal response and to assess a functional relationship in the neighborhood of the optimal response. This chapter explains various commonly used response surface designs and their analysis. It first considers the problem of fitting polynomials of first-order as well as second-order. Box and Wilson proposed a method of locating the optimum and exploring the response surface in which many factors are varied at the same time. In their work, they proposed the use of the path of steepest ascent to get to a near-stationary region if the experimenter starts at a point far removed from it. The chapter also explains methods to determine the optimum or near-optimum points.
Methods are developed for eliciting a Dirichlet prior based upon stating bounds on the individual probabilities that hold with high prior probability. This approach to selecting a prior is applied to a contingency table problem where it is demonstrated how to assess the prior with respect to the bias it induces as well as how to check for prior-data conflict. It is shown that the assessment of a hypothesis via relative belief can easily take into account what it means for the falsity of the hypothesis to correspond to a difference of practical importance and provide evidence in favor of a hypothesis.
Methods are developed for eliciting a Dirichlet prior based upon bounds on the individual probabilities that hold with virtual certainty. This approach to selecting a prior is applied to a contingency table problem where it is demonstrated how to assess the bias in the prior as well as how to check for prior-data conflict. It is shown that the assessment of a hypothesis via relative belief can easily take into account what it means for the falsity of the hypothesis to correspond to a difference of practical importance and provide evidence in favor of a hypothesis.
A solutions manual to accompany Statistics and Probability with Applications for Engineers and Scientists Unique among books of this kind, Statistics and Probability with Applications for Engineers and Scientists covers descriptive statistics first, then goes on to discuss the fundamentals of probability theory. Along with case studies, examples, and real-world data sets, the book incorporates clear instructions on how to use the statistical packages Minitab® and Microsoft® Office Excel® to analyze various data sets. The book also features:
This set includes Statistics and Probability with Applications for Engineers and Scientists& Solutions Manual to Accompany Statistics and Probability with Applications for Engineers and Scientists.Statistics and Probability with Applications for Engineers and Scientists walks readers through a wide range of popular statistical techniques, explaining step-by-step how to generate, analyze, and interpret data for diverse applications in engineering and the natural sciences.This book features comprehensive guidance on the design of experiments, detailed discussions on sampling distributions, and a clear presentation of nonparametric methods and simple and multiple linear regression methods. Readers will also find clear instructions on how to use the statistical packages Minitab and Microsoft Office Excel to analyze various data sets.This introductory text presents a unique, yet tried-and-true, approach that is ideal for all undergraduate students as well as statistical practitioners who analyze and illustrate real-world data in engineering and the natural sciences.
The need for scale conversion may arise whenever an attitude of individuals is measured by independent entrepreneurs each using an ordinal scale of its own with possibly different numbers of (arbitrary) ordinal categories. Such situations are quite common in the marketing realm. The conversion of a score of an individual measured on one scale into an estimated score of a similar scale with a different range is the concern of this paper. An inferential Bayesian approach is adopted to analyze the situation where we believe the scale with fewer categories can be obtained by collapsing the finer scale. This leads to inferences concerning rules for the conversion of scales. Further, we propose a method for testing the validity of such a model. The use of the proposed methodology is exemplified on real data from surveys concerning performance evaluation and satisfaction.
We discuss the case of the multivariate linear model Y = XB + E with Y an (n × p) matrix, and so on, when there are missing observations in the Y matrix in a so-called nested pattern. We propose an analysis that arises by incorporating the predictive density of the missing observations in determining the posterior distribution of B, and its mean and variance matrix. This involves us with matric-T variables. The resulting analysis is illustrated with some Canadian economic data.
Relative surprise inferences are based on how beliefs change from a priori to a posteriori. As they are based on the posterior distribution of the integrated likelihood, inferences of this type are invariant under relabellings of the parameter of interest. The authors demonstrate that these inferences possess a certain optimality property. Further, they develop computational techniques for implementing them, provided that algorithms are available to sample from the prior and posterior distributions.
Tolerance Regions 14. Toeplitz Lemma to VN-Test This is not the most recent version, view other versionsMost recentTolerance Intervals and Tolerance RegionsK. Krishnamoorthy, Thomas Mathew, First Published: 16 May 2011https://doi.org/10.1002/0471667196.ess2733.pub3This versionTolerance RegionsIrwin Guttman, First Published: 15 August 2006https://doi.org/10.1002/0471667196.ess2733.pub2Tolerance Regions, StatisticalIrwin Guttman, First Published: 15 July 2004https://doi.org/10.1002/0471667196.ess2733 Irwin Guttman, Irwin GuttmanSearch for more papers by this author Irwin Guttman, Irwin GuttmanSearch for more papers by this author First published: 15 August 2006 https://doi.org/10.1002/0471667196.ess2733.pub2Citations: 3 Read the full textAboutPDF ToolsRequest permissionExport citationAdd to favoritesTrack citation ShareShare Give accessShare full text accessShare full-text accessPlease review our Terms and Conditions of Use and check box below to share full-text version of article.I have read and accept the Wiley Online Library Terms and Conditions of UseShareable LinkUse the link below to share a full-text version of this article with your friends and colleagues. Learn more.Copy URL Share a linkShare onFacebookTwitterLinked InRedditWechat Citing Literature Encyclopedia of Statistical SciencesBrowse other articles of this reference work:BROWSE BY TOPICBROWSE A-Z RelatedInformation
This article compares three methods for computing the posterior probabilities of the possible orders in polynomial regression models. These posterior probabilities are used for forecasting using Bayesian model averaging. It is shown that Bayesian model averaging provides a closer relationship between the theoretical coverage of the high-density predictive interval (HDPI) and the observed coverage than those corresponding to selecting the best model. The performance of the different procedures is illustrated with simulations and some known engineering data.
Abstract This paper uses a Bayesian approach to examine the posterior distributions of lin- ear and non-linear functions of variance components,in balanced two-way analysis of variance designs. The paper shows how,exact posterior distributions for such functions can be readily described using Monte Carlo simulations where indepen- dent draws from the distributions are obtained. It is thus very straightforward to obtain percentiles, means, standard deviations, and other summary measures for the posterior distributions. Key Words: ANOVA, Bayesian analysis, Monte Carlo simulation, repeatability,
This paper uses a Bayesian approach to examine the posterior distributions of linear and non-linear functions of variance components in balanced two-way analysis of variance designs. The paper shows how exact posterior distributions for such functions can be readily described using Monte Carlo simulations where independent draws from the distributions are obtained. It is thus very straightforward to obtain percentiles, means, standard deviations, and other summary measures for the posterior distributions.
The thesis of this paper is two-fold, namely that when there is a choice of working with a joint posterior or a marginal posterior, there may be an optimal choice of which posterior to use, so that care must be taken as to which posterior to work with, and, secondly, if using the EM algorithm for producing estimators, care must be taken with the choice of parameters to be declared “missing”, for the wrong choice could lead to inconsistent estimators and/or estimators with poor mean square error behavior. These two propositions are exhibited for well defined hierarchical models in this paper. The indication that a choice of which posteriors to work with should be considered, was first made by (), and this is further discussed in ().
We examine, via a Bayesian analysis, in a general experimental situation, whether it is worthwhile to obtain additional prior information before performing an experiment. Examples illustrate the application of the techniques developed.
This paper explores the question of the choice of whether to use a joint posterior or a marginal posterior as basis for analysis with respect to various parameters of interest. It turns out that in the one-way analysis of variance situation there is an optimal choice. Connections with Empirical Bayes estimation is stressed as well as the use of the EM-algorithm. We demonstrate that for the latter, care must be taken with the choice of parameters to be declared “missing”, for a wrong choice could lead to inconsistent estimators or estimators with poor mean-square behaviour. The discussion is in the context of one-way analysis of variance.
The variable/model selection problem is reexamined from a Bayesian perspective using data splitting to establish a joint prior for the relevent parameters. This allows for the required integrations that have to be performed to be over the same dimensional parameter space. It also produces a result which is independent of the scaling of both the independent as well as dependent variables. The posterior probability of each model M∞ is calculated, where the subscript α is used to index the subsets of the predictor variables. This probability is shown to be asymptotically equal to 1, if Mα is the correct model. A new model selection criterion is also derived from this expression. Examples using simulated data and real data sets are provided.
We consider approximate Bayesian inference about the quantity R = P[Y-2 > Y-1] when both the random variables Y-1, Y-2 have expectations that depend on certain explanatory variables. Our interest centers on certain characteristics of the posterior of R under Jeffreys's prior, such as its mean, variance and percentiles. Since the posterior of R is not available in closed form, several approximation procedures are introduced, and their relative performance is assessed using two real datasets.
When two-level designs are split into blocks of size two, the traditional method is to use mirror-image (foldover) pairs of runs, in which the signs of the factors are completely changed in the second run of the pair. This enables the estimation of all main effects clear of blocks, but of nothing else. We point out that by employing more runs, but still using blocks of size two, all the available effects can be estimated free of blocks. This is useful to know in situations where runs are cheap but the response varies over time, batch, or some other characteristic external to the experimental factors. In general, for a basic 2(k-p) design (p greater than or equal to 0), (k - p)2(k-p) runs needed, with equal replications for all treatment combinations.
 Norman R. Draper合作论文数Department of Statistics, University of Wisconsin-Madison15
 Ulrich Menzefricke合作论文数9
 Michael John Evans合作论文数Biostatistics Division, Dalla Lana School of Public Health, University of Toronto8Norman R Draper合作论文数8
 Benjamin Reiser合作论文数Department of Statistics;University of Haifa;Department of Statistics, University of Haifa7Bhisham C. Gupta合作论文数5Charles D. Palit合作论文数5Rudolf Dutter合作论文数4
 Tim Swartz合作论文数Department of Statistics;Simon Fraser University;Department of Statistics, Simon Fraser University4
 Kalanka Jayalath合作论文数Dept Math & Stat, Univ Houston Clear Lake City3Gc Tiao合作论文数3
 Daniel Pena合作论文数Universidad Carlos III de Madrid3
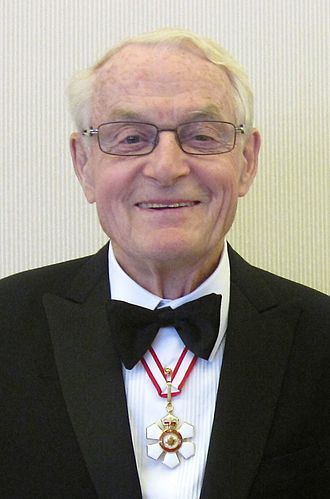 Donald Fraser合作论文数University of Toronto3
 Dennis K.J. Lin合作论文数Department of Statistics, The Pennsylvania State University3Parthasarathy Bagchi合作论文数3Z Gilula合作论文数2
 Zvi Gilula合作论文数Chicago Booth School of Business, The University of Chicago2Wenyong Tan合作论文数2Peiying Li合作论文数2
 Ingram Olkin合作论文数Graduate School of Education, Stanford University;Meta Research Innovation Center, Stanford University2
 John S. Usher合作论文数Department of Industrial Engineering;University of Louisville;Department of Industrial Engineering, University of Louisville2Om P. Aggarwal合作论文数2Yoel Haitovsky合作论文数2Peter R Freeman合作论文数2Muni S. Srivastava合作论文数2Ch Kraft合作论文数1Gep Box合作论文数1JSJ HSU合作论文数1S. K. Sinha合作论文数1
 David Tyler合作论文数1
 Alexander Philip Dawid合作论文数Faculty of Mathematics, University of Cambridge1Philip Hougaard合作论文数H. Lundbeck A/S;University of Southern Denmark1J. A. John合作论文数1
 Richard A. Johnson合作论文数1R. Philips合作论文数1Dolores Redondas合作论文数1Ram C. Dahiya合作论文数1Robert Philips合作论文数1
 George C. Tiao (刁锦寰)合作论文数Booth School of Business, The University of Chicago1Raj S. Chhikara合作论文数1
 David Faraggi合作论文数Department of Statistics;University of Haifa;Department of Statistics, University of Haifa1F. M. Guess合作论文数1Andrey Feuerverger合作论文数1
 George D Papandonatos合作论文数Department of Biostatistics, School of Public Health, Brown University;Center for Statistical Sciences, Brown University1D. Pe?Na合作论文数1SR CHAKRAVORTI合作论文数1
 Jack Gambino合作论文数Statist1GK BHATTACHARYYA合作论文数1




