Eutrophication is the excessive growth of algae in water bodies that causes biodiversity loss, reducing water quality and attractiveness to people. This is an important problem in water bodies. In this paper, we propose a low-cost sensor to monitor eutrophication in concentrations between 0 to 200 mg/L and in different mixtures of sediment and algae (0, 20, 40, 60, 80, and 100% algae, the rest are sediment). We use two light sources (infrared and RGB LED) and two photoreceptors at 90° and 180° of the light sources. The system has a microcontroller (M5stacks) that powers the light sources and obtains the signal received by the photoreceptors. In addition, the microcontroller is responsible for sending information and generating alerts. Our results show that the use of infrared light at 90° can determine the turbidity with an error of 7.45% in NTU readings higher than 2.73 NTUs, and the use of infrared light at 180° can measure the solid concentration with an error of 11.40%. According to the determination of the % of algae, the use of a neural network has a precision of 89.3% in the classification, and the determination of the mg/L of algae in water has an error of 17.95%.
Recently, Panama wilt disease that attacks banana leaves has caused enormous economic losses to farmers. Early detection of this disease and necessary preventive measures can avoid economic damage. This paper proposes an improved method to predict Panama wilt disease based on symptoms using an agro deep learning algorithm. The proposed deep learning model for detecting Panama wilts disease is essential because it can help accurately identify infected plants in a timely manner. It can be instrumental in large-scale agricultural operations where Panama wilts disease could spread quickly and cause significant crop loss. Additionally, deep learning models can be used to monitor the effectiveness of treatments and help farmers make informed decisions about how to manage the disease best. This method is designed to predict the severity of the disease and its consequences based on the arrangement of color and shape changes in banana leaves. The present proposed method is compared with its previous methods, and it achieved 91.56% accuracy, 91.61% precision, 88.56% recall and 81.56% F1-score.
Cities are big consumers of energy and big producers of pollution. In the past years, the concept of smart cities has been applied to reduce the release of pollutants and to reduce energy consumption. In this article, we present a wireless sensor network (WSN) based on solid sensor nodes to detect illicit discharges in sewerage. The solid sensor is an optical sensor that uses infrared light to determine the pollutant concentration in water. At 0°, a photoreceptor receives infrared LED (IR LED) light and allows the current passage. This provokes a reduction of the internal resistance of the photoreceptor that can be measured. First, we tested different intensities of powered LEDs and resistances in the voltage divider. Once the best combinations had been selected, we calibrated our sensor. Our result suggested that the relative error of our prototype is 3.4% in the range of 200–5000 mg/L.
The Bachelor's Degree in Environmental Sciences is a university degree that was created due to the growing environmental awareness of society. Report writing and critical analysis of results are particularly important matters in this grade. To improve these two abilities through the Materials and Energy Management subject of the 4th year we have studied a methodology based on the retaking of the first practice report.. We have seen that in the years that this retaking has been requested an increase in the students' grades has been observed. This increase was higher the first year, where their grades increased an average of 3.2 points (over 10). Furthermore, the mark of the second report improved an average of 2.28 points from the first report in the 2019-2020 academic year. It is to be noted that, in the year that there were no retakes from the first practice, no improvement was observed in the grade between the first and second reports. Therefore, it is necessary to "force" students to correct the first report so that they improve in writing them.
El grado en Ciencias Ambientales es un grado universitario que se crea debido a la creciente conciencia ambiental de la sociedad. En este grado es muy importante la redacción de informes y el análisis crítico de los resultados. Para mejorar estos dos aspectos desde la asignatura de Gestión de Materiales y Energía del 4º año hemos estudiado una metodología basada en la recuperación del primer informe que entregan.Hemos visto que en los años que se ha solicitado esta recuperación hay un aumento en las notas de los alumnos. Este aumento fue máximo en el primer curso donde se obtiene un aumento de la calificación en 3.2 puntos entre la primera entrega y la recuperación. Además de una mejora máxima de 2.28 puntos entre el primer informe que entregan y el segundo en el curso 2019-2020. En cambio, en el año que no se realizaron recuperaciones de la primera practica no se observó una mejoría de la nota entre el primer y segundo informe que entregan. Por tanto, es necesario “obligar” a los alumnos a corregir el primer informe para que mejoren en la redacción de sus informes.
Storm sewerages are crucial infrastructures in water management. In this paper, a system was developed to detect the blockage of the sewerage and the presence of illegal spills in Storm sewerages. Different nodes with sensors measuring the water level, turbidity, conductivity, and oil presence are scattered in the sewerage. These nodes are connected to a master node for processing the information with a rain sensor. The rain and water level sensors are used to determine one of the four possibilities regarding the presence of water in the sewerage and whether it is raining. According to the combinations, it can be determined whether it is a normal situation or there are spills or blockages. It is shown that there are differences between sewerage with and without blockage via the water level. This can be used to determine the presence of a blockage. The identification of an illegal spill is performed with the use of conductivity, turbidity, and oil sensors. The authors determined that yellow and infrared light can determine the oil concentration in the oil sensor in a range of 0-2.2 mL oil/L water with yellow light and 0.4-20 mL oil/L water with infrared light. Finally, the conductivity sensor can determine water conductivity from 0.526 to 58.4 mS/cm.
The presence of illicit discharges in sewerage systems generates an important impact in wastewater treatment plants and the ecosystem. In this paper, we present two prototypes for monitoring the presence of solids in wastewater and to study the effect of the water height. The prototypes are based on color and infrared LEDs and two photosensors located in the prototypes at 0° and 180° degrees. When the photosensor is located at 180°, all color LEDs present a good range of output voltage (approximately 5 V to 0 V) and good R2. However, for the typical concentration of solids in wastewater, the prototypes do not work correctly. When the photosensor is located in the prototypes the LEDs, yellow, red, and white have a good operation with voltage differences of 1.73 V, 1.76 V, and 1.13 V in P1 and 1.58 V, 1.84 V, and 1.35 V in P2, respectively. We calculate the mathematical model with the heights and solid concentration. The mathematical models which do not consider height present good R2. In conclusion, when the photosensor is located in the prototype, the height does not have an important effect and can detect the illicit discharge of solids. When the photosensor is located at 180°, it can be used for water with important changes in solid concentrations.
Uncontrolled dumping linked to agricultural vehicles causes an increase in the incorporation of oils into the irrigation system. In this paper, we propose a system based on an optical sensor to monitor oil concentration in the irrigation ditches. Our prototype is based on the absorption and dispersion of light. As a light source, we use Light Emitting Diodes (LEDs) with different colours (white, yellow, blue, green, and red) and a photodetector as a sensing element. To test the sensor’s performance, we incorporate industrial oils used by a diesel or gasoline engine, with a concentration from 0 to 0.20 mLoil/cm2. The experiment was carried out at different water column heights, 0 to 20 cm. According to our results, the sensor can differentiate between the presence or absence of diesel engine oil with any LED. For gasoline engine oil, the sensor quantifies its concentration using the red light source; concentrations greater than 0.1 mLoil/cm2 cannot be distinguished. The data gathered using the red LED has an average absolute error of 0.003 mLoil/cm2 (relative error of 15.8%) for the worst case, 15 cm. Finally, the blue LED generates different signals in the photodetector according to the type of oil. We developed an algorithm that combines (i) the white LED, to monitor the presence of oil; (ii) the blue LED, to identify if the oil comes from a gasoline or diesel engine; and (iii) the red LED, to monitor the concentration of oil used by a gasoline engine.
Soil moisture control is crucial to assess irrigation efficiency in green areas and agriculture. In this paper, we propose the design and calibration of a sensor based on inductive coils and electromagnetic fields. The proposed prototypes should meet a series of requirements such as low power consumption, low relative error, and a high voltage difference between the minimum and maximum moisture. We tested different prototypes based on two copper coils divided into two different sets (P1–P15 and NP1–NP4). The prototypes have different characteristics: variations in the number and distribution of spires, existence or absence of casing, and copper wires with a diameter of 0.4 or 0.6 mm. In the first set of experiments carried out in commercial soil, the results showed that the best prototypes were P5, P8, and P9. These prototypes were used in different types of soils, and P8 was selected for the subsequent tests. We carried the second set of experiments using soil from an agricultural field. Based on the data gathered, mathematical models for the calibration of prototypes were obtained and verified. In some cases, two equations were used for different moisture intervals in a single prototype. According to the verification results, NP2 is the best prototype for monitoring the moisture in agricultural lands. It presented a difference in induced voltage of 1.8 V, at 500 kHz, between wet and dry soil with a maximum voltage of 5.12 V. The verification of the calibration determined that the calibration using two mathematical models offers better results, with an average absolute error of 2.1% of moisture.
In irrigation ponds, the excess of nutrients can cause eutrophication, a massive growth of microscopic algae. It might cause different problems in the irrigation infrastructure and should be monitored. In this paper, we present a low-cost sensor based on optical absorption in order to determine the concentration of algae in irrigation ponds. The sensor is composed of 5 LEDs with different wavelengths and light-dependent resistances as photoreceptors. Data are gathered for the calibration of the prototype, including two turbidity sources, sediment and algae, including pure samples and mixed samples. Samples were measured at a different concentration from 15 mg/L to 4000 mg/L. Multiple regression models and artificial neural networks, with a training and validation phase, are compared as two alternative methods to classify the tested samples. Our results indicate that using multiple regression models, it is possible to estimate the concentration of alga with an average absolute error of 32.0 mg/L and an average relative error of 11.0%. On the other hand, it is possible to classify up to 100% of the samples in the validation phase with the artificial neural network. Thus, a novel prototype capable of distinguishing turbidity sources and two classification methodologies, which can be adapted to different node features, are proposed for the operation of the developed prototype.
The increase of the industrial sector and the use of mechanical devices in agriculture causes the increment of oil discharges in water bodies that are used to irrigate agricultural lands. In this context, precision agriculture becomes a critical way to solve these problems. In this paper, we propose an optical sensor to detect and monitor the quantity of oil in the agricultural irrigation system. The sensors use different colour light sources (white, yellow, blue, green, orange, and near-infrared). Moreover, a photoresistor and photodiode are located at 0° and 180° of the light source to measure the light dispersion. This prototype will be part of a wireless sensor network that allows obtaining the values in real-time in river channels. We experimented using different oil concentrations, between 0 and 0.2 ml oil/cm 2 . In addition, we analyse the output voltage changes between the different light sources for all oil quantities. The results show that the lowest difference is found for the white colour with 0.025 V. Then, the yellow and blue light sources obtained a change of 0.089 and 0.075 V respectively. On the other hand, the highest voltages are found for the green and red clours, with 0.29 and 0.39 V. The mathematical models of the bests Light Sources are calculated, obtaining the correlation coefficients of 0.9604 in the red light and 0.8647 in the green light. Finally, we perform a multirange analysis with the values of the different light sources, verifying that the red and green light sources have the most reliable values.
The monitoring of water level in the agriculture irrigation channels is essential to control the opening gates of these channels. In this way, WSNs (Wireless Sensor Networks) have high relevance to obtain this kind of data. In this paper, we propose a sensor to measure the depth changes in irrigation channels to control the gates opening. It is connected to an Adafruit Feather HUZZAH based on ESP8266, which allows us to build a mobile edge computing system. The developed sensor is based on two coils. Sinus-wave powers the first one, and the second is induced. The coils are winding over a polyvinyl chloride (PVC) that has high resistance for corrosion and low price. Besides, we use copper wire as a conductive metal. We test two different configurations of coils. P1 has five spires for the powered coil (PC) and ten spires for the induced coil (IC). On the other hand, P2 has 40 spires for the PC and 80 spires for the IC. The two prototypes were coiled in one layer. Then, both sensors are tested using a glass bottle where the water column increased with the target to obtain the information of the depth. In both prototypes, the difference of voltage between the maximum and minimum studied depths is more or less the same, 4.46V for P1 and 4.44V for P2. Nevertheless, during the stabilization test, the P1 showed better adaptation for the turbulences than the P2. The P1 shows an oscillation of 0.48V, where the P2 has a maximum fluctuation of 3.2V.
Water is an increasingly scarce resource today due to natural and anthropic factors. Therefore, wastewater treatment and reuse is an important parameter of sustainable development. The necessity of reuse wastewater especially for irrigation becomes evident. Innovative wastewater monitoring and treatment methodologies are finding application as technologies improve. The most talented technological advances include: innovative monitoring techniques based on new sensors, computerized telemetry devices, and innovative data analysis tools. Research on sensor and alarming systems is advancing rapidly. Likewise, new methods for wastewater treatment are continually introduced, including the use dead plants biomass for heavy metals removal from wastewater. In this paper, the use of sensors for monitoring and the application of biosorption techniques for wastewater recycling are discussed and evaluated. We propose biosorption for removing heavy metals from wastewater. Sensors are used before and after the biosorption for check the quality of water and the proper functioning of the biosorption process.
Water management for irrigation purposes is especially decisive in places prone to droughts because soil moisture sensors are economically unattainable for farmers. The sustainable usage of water should not be restricted by the elevated price of the system. In this paper, we present a low-cost sensor for the monitoring of soil moisture, which can be part of a smart irrigation system. The sensor is composed of two coils, one is powered with alternate current and the other one is used to measure the induced voltage. It is based on conductivity and uses the method of mutual inductance. We study five prototypes, which have different numbers of turns in each coil. We compare them in order to determine the best model. The best sensor is the one that consists of one coil with 40 turns (which is powered) and one with 100 turns (which is induced). The best frequency is 260 kHz, the coil is induced with 10 peak to peak voltage and the induced voltage, which is measured with an oscilloscope, changes with the soil moisture. At this frequency, the sensor presents the biggest difference in volts. The differences are 1.2 V between 0 and 6
The incorrect fertilization of the crops can cause problems in the environment and extra costs. A solution is to perform fertigation controlling the amount of fertilizer in the water. In this paper, we test different combinations of coils for determining the amount of fertilizer in the water. A coil is powered by a sine wave of 3.3 peak-to-peak Volts for inducing another coil. These sensors will be included in a smart irrigation tube as a part of a smart irrigation system based on the Internet of Things (IoT). The aim of this system is to detect different sorts of problems that can cause incorrect fertilization, which affects the sustainability of agriculture. This system can be used in different scenarios where tubes are used to irrigate. We present the performed test to evaluate the suitability of the created prototypes. At first, we test with different dilutions of NaCl (table salt) and, after it, we performed tests with nitromagnesium (a fertilizer). We checked that at the same salinity the induction value changes if it is found in water with NaCl or nitromagnesium. Of all the tested prototypes it is concluded that the prototype P2 is the most optimal g/L because there is a difference in the induced voltage between 0 and 45 g/L of nitromagnesium of 3.79 V with a good correlation coefficient. In addition, the average error in the different samples tested in the verification test is 2.15%.
The Obstructive Sleep Apnea (OSA) is a disorder that causes frequent pauses in breathing during sleep. This disorder can cause early death, hypertension, etc. Approximately the 4% of the population suffers this disorder. In order to diagnose, it is required a polysomnography (PSG) which s is an expensive test and requires the patient’s hospitalization for at least one night This paper presents a system able to detect the OSA during sleep. Our system consists of a sound sensor, a vibrating element and a microcontroller to process the collected data. The sound sensor is placed in the pillow and includes a vibrating element that wakes the user when the OSA event is too long. The sensor and actuator are connected to a microcontroller which includes an IEEE 802.11 interface to be connected to an Access Point (AP). The collected values are processed and sent to a database. The system works analyzing the sound of snoring. Our system can difference 5 different types of snoring: (I) no snoring, (II) movement (III) normal snoring, (IV) snoring before OSA, and (V) OSA. After that, the values of OSA events are checked by the doctor to take, if needed, the appropriate actions. The results show that we can differentiate the different snoring types thanks to the sound level and the distribution curve. Finally, the system has been verified with a patient with OSA diagnosis and our results coincide with the type of diagnosis and type of snoring that the patient received in his medical report.
The sewerage is a critical infrastructure in cities because of the drainage of the urban runoff and the evacuation of the wastewater. Two types of sewerage, separated sewerage and combined sewerage, can be differentiated. In this paper, we show the application of a level sensor and a rain sensor for monitoring the separated sewerage. The level sensor is used for knowing if there is a critical level of water in the sewerage. The rain sensor is used to know if it is raining. The combination of this information allows the identification of three scenarios. These scenarios are normal situation, low drainage and illicit discharge/blockages in the pipeline. In addition, we study the use of sensors and mathematical models for monitoring the velocity of the wastewater. We concluded that the use of mathematical models is a good option for monitoring the velocity. Because with exception of the thermal sensors the other types of sensors show important gaps. The velocity is used to estimate the flow that is dumping in the water bodies. We use an ESP32 board program with Arduino IDE for data collection and sending the data to a server on the same network via Wi-Fi. The server is a computer that processes the data. We present the programming code and the ports that should be used for transmitting the data from Arduino to computer server.
 Jaime Lloret Mauri合作论文数Department of Communications, Polytechnic University of Valencia33
 Lorena Parra合作论文数Inst Invest Gest Integrada Zonas Costeras, Univ Politecn Valencia23
 Daniel A. Basterrechea合作论文数Inst Invest Gest Integrada Zonas Costeras, Univ Politecn Valencia11
 Sandra Sendra合作论文数Instituto de Investigación para la Gestión Integrada de zonas Costeras, Universidad Politécnica de Valencia9
 Mar Parra合作论文数Inst Invest Gest Integrada Zonas Costeras, Univ Politecn Valencia8
 Pedro V. Mauri合作论文数Instituto Madrileño de Investigación y Desarrollo Rural;El Encín;El Encín, Instituto Madrileño de Investigación y Desarrollo Rural6
 Jose Marin合作论文数AreaVerde MG Projects5
 Miran Taha合作论文数Dept Comp Sci, Univ Sulaimani4
 j mengual合作论文数Instituto de Tecnología Química, Universitat Politècnica de València - Consejo Superior de Investigaciones Científicas (UPV-CSIC),4
 José Luis García-Navas合作论文数Polytechnic University of Valencia3
 Jesus Tomas合作论文数Department of Communications Camino Vera, Polytechnic University of Valencia3Silvia Falco合作论文数2Juan Andrés González Romero合作论文数2Jaime Lloret合作论文数2
 Alberto Ivars-Palomares合作论文数2
 Jose Jimenez合作论文数2
 Sandra Viciano-Tudela合作论文数Instituto de Investigación para la Gestión Integrada de Zonas Costeras, Universitat Politècnica de València2
 Laura García合作论文数Univ Politecn Valencia, Inst Invest Gest Integrada Zonas Costeras IGIC, Camino Vera S-N, E-46022 Valencia, Spain2Óscar Romero合作论文数2
 Miguel Rodilla合作论文数Universidad Politécnica de Valencia2
 Bernat Roig Merino合作论文数2Maria-Teresa Sebastia-Frasquet合作论文数1Julia Escrivá合作论文数1
 Jaganathan Logeshwaran合作论文数1
 Mohamed Omar合作论文数Technol & Maritime Transport, Arab Acad Sci, Sci Res Deanery1
 Abdulaziz Aldegheishem合作论文数King Saud Univ, Coll Architecture & Planning, Urban Planning Dept, Traff Safety Technol Chair, Riyadh 11574, Saudi Arabia1
 Albert Rego合作论文数Univ Politecn Valencia, Valencia, Spain1
 Manal Fawzy合作论文数Faculty of Medicine, Suez Canal University1Llinares Josep合作论文数1
 Lei Shu (舒磊)合作论文数College of Artificial Intelligence, Nanjing Agricultural University;NAU-Lincoln Joint Research Center of Intelligent Engineering;Beyond Intelligent Phytoprotection Research Institute, Nanjing Agricultural University;School of Engineering, College of Health and Science, University of Lincoln1
 Alberto Masaguer合作论文数1
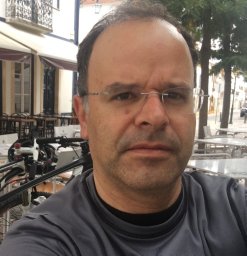 Luis M. L. Oliveira合作论文数Universidade da Beira Interior, University of Beira Interior1
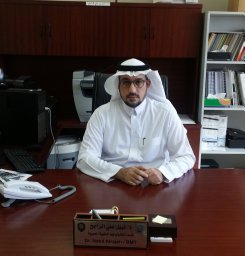 Nabil Alrajeh合作论文数King Saud University1
 Antonio Plaza合作论文数Hyperspectral Computing Laboratory, Department of Technology of Computers and Communications, Escuela Politécnica de Cáceres, University of Extremadura;School of Artificial Intelligence, Xidian University1




