S1 GC collections and calibrations S1.1 Routine field collectionsRoutinely, 2-3 sets of chromatograms were collected each day where each set consisted of a zero collection, two ambient sample collections, and a zero collection.The times of day chosen for each set were morning (~8:00 CDT),
Methane (CH4) emissions from natural landscapes constitute roughly half of global CH4 contributions to the atmosphere, yet large uncertainties remain in the absolute magnitude and the seasonality of emission quantities and drivers. Eddy covariance (EC) measurements of CH4 flux are ideal for constraining ecosystem-scale CH4 emissions due to quasi-continuous and high-temporal-resolution CH4 flux measurements, coincident carbon dioxide, water, and energy flux measurements, lack of ecosystem disturbance, and increased availability of datasets over the last decade. Here, we (1) describe the newly published dataset, FLUXNET-CH4 Version 1.0, the first open-source global dataset of CH4 EC measurements (available at https://fluxnet.org/data/fluxnet-ch4-community-product/, last access: 7 April 2021). FLUXNET-CH4 includes half-hourly and daily gap-filled and non-gap-filled aggregated CH4 fluxes and meteorological data from 79 sites globally: 42 freshwater wetlands, 6 brackish and saline wetlands, 7 formerly drained ecosystems, 7 rice paddy sites, 2 lakes, and 15 uplands. Then, we (2) evaluate FLUXNET-CH4 representativeness for freshwater wetland coverage globally because the majority of sites in FLUXNET-CH4 Version 1.0 are freshwater wetlands which are a substantial source of total atmospheric CH4 emissions; and (3) we provide the first global estimates of the seasonal variability and seasonality predictors of freshwater wetland CH4 fluxes. Our representativeness analysis suggests that the freshwater wetland sites in the dataset cover global wetland bioclimatic attributes (encompassing energy, moisture, and vegetation-related parameters) in arctic, boreal, and temperate regions but only sparsely cover humid tropical regions. Seasonality metrics of wetland CH4 emissions vary considerably across latitudinal bands. In freshwater wetlands (except those between 20∘ S to 20∘ N) the spring onset of elevated CH4 emissions starts 3 d earlier, and the CH4 emission season lasts 4 d longer, for each degree Celsius increase in mean annual air temperature. On average, the spring onset of increasing CH4 emissions lags behind soil warming by 1 month, with very few sites experiencing increased CH4 emissions prior to the onset of soil warming. In contrast, roughly half of these sites experience the spring onset of rising CH4 emissions prior to the spring increase in gross primary productivity (GPP). The timing of peak summer CH4 emissions does not correlate with the timing for either peak summer temperature or peak GPP. Our results provide seasonality parameters for CH4 modeling and highlight seasonality metrics that cannot be predicted by temperature or GPP (i.e., seasonality of CH4 peak). FLUXNET-CH4 is a powerful new resource for diagnosing and understanding the role of terrestrial ecosystems and climate drivers in the global CH4 cycle, and future additions of sites in tropical ecosystems and site years of data collection will provide added value to this database. All seasonality parameters are available at https://doi.org/10.5281/zenodo.4672601 (Delwiche et al., 2021). Additionally, raw FLUXNET-CH4 data used to extract seasonality parameters can be downloaded from https://fluxnet.org/data/fluxnet-ch4-community-product/ (last access: 7 April 2021), and a complete list of the 79 individual site data DOIs is provided in Table 2 of this paper.
This dataset contains metadata for methane flux sites in Version 1.0 of FLUXNET-CH4. The dataset also has seasonality parameters for select freshwater wetlands, which were extracted from the raw datasets published at https://fluxnet.org/data/fluxnet-ch4-community-product/. These data are used to analyze global methane flux seasonality patterns in the paper "FLUXNET-CH4: A global, multi-ecosystem dataset and analysis of methane seasonality from freshwater wetlands" by Delwiche et al.
Improvements in numerical weather and climate modeling depend on accurate accounting of land-atmosphere interactions and the biological processes that mediate them at multiple spatial and temporal scales.Unfortunately, there is a problematic, persistent mismatch between the scales of observations and models.The substantial heterogeneity of the land surface means that observations do not always accurately reflect the entire model grid cell.Therefore, spatial and temporal scaling of surface fluxes is fundamental to how we evaluate theories on what happens within the subgrid of atmospheric models and how it feeds back onto larger-scale dynamics.This scaling is thus fundamental to assessing the parameterizations that represent land-atmosphere interactions in atmospheric models.
The Chequamegon Heterogeneous Ecosystem Energy-Balance Study Enabled by a High-Density Extensive Array of Detectors 2019 (CHEESEHEAD19) is an ongoing National Science Foundation project based on an intensive field campaign that occurred from June to October 2019. The purpose of the study is to examine how the atmospheric boundary layer (ABL) responds to spatial heterogeneity in surface energy fluxes. One of the main objectives is to test whether lack of energy balance closure measured by eddy covariance (EC) towers is related to mesoscale atmospheric processes. Finally, the project evaluates data-driven methods for scaling surface energy fluxes, with the aim to improve model–data comparison and integration. To address these questions, an extensive suite of ground, tower, profiling, and airborne instrumentation was deployed over a 10 km × 10 km domain of a heterogeneous forest ecosystem in the Chequamegon–Nicolet National Forest in northern Wisconsin, United States, centered on an existing 447-m tower that anchors an AmeriFlux/NOAA supersite (US-PFa/WLEF). The project deployed one of the world’s highest-density networks of above-canopy EC measurements of surface energy fluxes. This tower EC network was coupled with spatial measurements of EC fluxes from aircraft; maps of leaf and canopy properties derived from airborne spectroscopy, ground-based measurements of plant productivity, phenology, and physiology; and atmospheric profiles of wind, water vapor, and temperature using radar, sodar, lidar, microwave radiometers, infrared interferometers, and radiosondes. These observations are being used with large-eddy simulation and scaling experiments to better understand submesoscale processes and improve formulations of subgrid-scale processes in numerical weather and climate models.
This report reviews 2012-2013 field season activities of the University of Wisconsin-Madison's Antarctic Automatic Weather Station (AWS) program, summarizes the science that these sites are supporting, and outlines the factors that impact the number of AWS sites serviced in any given field season. The 2012-2013 austral summer season was unusual in the AWS network history. Challenges encountered include, but are not limited to, warmer than normal conditions in the Ross Island area impacting airfield operations, changes to logistical procedures, and competition for shared resources. A flexible work plan provides the best means for taking on these challenges while maximizing AWS servicing efforts under restricted conditions and meeting the need for routine servicing that maintaining an autonomous observing network demands.
During the 2011-2012 austral summer, the Antarctic Automatic Weather Station (AWS) program at the University of Wisconsin?Madison completed its 32nd year of observations. Ongoing studies utilizing the network include topics in Antarctic meteorology and climate studies. This field season consisted of work throughout the Ross Island area, the Ross Ice Shelf, West Antarctica, and East Antarctica. Argos satellite transmissions are the primary method for relaying station data, but throughout this year, a number of stations in the Ross Island area have been converted to Freewave modems, with their data being relayed through McMurdo station. Each AWS station report contains information regarding the instrumentation currently installed and the work performed at each site. An overview of the AWS applications is included along with field work accomplished.
Antarctica boasts one of the world's harshest environments. Since the earliest expeditions, a major challenge has been to characterize the surface meteorology around the continent. In 1980, the University of Wisconsin—Madison (UW-Madison) took over the U.S. Antarctic Program (USAP) Automatic Weather Station (AWS) program. Since then, the UW-Madison AWS network has aided in the understanding of unique Antarctic weather and climate. This paper summarizes the development of the UW-Madison AWS network, issues related to instrumentation and data quality, and some of the ways these observations have and continue to benefit scientific investigations and operational meteorology.
 George A. Weidner合作论文数14
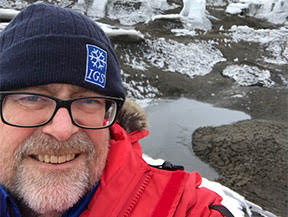 Douglas R. MacAyeal合作论文数Department of the Geophysical Sciences, The University of Chicago12Matthew A. Lazzara合作论文数11
 Ankur Desai合作论文数Department of Civil and Environmental Engineering, College of Engineering, University of Wisconsin-Madison10Linda M. Keller合作论文数9
 John Cassano合作论文数Department of Atmospheric and Oceanic Sciences, College of Arts and Sciences, University of Colorado Boulder;National Snow and Ice Data Center, Cooperative Institute for Research in Environmental Sciences, University of Colorado7Charles R. Stearns合作论文数6
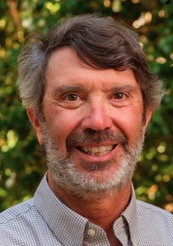 Dennis D. Baldocchi合作论文数Department of Environmental Science, Policy and Management, University of California, Berkeley6Lee J. Welhouse合作论文数5
 David Y. Hollinger (David Hollinger)合作论文数Northern Research Station, USDA Forest Service5
 Oliver Sonnentag合作论文数Department of Geography and Planning, University of Toronto5
 Andrew Richardson合作论文数School of Informatics, Computing, and Cyber Systems, Northern Arizona University5
 Eugenie Euskirchen合作论文数Department of Biology and Wildlife, College of Natural Science & Mathematics, University of Alaska Fairbanks;Institute of Arctic Biology, University of Alaska Fairbanks;Department of Veterinary Medicine, University of Alaska Fairbanks5Shelley L. Knuth合作论文数5Lars E. Kalnajs合作论文数5
 Donatella Zona合作论文数Global Change Research Group, San Diego State University;Department of Animal and Plant Sciences, University of Sheffield;San Diego State University, University of Sheffield4
 Rodrigo Vargas合作论文数School of Life Sciences, Arizona State University;Department of Plant and Soil Sciences, University of Delaware4
 Paul Stoy合作论文数School of GeoSciences, University of Edinburgh4
 Kelly M. Brunt合作论文数Department of Geophysical Sciences;University of Chicago;Department of Geophysical Sciences, University of Chicago4Jaclyn Hatala Matthes合作论文数3Ellen Stuart‐Haëntjens合作论文数3maria tsukernik合作论文数3David Mikolajczyk合作论文数3Janina Klatt合作论文数3Avni Malhotra合作论文数3snarski joseph合作论文数3p y oikawa合作论文数3
 Dario Papale合作论文数3Mangaliso Gondwe合作论文数3
 Thomas Friborg合作论文数Department of Geosciences and Natural Resource Management, Faculty of Science, University of Copenhagen3Olli Peltola合作论文数3Michael Vermeuel合作论文数Dept Chem, Univ Wisconsin3
 GX WONG合作论文数Sarawak Trop Peat Res Inst3
 Eleonora Canfora合作论文数3
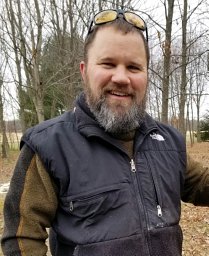 Brandon Forsythe合作论文数Penn State Univ, University Pk3
 Sarah Feron合作论文数UFSM Federal University of Santa Maria3Jordan Goodrich合作论文数School of Science, University of Waikato3a k bliss合作论文数Dept Anthropol & Geog, Colorado State Univ3
 Alex Valach合作论文数Dept Environm Sci Policy & Management, Univ Calif Berkeley3Joseph Verfaillie合作论文数3
 Timothy Hector Morin合作论文数Corresponding author.3
 Danielle S. Christianson合作论文数3Daphne Szutu合作论文数Dept Environm Sci Policy & Management, Univ Calif Berkeley3
 Weinan Chen (陈炜楠)合作论文数3Patricia A. Cleary合作论文数3Adrien Jacotot合作论文数3
 Kyle S Hemes合作论文数Woods Institute for the Environment, Stanford University3Kathrin Fuchs合作论文数Univ Bayreuth, Dept Micrometeorol, Bayreuth, Germany3
 e fluetchouinard合作论文数Univ Wisconsin, Madison, WI 53706 USA3




