Supplementary Table 3 from Whole Genome Comparison of Allelic Imbalance between Noninvasive and Invasive Small-Sized Lung Adenocarcinomas
Expression of miRNAs in non-responders (NR) and responders (R) in the validation cohort as measured by qRT-PCR.
Supplementary Figure 4. Effect of KAT6B shRNA-mediated depletion in the growth rate according to the XTT assay
PDF file 236K, Table S1. List of the 121 lung cancer cell lines screened for MAX alterations. Information about the histopathology of each cell line, and the presence of alterations at MYC and BRG1 is also included. Grey boxes indicate that no information is available. Table S2. List of genes that are up-regulated or down-regulated upon MAX reconstitution. The values represent the n-fold change in the level of gene expression of each of the lung cancer cell lines infected with the wild type MAX relative to the controls (?). Table S3. List of genes that are up-regulated or down-regulated upon depletion of BRG1. The values represent the n-fold change in the level of gene expression of each of the lung cancer cell lines infected with the shBRG1 relative to the controls ?. Table S4. List of the cell lines included in Figure 5. The information about alterations at the indicated genes was obtained from different sources, as indicated. For data extracted from databases we applied the following criteria to define a mutation: i) mutations at tumor suppressor genes (BRG1, SMARCB1, MAX, ARID1A, PRBM1, and MGA) should be homozygous and predictive of truncated proteins, ii) for amplification at the MYC family of oncogenes, only very high levels of gene amplification have been considered to be positive. Other genes, related to MYC/MAX or to the SWI/SNF complex, have also been searched for alterations (i.e., ARID1B, ARID2, MXI, MXDs) but either no alterations were reported in the databases or the changes did not fulfill our selection criteria. CCLE, Cancer Cell Line Encyclopedia (Broad-Novartis Cancer Cell Line Encyclopedia; website, http://www.broadinstitute.org/ccle/). COSMIC, Catalogue of Somatic Mutations in Cancer (Trust Sanger Institute's Cancer Cell Line Project; website, http://cancer.sanger.ac.uk/)
PDF file 422K, Fig. S1. Radio charts of the multiplex ligation-dependent probe amplification (MLPA), depicting intragenic deletions at the indicated lung cancer cell lines and lung primary tumor. The five exons of the MAX gene and the names and the relative location of the different probes used in the MLPA are also shown. The ratio charts depicting a the analysis of a normal DNA, an intragenic deletion of exons from 3 to 5 for the Lu134 cell line and deletion of the entire coding region for the Lu165 cell line are included. The radio chart for the tumorgraft from the same individual as the Lu134 cells is also depicted, ruling out the possibility of it being a cellculture artifact. Fig. S2. A, Cell proliferation, measured using MTT assays, was significantly greater in the cells carrying the empty vector (? control cells) than in those expressing ectopic MAX, from the parental H1417 cells. Lines represent the number of viable cells relative to the total number of cells at 0 h. Error bars, standard deviation *p<0.001. B, Western blot of total lysates of MAX in H1299tr-BRG1wt and H1299tr-BRG1mut cells, treated with (1 ng/μl) to allow BRG1 expression, depicts the ectopic expression of MAX in a hormone-free (HF) environment, or in the presence of glucocorticoids (GC) at the indicated concentrations. In the left panel, cells transfected with the 5'UTR-MAX constructs exhibit decreased levels of ectopic MAX in the BRG1mut cells compared with BRG1wt cells. On the right, cells transfected with the MAX construct lacking 5'UTR show similar levels of ectopic MAX regardless of the status of BRG1. C, Western blots illustrate the reduction of MAX upon depletion of BRG1 in the indicated lung cancer cells carrying amplification of MYC in an HF environment and at the indicated hours after treatment with GC (5 μM). TUBULIN is included as a loading control. Fig. S3. Enriched gene ontology (GO) classifications (p<0.05 for all categories shown) among genes up-regulated in the MAX gene-expression profile (from Table S2). Enrichment (represented by several GO categories) is significant for genes annotated as being involved in neural development and in glucose/carbohydrate metabolism
PDF file, 106K, Supplementary Table S1. BRG1-deficient and -proficient cell lines subjected to BRM knockdown Supplementary Table S2. Verification of gene alterations in cell lines subjected to BRM knockdown Supplementary Table S3. Analysis of missense BRG1 mutations using the Polyphen software Supplementary Table S4. Negative correlation between BRG1 deficiency and alterations in therapeutic target genes in 373 NSCLC cases from three studies (this study and Refs 32 and 33) Supplementary Table S5. Correlation between BRG1 deficiency and smoking in 369 NSCLC cases from three studies (this study and Ref 32 and 33).
Supplemental Table 3. Univariable and Multivariable Cox regression of a linear score for the 4-coding gene classifier in the combined cohorta of Stage I, adenocarcinoma patients
PDF file, 1764K, Supplementary Figure S1. Immunohistochemical staining for BRG1 and BRM in cancer cell lines. Supplementary Figure S2. E431* and E608* Supplementary Figure S3. Fluorescence in situ hybridization for the detection of FGFR1 amplification in a case of squamous lung cell carcinoma. Supplementary Figure S4. Immunoblot analysis of SWI/SNF and ACF chromatinremodeling proteins. Supplementary Figure S5. Survival of H1299 (BRG1-deficient) and HeLa (BRG1-proficient) cells after shRNA-mediated knockdown of BRM (shBRM). Supplementary Figure S6. The effects of BRM knockdown on the morphologies of BRG1-deficient and proficient cancer cells. Supplementary Figure S7. Effect of BRM knockdown on the induction of senescence in BRG1-deficient and -proficient non-small-cell lung carcinoma cells.
Supplementary Table. S7. Amplification of nine representative oncogenes in the study cohort
Supplementary Fig. S6. Mutation spectra and frequencies by driver aberration and smoking status
PDF file - 1001KB, S1. Transformation of NIH3T3 cells expressing CD74-NRG1, EZR-ERBB4, or TRIM24-BRAF cDNAs. S2. Electropherogram of Sanger sequencing of cDNAs of novel fusion transcripts. S3. Schematic diagrams of genomic organization for NRG1, ERBB4, BRAF, and RET rearrangements. S4. Break-apart fluorescence in situ hybridization (FISH) for the NRG1 fusion. S5. Representative histological images obtained from fusion-positive IMAs.
PDF file 48K, Description of the methodology for: -Lung tumor specimens and cancer cell lines. -Screening for MAX gene alterations: Sanger direct sequencing and Multiplex ligation dependent probe amplification (MLPA). -Expression vectors and lentiviral production. -Chromatin immunoprecipitation (ChIP) assays. -Antibodies and western blots. -Treatments and MTT assays. -Microarray global gene expression analysis. -Statistical and bioinformatic analysis
 Takashi Kohno (河野隆志)合作论文数Division of Genome Biology, National Cancer Center Research Institute163
 Shiraishi Kouya合作论文数53Iwakawa Reika合作论文数48Koji Tsuta合作论文数46
 Curtis C. Harris合作论文数Laboratory of Human Carcinogenesis, Center for Cancer Research, National Cancer Institute, National Institutes of Health44Saito Motonobu合作论文数34Shimada Yoko合作论文数30Okayama Hirokazu合作论文数Center for Cancer Research, National Cancer Institute24
 Hitoshi Ichikawa (市川仁)合作论文数Department of Clinical Genomics, Fundamental Innovative Oncology Core, National Cancer Center Research Institute23Teruhiko Yoshida (吉田輝彦)合作论文数Graduate School of Medicine, The University of Tokyo23Hideo Kunitoh合作论文数23
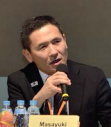 Masayuki Noguchi (野口雅之)合作论文数Tsukuba Human Tissue Diagnostic Center, University of Tsukuba;Faculty of Medicine, University of Tsukuba;University Hospital, University of Tsukuba22Shun-Ichi Watanabe合作论文数21Takenoshita Seiichi合作论文数17Alberto Villanueva合作论文数16Kato Mamoru合作论文数16
 Sebastian Moran合作论文数Alexza;Ferrer16
 Ana I. Robles合作论文数Diagnostics Evaluation Branch, Division of Cancer Treatment and Diagnosis, National Cancer Institute, National Institutes of Health;Office of Cancer Clinical Proteomics Research, National Cancer Institute, National Institutes of Health16Masachika Tani合作论文数16Hirohiko Totsuka合作论文数15Seiichi Takenoshita合作论文数15Hiroshi Nokihara (軒原浩)合作论文数Department of Respiratory Medicine, National Center for Global Health and Medicine15
 Montse Sanchez-Cespedes合作论文数Josep Carreras Leukemia Research Institute15Suenori Chiku合作论文数15Naoto Tsuchiya合作论文数14
 Hideaki Ogiwara合作论文数13
 Suvi Savola合作论文数MRC Holland13Ishigame Teruhide合作论文数13
 Tatsuhiro Shibata合作论文数Division of Cancer Genomics, National Cancer Center Research Institute;Laboratory of Molecular Medicine, Human Genome Center, Institute of Medical Science, University of Tokyo13Koh Furuta合作论文数13Shun-ichi I. Watanabe合作论文数12Luca Roz合作论文数12Elise D. Bowman合作论文数12Aaron J. Schetter合作论文数11
 Satoru Miyano合作论文数Human Genome Center, Institute of Medical Science, The University of Tokyo11Hiromi Sakamoto合作论文数11
 Seiichiro Yamamoto合作论文数Center for Cancer Control and Information Services, National Cancer Center Hospital11Masato Enari合作论文数11
 Noriko Gotoh (後藤典子)合作论文数Cancer Research Institute, Kanazawa University10Matsumoto Shingo合作论文数10Kumamoto Kensuke合作论文数10
 Rui Yamaguchi合作论文数University of Tokyo10
 Luis Montuenga Badía合作论文数Center for Applied Medical Research, University of Navarra10
 Antonio Gomez Fernandez合作论文数Department of Mechanical Engineering, University College London;University of Granada9
 Ugo Pastorino合作论文数Fondazione IRCCS Istituto Nazionale dei Tumori9
 Kenji Suzuki (鈴木健司)合作论文数Department of General Thoracic Surgery, School of Medicine, Juntendo University;Juntendo University Hospital9Yoshihiro Matsuno合作论文数9
 Manel Esteller合作论文数Cancer Epigenetics Group, Josep Carreras Leukaemia Research Institute;Faculty of Medicine and Health Sciences, University of Barcelona;Catalan Institution for Research and Advanced Studies9
 Makoto Nagashima合作论文数9




