In this study, we compare the diurnal variation in stratospheric ozone of the MACC (Monitoring Atmospheric Composition and Climate) reanalysis, ECMWF Reanalysis Interim (ERA-Interim), and the free-running WACCM (Whole Atmosphere Community Climate Model). The diurnal variation of stratospheric ozone results from photochemical and dynamical processes depending on altitude, latitude, and season. MACC reanalysis and WACCM use similar chemistry modules and calculate a similar diurnal cycle in ozone when it is caused by a photochemical variation. The results of the two model systems are confirmed by observations of the Superconducting Submillimeter-Wave Limb-Emission Sounder (SMILES) experiment and three selected sites of the Network for Detection of Atmospheric Composition Change (NDACC) at Mauna Loa, Hawaii (tropics), Bern, Switzerland (midlatitudes), and Ny-Ålesund, Svalbard (high latitudes). On the other hand, the ozone product of ERA-Interim shows considerably less diurnal variation due to photochemical variations. The global maxima of diurnal variation occur at high latitudes in summer, e.g., near the Arctic NDACC site at Ny-Ålesund, Svalbard. The local OZORAM radiometer observes this effect in good agreement with MACC reanalysis and WACCM. The sensed diurnal variation at Ny-Ålesund is up to 8% (0.4 ppmv) due to photochemical variations in summer and negligible during the dynamically dominated winter. However, when dynamics play a major role for the diurnal ozone variation as in the lower stratosphere (100–20 hPa), the reanalysis models ERA-Interim and MACC which assimilate data from radiosondes and satellites outperform the free-running WACCM. Such a domain is the Antarctic polar winter where a surprising novel feature of diurnal variation is indicated by MACC reanalysis and ERA-Interim at the edge of the polar vortex. This effect accounts for up to 8% (0.4 ppmv) in both model systems. In summary, MACC reanalysis provides a global description of the diurnal variation of stratospheric ozone caused by dynamics and photochemical variations. This is of high interest for ozone trend analysis and other research which is based on merged satellite data or measurements at different local time.
Middle atmospheric ozone, water vapour and zonal and meridional wind profiles have been measured with the two ground-based microwave radiometers GROMOS-C and MIAWARA-C. The instruments have been located at the Arctic research base AWIPEV at Ny-Ålesund, Svalbard (79∘ N, 12∘ E), since September 2015. GROMOS-C measures ozone spectra in the four cardinal directions with an elevation angle of 22∘. This means that the probed air masses at an altitude of 3 hPa (37 km) have a horizontal distance of 92 km to Ny-Ålesund. We retrieve four separate ozone profiles along the lines of sight and calculate daily mean horizontal ozone gradients which allow us to investigate the small-scale spatial variability of ozone above Ny-Ålesund. We present the evolution of the ozone gradients at Ny-Ålesund during winter 2018/2019, when a major sudden stratospheric warming (SSW) took place with the central date at 2 January, and link it to the planetary wave activity. We further analyse the SSW and discuss our ozone and water vapour measurements in a global context. At 3 hPa we find a distinct seasonal variation of the ozone gradients. The strong polar vortex during October and March results in a decreasing ozone volume mixing ratio towards the pole. In November the amplitudes of the planetary waves grow until they break in the end of December and an SSW takes place. From November until February ozone increases towards higher latitudes and the magnitude of the ozone gradients is smaller than in October and March. We attribute this to the planetary wave activity of wave numbers 1 and 2 which enabled meridional transport. The MERRA-2 reanalysis and the SD-WACCM model are able to capture the small-scale ozone variability and its seasonal changes.
We have used a method based on ground-based solar radiation measurements and radiative transfer models (RTMs) in order to estimate the following cloud optical properties: cloud optical thickness (COT), cloud single scattering albedo (SSAc) and effective droplet radius (reff). The method is based on the minimisation of the difference between modelled and measured downward shortwave radiation (DSR). The optical properties are estimated for more than 3000 stratus–altostratus (St–As) and 206 cirrus–cirrostratus (Ci–Cs) measurements during 2013–2017, at the Baseline Surface Radiation Network (BSRN) station in Payerne, Switzerland. The RTM libRadtran is used to simulate the total DSR as well as its direct and diffuse components. The model inputs of additional atmospheric parameters are either ground- or satellite-based measurements. The cloud cases are identified by the use of an all-sky cloud camera. For the low- to mid-level cloud class St–As, 95 % of the estimated cloud optical thickness values using total DSR measurements in combination with a RTM, herein abbreviated as COTDSR, are between 12 and 92 with a geometric mean and standard deviation of 33.8 and 1.7, respectively. The comparison of these COTDSR values with COTBarnard values retrieved from an independent empirical equation results in a mean difference of -1.2±2.7 and is thus within the method uncertainty. However, there is a larger mean difference of around 18 between COTDSR and COT values derived from MODIS level-2 (L2), Collection 6.1 (C6.1) data (COTMODIS). The estimated reff (from liquid water path and COTDSR) for St–As are between 2 and 20 µm. For the high-level cloud class Ci–Cs, COTDSR is derived considering the direct radiation, and 95 % of the COTDSR values are between 0.32 and 1.40. For Ci–Cs, 95 % of the SSAc values are estimated to be between 0.84 and 0.99 using the diffuse radiation. The COT for Ci–Cs is also estimated from data from precision filter radiometers (PFRs) at various wavelengths (COTPFR). The herein presented method could be applied and validated at other stations with direct and diffuse radiation measurements.
Water vapour in the atmosphere is not only a strong greenhouse gas, but also affects many atmospheric processes such as the formation of clouds and precipitation. With increasing temperature, Integrated Water Vapour (IWV) is expected to increase. Analysing how atmospheric water vapour changes in time is therefore important to monitor ongoing climate change. To determine whether IWV increases in Switzerland as expected, we asses IWV trends from a tropospheric water radiometer (TROWARA) in Bern, from a Fourier transform infrared (FTIR) spectrometer at Jungfraujoch and from the Swiss network of ground-based Global Navigation Satellite System (GNSS) stations. In addition, trends are assessed from reanalysis data, using the European Centre for Medium-Range Weather Forecasts (ECMWF) reanalysis (ERA5) and the Modern-Era Retrospecitve Analysis for Research and Applications (MERRA-2). Ground-based GNSS data are well suited for IWV trends due to their high temporal resolution and the spatially dense networks. However, they are highly sensitvie to instrumental changes and care has to be taken when determining GNSS based trends. We therefore use a straightforward trend method to account for jumps in the GNSS data when instrumental changes were performed. Our data show mostly positive IWV trends between 2 and 5% per decade in Switzerland. GNSS trends are significant for some stations and the significance has the tendency to increase with altitude. Further, we found that IWV scales on average to lower tropospheric temperatures as expected, except in winter. However, the correlation between IWV and temperature based on reanalysis data is spatially incoherent. Besides our positive IWV trends, we found a good agreement of radiometer, GNSS and reanalysis data in Bern. Further, we found a dry bias of the FTIR compared to GNSS data at Jungfraujoch, due to the restriction of FTIR to clear-sky conditions. Our results are generally consistent with the positive water vapour feedback in a warming climate. We show that ground-based GNSS networks provide a valuable source for regional climate monitoring with high spatial and temporal resolution, but homogeneously reprocessed data and advanced trend techniques are needed to account for data jumps.
Reliable ozone trends after 2000 are essential to detect early ozone recovery. However, the long-term ground-based and satellite ozone profile trends reported in the literature show a high variability. There are multiple reasons for variability in the reported long-term trends such as the measurement timing and the dataset quality. The Payerne Switzerland microwave radiometer (MWR) ozone trends are significantly positive at 2 % to 3 % per decade in the upper stratosphere (5–1 hPa, 35–48 km), with a high variation with altitude. This is in accordance with the Northern Hemisphere (NH) trends reported by other ground-based instruments in the SPARC LOTUS project. In order to determine what part of the variability between different datasets comes from measurement timing, Payerne MWR and SOCOL v3.0 chemistry–climate model (CCM) trends were estimated for each hour of the day with a multiple linear regression model. Trends were quantified as a function of local solar time (LST). In the middle and upper stratosphere, differences as a function of LST are reported for both the MWR and simulated trends for the post-2000 period. However, these differences are not significant at the 95 % confidence level. In the lower mesosphere (1–0.1 hPa, 48–65 km), the 2010–2018 day- and nighttime trends have been considered. Here again, the variation in the trend with LST is not significant at the 95 % confidence level. Based on these results we conclude that significant trend differences between instruments cannot be attributed to a systematic temporal sampling effect. The dataset quality is of primary importance in a reliable trend derivation, and multi-instrument comparison analyses can be used to assess the long-term stability of data records by estimating the drift and bias of instruments. The Payerne MWR dataset has been homogenized to ensure a stable measurement contribution to the ozone profiles and to take into account the effects of three major instrument upgrades. At each instrument upgrade, a correction offset has been calculated using parallel measurements or simultaneous measurements by an independent instrument. At pressure levels smaller than 0.59 hPa (above ∼50 km), the homogenization corrections to be applied to the Payerne MWR ozone profiles are dependent on LST. Due to the lack of reference measurements with a comparable measurement contribution at a high time resolution, a comprehensive homogenization of the sub-daily ozone profiles was possible only for pressure levels larger than 0.59 hPa. The ozone profile dataset from the Payerne MWR, Switzerland, was compared with profiles from the GROMOS MWR in Bern, Switzerland, satellite instruments (MLS, MIPAS, HALOE, SCHIAMACHY, GOMOS), and profiles simulated by the SOCOL v3.0 CCM. The long-term stability and mean biases of the time series were estimated as a function of the measurement time (day- and nighttime). The homogenized Payerne MWR ozone dataset agrees within ±5 % with the MLS dataset over the 30 to 65 km altitude range and within ±10 % of the HARMonized dataset of OZone profiles (HARMOZ, limb and occultation measurements from ENVISAT) over the 30 to 65 km altitude range. In the upper stratosphere, there is a large nighttime difference between Payerne MWR and other datasets, which is likely a result of the mesospheric signal aliasing with lower levels in the stratosphere due to a lower vertical resolution at that altitude. Hence, the induced bias at 55 km is considered an instrumental artifact and is not further analyzed.
Observing stratospheric ozone is essential to assess whether the Montreal Protocol has succeeded in saving the ozone layer by banning ozone depleting substances. Recent studies have reported positive trends, indicating that ozone is recovering in the upper stratosphere at mid-latitudes, but the trend magnitudes differ, and uncertainties are still high. Trends and their uncertainties are influenced by factors such as instrumental drifts, sampling patterns, discontinuities, biases, or short-term anomalies that may all mask a potential ozone recovery. The present study investigates how anomalies, temporal measurement sampling rates, and trend period lengths influence resulting trends. We present an approach for handling suspicious anomalies in trend estimations. For this, we analysed multiple ground-based stratospheric ozone records in central Europe to identify anomalous periods in data from the GROund-based Millimetre-wave Ozone Spectrometer (GROMOS) located in Bern, Switzerland. The detected anomalies were then used to estimate ozone trends from the GROMOS time series by considering the anomalous observations in the regression. We compare our improved GROMOS trend estimate with results derived from the other ground-based ozone records (lidars, ozonesondes, and microwave radiometers), that are all part of the Network for the Detection of Atmospheric Composition Change (NDACC). The data indicate positive trends of 1 % decade−1 to 3 % decade−1 at an altitude of about 39 km (3 hPa), providing a confirmation of ozone recovery in the upper stratosphere in agreement with satellite observations. At lower altitudes, the ground station data show inconsistent trend results, which emphasize the importance of ongoing research on ozone trends in the lower stratosphere. Our presented method of a combined analysis of ground station data provides a useful approach to recognize and to reduce uncertainties in stratospheric ozone trends by considering anomalies in the trend estimation. We conclude that stratospheric trend estimations still need improvement and that our approach provides a tool that can also be useful for other data sets.
A highly sensitive receiver for the microwave ozone profiling instrument MOPI 5 has been developed. The receiver allows the simultaneous measurement of the pressure-broadened line shape of the thermally-excited rotational emission lines of middle atmospheric ozone and carbon monoxide at 110.836 GHz and 115.271 GHz, respectively. It exhibits a single side band noise temperature of 550-625 K. This paper describes the receiver design and compares the results of the first spectral line measurements obtained using two different digital fast Fourier transform spectrometer back-ends.
Abstract. We use 3 years of water vapour and ozone measurements to analyse dynamical events in the polar middle atmosphere such as sudden stratospheric warmings (SSW), polar vortex shifts, water vapour descent rates and periodicities. The measurements were performed with the two ground-based microwave radiometers MIAWARA-C and GROMOS-C which are co-located at the AWIPEV research base at Ny-Alesund, Svalbard (79° N, 12° E) since September 2015. The almost continuous datasets of water vapour and ozone are characterised by a high time resolution in the order of hours. A thorough intercomparison of these datasets with models and measurements from satellite, ground-based and in-situ instruments was performed. In the upper stratosphere and lower mesosphere the MIAWARA-C profiles agree within 5 % with SD-WACCM simulations and ACE-FTS measurements whereas AuraMLS measurements show an average offset of 10–15 % depending on altitude but constant in time. Stratospheric GROMOS-C profiles are within 5 % of the satellite instruments AuraMLS and ACE-FTS and the ground-based microwave radiometer OZORAM which is also located at Ny-Alesund. During these first three years of the measurement campaign typical phenomena of the Arctic middle atmosphere took place and we analysed their signatures in the water vapour and ozone datasets. Inside of the polar vortex in autumn we found the descent rate of mesospheric water vapour to be 435 m/day on average. In early 2017 distinct increases in mesospheric water vapour of about 2 ppm were observed when the polar vortex was displaced and midlatitude air was brought to Ny-Alesund. Two major sudden stratospheric warmings took place in March 2016 and February 2018 where ozone enhancements of up to 4 ppm were observed. The zonal wind reversals accompanying a major SSW were captured in the GROMOS-C wind profiles which are retrieved from the ozone spectra. After the SSW in February 2018 the polar vortex re-established and the water vapour descent rate in the mesosphere was 355 m/day. In the water vapour and ozone time series signatures of atmospheric waves with periods close to 2, 5, 10 and 16 days were found.
The middle atmospheric water vapor radiometer MIAWARA is located close to Bern in Zimmerwald (46.88∘ N, 7.46∘ E; 907 m) and is part of the Network for the Detection of Atmospheric Composition Change (NDACC). Initially built in the year 2002, a major upgrade of the instrument's spectrometer allowed middle atmospheric water vapor to be continuously measured since April 2007. Thenceforward to May 2018, a time series of more than 11 years has been gathered, that makes a first trend estimate possible. For the trend estimation, a robust multilinear parametric trend model has been used. The trend model encompasses a linear term, a solar activity tracker, the El Niño–Southern Oscillation (ENSO) index and the Quasi-Biennial Oscillation (QBO) as well as the annual and semi-annual oscillation. In the time period April 2007 to May 2018 we find a significant decline in water vapor by -0.6±0.2 ppm per decade between 61 and 72 km. Below the stratopause level (∼48 km) a smaller reduction of H2O of up to -0.3±0.1 ppm per decade is detected.
Abstract. Observing stratospheric ozone is essential to assess if the Montreal Protocol has succeeded to save the ozone layer by banning ozone depleting substances. Recent studies have reported positive trends indicating that ozone is recovering in the upper stratosphere at mid-latitudes, but the trend magnitudes differ and uncertainties are still high. Trends and their uncertainties are influenced by factors such as instrumental drifts, sampling patterns, discontinuities, biases, or short-term anomalies that all might mask a potential ozone recovery. The present study investigates how anomalies, temporal measurement sampling rates and trend period lengths influence resulting trends. We present an approach for handling suspicious anomalies in trend estimations to improve the derived trend profiles. The approach was applied to data from a Ground-based Millimetre-wave Ozone Spectrometer (GROMOS) located in Bern, Switzerland. We compare our improved GROMOS trend estimate with results from other ground stations (lidars, ozonesondes, and microwave radiometers) in Central Europe. The data indicate positive trends of 1 to 3 % per decade at an altitude of about 40 km (3 hPa), providing a confirmation of ozone recovery in the upper stratosphere in agreement to satellite observations. At lower altitudes, the ground station data show inconsistent trend results, which emphasize the importance of ongoing research on lower stratospheric ozone trends. Our presented method of a combined analysis of ground station data provides a useful approach to recognize and to reduce uncertainties in stratospheric ozone trends by considering anomalies in the trend estimation. We conclude that stratospheric trend estimations still need improvement and that our approach provides a tool that can also be useful for other data sets.
The ground-based millimeter wave ozone spectrometer (GROMOS) has been continually measuring middle atmospheric ozone volume mixing ratio profiles above Bern, Switzerland ( 46.95^∘N , 7.44^∘E , 577 m), since 1994 in the frame of NDACC. The high temporal resolution of GROMOS (30 min) allows the analysis of short-term fluctuations. The present study analyses the temporal perturbations, ranging from 1 to 8 h, observed in stratospheric ozone from June 2011 to May 2012. The short-term fluctuations of stratospheric ozone are within 5
Wind profile information throughout the entire upper stratosphere and lower mesosphere (USLM) is important for the understanding of atmospheric dynamics but became available only recently, thanks to developments in remote sensing techniques and modelling approaches. However, as wind measurements from these altitudes are rare, such products have generally not yet been validated with (other) observations. This paper presents the first long-term intercomparison of wind observations in the USLM by co-located microwave radiometer and lidar instruments at Andenes, Norway (69.3 degrees N, 16.0 degrees E). Good correspondence has been found at all altitudes for both horizontal wind components for nighttime as well as daylight conditions. Biases are mostly within the random errors and do not exceed 5-10 m s(-1), which is less than 10% of the typically encountered wind speeds. Moreover, comparisons of the observations with the major reanalyses and models covering this altitude range are shown, in particular with the recently released ERA5, ECMWF's first reanalysis to cover the whole USLM region. The agreement between models and observations is very good in general, but temporally limited occurrences of pronounced discrepancies (up to 40 m s(-1)) exist. In the article's Appendix the possibility of obtaining nighttime wind information about the mesopause region by means of microwave radiometry is investigated.
The thermal infrared cloud camera (IRCCAM) is a prototype instrument that determines cloud fraction continuously during daytime and night-time using measurements of the absolute thermal sky radiance distributions in the 8–14 µm wavelength range in conjunction with clear-sky radiative transfer modelling. Over a time period of 2 years, the fractional cloud coverage obtained by the IRCCAM is compared with two commercial cameras (Mobotix Q24M and Schreder VIS-J1006) sensitive in the visible spectrum, as well as with the automated partial cloud amount detection algorithm (APCADA) using pyrgeometer data. Over the 2-year period, the cloud fractions determined by the IRCCAM and the visible all-sky cameras are consistent to within 2 oktas (0.25 cloud fraction) for 90 % of the data set during the day, while for day- and night-time data the comparison with the APCADA algorithm yields an agreement of 80 %. These results are independent of cloud types with the exception of thin cirrus clouds, which are not detected as consistently by the current cloud algorithm of the IRCCAM. The measured absolute sky radiance distributions also provide the potential for future applications by being combined with ancillary meteorological data from radiosondes and ceilometers.
A mesospheric water vapor data set obtained by the middle atmospheric water vapor radiometer (MIAWARA) close to Bern, Switzerland (46.88 degrees N, 7.46 degrees E) during October 2010 to September 2017 is investigated to study the long-term evolution and variability of quasi 2-day waves (Q2DWs). We present a climatological overview and an insight on the dynamical behavior of these waves with the occurring spectrum of periods as seen from a midlatitude observation site. Such a large and nearly continuous measurement data set as ours is rare and of high scientific value. The core results of our investigation indicate that the activity of the Q2DW manifests in burst-like events and is higher during winter months (November-February) than during summer months (May-August) for the altitude region of the mesosphere (up to 0.02 hPa in winter and up to 0.05 hPa in summer) accessible for the instrument. Single Q2DW events reach at most about 0.8 ppm in the H2O amplitudes. Further, monthly mean Q2DW amplitude spectra are presented and reveal a high-frequency variability between different months. A large fraction of identified Q2DW events (20 %) develop periods between 38 and 40 h. Further, we show the temporal evolution of monthly mean Q2DW oscillations continuously for all months and separated for single months over 7 years. The analysis of autobicoherence spectra gives evidence that Q2DWs are sometimes phase coupled to diurnal oscillations to a high degree and to waves with a period close to 18 h.
Ground-based microwave wind radiometry provides a method to measure horizontal wind speeds at altitudes between 35 and 75 km as has been shown by various previous studies. No other method is capable of continuously delivering wind measurements in this altitude region. As opposed to lidar systems, microwave radiometers operate autonomously and independent of daylight and clouds.In this paper, we present the WIRA-C (Wind Radiometer for Campaigns) instrument that observes the 142.17504 GHz rotational transition line of ozone with a high spectral resolution using a low noise single side band heterodyne receiver. Because the emitting molecules are drifting with the wind, the line is Doppler shifted. Together with the pressure broadening effect, this allows the retrieval of altitude resolved wind profiles.The novel WIRA-C instrument represents the newest development in microwave wind radiometry and implements many improvements over its predecessor, the WIRA instrument. The main improvements include the compact structure, lower noise and an advanced retrieval setup. This paper describes the instrument and the data processing with a focus on the retrieval that takes into account a three-dimensional atmosphere and has never been used in ground-based radiometry before. The retrieval yields profiles of horizontal wind speeds with a 12 h time resolution and a vertical resolution of 10 km for zonal and 10 to 15 km for meridional wind speeds. We give an error estimate that accounts for the thermal noise on the measured spectra and additionally estimate systematic errors using Monte Carlo methods.WIRA-C has been continuously measuring horizontal wind speeds for 1 year at the Maïdo observatory on Réunion (21.4° S, 55.9° E). We present the time series of this campaign and compare our measurements to model data from the European Centre for Medium-range Weather Forecasts (ECMWF) and coincident measurements of the co-located Rayleigh–Mie Doppler wind lidar. We find a good agreement between our measurements and the ECMWF operational analysis for the time series, where many features are present in both datasets. The wind profiles of the coincident WIRA-C and lidar observations are consistent and agree within their respective uncertainties for the lidar measurements with long integration times.
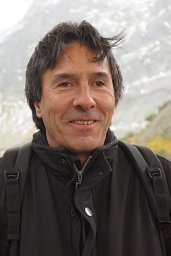 Klemens Hocke合作论文数Institute of Applied Physics, University of Bern49
 Axel Murk合作论文数23
 Dietrich G Feist合作论文数22
 Rolf Rüfenacht合作论文数17C. P. Aellig合作论文数13k kunzi合作论文数12Franziska Schranz合作论文数12
 Alexander Haefele合作论文数12
 Alain Hauchecorne合作论文数11
 Christian Mätzler合作论文数Gamma Remote Sensing Research and Consulting AG11
 R. M. Bevilacqua合作论文数10
 Paul Hartogh合作论文数Abteilung für Planetenwissenschaften, Max-Planck-Institut für Sonnensystemforschung10
 Martin Lainer合作论文数Univ Bern, Inst Appl Phys, CH-3012 Bern, Switzerland8J. De La Noë合作论文数8
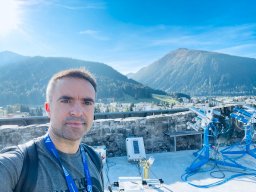 F. Navas-Guzmán合作论文数Universidad de Granada, Junta de Andalucía-Universidad de Granada8
 Lorena Moreira合作论文数7Leonie Bernet合作论文数7
 Jonas Hagen合作论文数7
 Eliane Maillard Barras合作论文数7P. Ricaud合作论文数7B. Deuber合作论文数6
 Sergey Khaykin合作论文数Central Aerological;Observatory of Roshydromet;Central Aerological|Observatory of Roshydromet6J. J. Olivero合作论文数6
 Donal P. Murtagh合作论文数Department of Radio and Space Science, Chalmers University of Technology6Laurent Vuilleumier合作论文数Atmospheric Data Division, Federal Office of Meteorology and Climatology MeteoSwiss6
 Gerald E. Nedoluha合作论文数Remote Sensing Division, U.S. Naval Research Laboratory6Peter Forkman合作论文数6R Peter合作论文数6
 Yasmine Calisesi合作论文数6Cornelius Schiller合作论文数6ulrich mair合作论文数5ansgar ulrich schanz合作论文数5Corinne Straub合作论文数5
 Gunter Stober合作论文数Institute of Applied Physics, Faculty of Science, University of Bern5
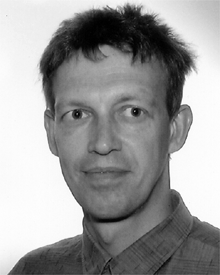 J. Urban合作论文数5Georg Wagner合作论文数5Tim Ingold合作论文数5
 Gerd Baumgarten合作论文数Leibniz-Institute of Atmospheric Physics, Kühlungsborn, Germany5
 Gerd K. Hartmann合作论文数5C. Jarchow合作论文数5
 Thomas Flury合作论文数Institute of Applied Physics;University of Bern;Institute of Applied Physics, University of Bern5H Van De Stadt合作论文数5Julian Gröbner合作论文数5
 Thomas Von Clarmann合作论文数Fakultät für Bauingenieur-, Geo- und Umweltwissenschaften, Karlsruher Instituts für Technologie;Institut für Meteorologie und Klimaforschung, Karlsruher Instituts für Technologie5w degenhardt合作论文数5Manfred Birk合作论文数Deutsches Zentrum für Luft- und Raumfahrt5Pavel A. Yagoubov合作论文数5Gabriele P. Stiller合作论文数Karlsruhe Institute of Technology5Rene Stubi合作论文数meteoswiss5




