Image-based CFD is a powerful tool to study cardiovascular flows while 2D echocardiography (echo) is the most widely used noninvasive imaging modality for the diagnosis of heart disease. Here, echo is combined with CFD, that is, an echo-CFD framework, to study ventricular flows. To achieve this, the previous 3D reconstruction from multiple 2D echo at standard cross sections is extended by: (a) reconstructing aortic and mitral valves from 2D echo and closing the left-ventricle (LV) geometry by approximating a superior wall; (b) incorporating the physiological assumption of the fixed apex as a reference (fixed) point in the 3D reconstruction; and (c) incorporating several smoothing algorithms to remove the nonphysical oscillations (ringing) near the basal section. The method is applied to echo from a baseline LV and one after inducing acute myocardial ischemia (AMI). The 3D reconstruction is validated by comparing it against a reference reconstruction from many echo sections while flow simulations are validated against the Doppler ultrasound velocity measurements. The sensitivity study shows that the choice of the smoothing algorithm does not change the flow pattern inside the LV. However, the presence of the mitral valve can significantly change the flow pattern during the diastole phase. In addition, the abnormal shape of a LV with AMI can drastically change the flow during diastole. Furthermore, the hemodynamic energy loss, as an indicator of the LV pumping performance, for different test cases is calculated, which shows a larger energy loss for a LV with AMI compared to the baseline one.
Image-based CFD is a powerful tool to study cardiovascular flows while 2D echocardiography (echo) is the most widely used noninvasive imaging modality for the diagnosis of heart disease. Here, echo is combined with CFD, that is, an echo-CFD framework, to study ventricular flows. To achieve this, the previous 3D reconstruction from multiple 2D echo at standard cross sections is extended by: (a) reconstructing aortic and mitral valves from 2D echo and closing the left-ventricle (LV) geometry by approximating a superior wall; (b) incorporating the physiological assumption of the fixed apex as a reference (fixed) point in the 3D reconstruction; and (c) incorporating several smoothing algorithms to remove the nonphysical oscillations (ringing) near the basal section. The method is applied to echo from a baseline LV and one after inducing acute myocardial ischemia (AMI). The 3D reconstruction is validated by comparing it against a reference reconstruction from many echo sections while flow simulations are validated against the Doppler ultrasound velocity measurements. The sensitivity study shows that the choice of the smoothing algorithm does not change the flow pattern inside the LV. However, the presence of the mitral valve can significantly change the flow pattern during the diastole phase. In addition, the abnormal shape of a LV with AMI can drastically change the flow during diastole. Furthermore, the hemodynamic energy loss, as an indicator of the LV pumping performance, for different test cases is calculated, which shows a larger energy loss for a LV with AMI compared to the baseline one.
Two-dimensional echocardiography (echo) is the method of choice for noninvasive evaluation of the left ventricle (LV) function owing to its low cost, fast acquisition time, and high temporal resolution. However, it only provides the LV boundaries in discrete 2D planes, and the 3D LV geometry needs to be reconstructed from those planes to quantify LV wall motion, acceleration, and strain, or to carry out flow simulations. An automated method is developed for the reconstruction of the 3D LV endocardial surface using echo from a few standard cross sections, in contrast with the previous work that has used a series of 2D scans in a linear or rotational manner for 3D reconstruction. The concept is based on a generalized approach so that the number or type (long-axis (LA) or short-axis (SA)) of sectional data is not constrained. The location of the cross sections is optimized to minimize the difference between the reconstructed and measured cross sections, and the reconstructed LV surface is meshed in a standard format. Temporal smoothing is implemented to smooth the motion of the LV and the flow rate. This software tool can be used with existing clinical 2D echo systems to reconstruct the 3D LV geometry and motion to quantify the regional akinesis/dyskinesis, 3D strain, acceleration, and velocities, or to be used in ventricular flow simulations.
The left ventricle (LV) of a human heart receives oxygenated blood from the lungs and pumps it throughout the body via the aortic valve. Characterizing the LV geometry, its motion, and the ventricular flow is critical in assessing the heart's health. An automated method has been developed in this work to generate a three-dimensional (3D) model of the LV from multiple-axis echocardiography (echo). Image data from three long-axis sections and a basal section is processed to compute spatial nodes on the LV surface. The generated surfaces are output in a standard format such that it can be imported into the curvilinear-immersed boundary (CURVIB) framework for numerical simulation of the flow inside the LV. The 3D LV model can be used for better understanding of the ventricular motion and the simulation framework provides a powerful tool for studying left ventricular flows on a patient specific basis. Future work would incorporate data from additional cross-sectional images.
Purpose:Breast radiotherapy, particularly electronic compensation, may involve large dose gradients and difficult patient positioning problems. We have developed a simple self‐calibrating augmented‐reality system, which assists in accurately and reproducibly positioning the patient, by displaying her live image from a single camera superimposed on the correct perspective projection of her 3D CT data. Our method requires only a standard digital camera capable of live‐view mode, installed in the treatment suite at an approximately‐known orientation and position (rotation R; translation T).Methods:A 10‐sphere calibration jig was constructed and CT imaged to provide a 3D model. The (R,T) relating the camera to the CT coordinate system were determined by acquiring a photograph of the jig and optimizing an objective function, which compares the true image points to points calculated with a given candidate R and T geometry. Using this geometric information, 3D CT patient data, viewed from the camera's perspective, is plotted using a Matlab routine. This image data is superimposed onto the real‐time patient image, acquired by the camera, and displayed using standard live‐view software. This enables the therapists to view both the patient's current and desired positions, and guide the patient into assuming the correct position. The method was evaluated using an in‐house developed bolus‐like breast phantom, mounted on a supporting platform, which could be tilted at various angles to simulate treatment‐like geometries.Results:Our system allowed breast phantom alignment, with an accuracy of about 0.5 cm and 1 ± 0.5 degree. Better resolution could be possible using a camera with higher‐zoom capabilities.Conclusion:We have developed an augmented‐reality system, which combines a perspective projection of a CT image with a patient's real‐time optical image. This system has the potential to improve patient setup accuracy during breast radiotherapy, and could possibly be used for other disease sites as well.
Purpose: Breast radiotherapy, particularly electronic compensation, may involve large dose gradients and difficult patient positioning problems. We have developed a simple self‐calibrating optical image‐guided system, which assists in accurately and reproducibly positioning the patient, by displaying her real‐time optical image from a single camera superimposed on a perspective projection of her 3D CT data. Our method requires only a standard high‐zoom digital camera capable of live‐view mode, set up in the treatment suite at a fixed orientation and position (rotation, R and translation, T). Methods: A 10‐sphere calibration jig was constructed and CT imaged to provide a 3D model. The camera R and T were determined by taking a photograph of the jig and optimizing an objective function, which compares the true image points to points calculated with a given candidate R and T geometry. Using this geometric information, 3D CT patient data, viewed from the camera perspective, is plotted using a Matlab routine. This image data is superimposed onto the real‐time patient image, acquired by the camera, and displayed using standard live‐view software. This enables the therapists to view both the current and desired positions of the patient, and guide her into assuming the correct position. The method was evaluated using an in‐house developed breast phantom, mounted on a supporting platform, which could be tilted at various angles to simulate treatment‐like geometries. Results: Our system allowed us to align the breast phantom, with an accuracy of about 0.5 cm and 5°. Better resolution could be possible with a camera with higher‐zoom capabilities. Conclusion: We have developed a system to superimpose a perspective projection of a CT image on a patient real‐time optical image. Such a system has the potential to improve patient setup accuracy during breast radiotherapy, and could possibly be used for other disease sites as well.
We propose a rapid interpolation method of computational fluid dynamics (CFD) solution based on the collocation method for vascular flows through the polynomial interpolation and present a proof-of-concept computation of our preliminary results. A rapid CFD can play a crucial role for some applications such as the hemodynamics assessment for human vasculature in the emergent situation. The CFD approach for the real-time assessment at the clinical level is, however, not a practical tool due to the computational complexity and the long time integration needed for the individual CFDs. We propose an efficient, accurate, yet fast interpolation method of finding CFD solutions that can be utilized for the real-time hemodynamic analysis for clinicians. The main idea of the method is to use the vascular library where vascular solutions with different parameter values are pre-computed and stored. The desired unknown CFD solution is obtained via the interpolation using the similar solutions from the library. We use the spectral collocation method for the individual CFD solutions. The collocation method makes it easier to map the solution from the physical domain to the reference domain for the interpolation using the homeomorphic transformation. The interpolation is then directly constructed using the solution fields at the collocation points. Our preliminary results for vascular flows of 3D stenosis show that the proposed method is fast and accurate.
A novel and efficient method to simulate the behavior of guidewires in the vascular system is proposed in this paper. The graph-theoretical method is based on the principle of minimal total potential energy. We formulate the total potential energy in the vascular interventional system as the summation of the elastic energy of the guidewire and the energy due to the deformation of the vessel wall. A graph is constructed with low complexity ensuring the efficiency of the single source shortest path. Compared to previous results, experiments in three phantoms have been conducted to evaluate the performance of the proposed method and the results demonstrate that our method can achieve 20% improvement with faster running time.
Understanding 3D flow-velocity fields may be valuable during interventional procedures. Thus, we are developing methods to calculate 3D flow fields from single-plane angiographic sequences. The vessel geometry is selected. Flow fields are generated based on laminar flow conditions. X-ray-attenuating contrast is propagated through the vessel using the flow fields. Angiograms are generated at 30 frames/second using ray-casting. Vessel profile data are extracted from the angiograms along lines perpendicular to the vessel axis. The conversion from image intensity to contrast pathlength is determined. The contrast pathlength is calculated for each vessel-profile point, and the contrast is centered about the vessel's central plane generating a 3D contrast distribution. This procedure is repeated for each acquired angiogram. Corresponding points on the surface of the calculated contrast distributions are established for temporally adjacent distributions using estimated streamlines. Distances between corresponding points are calculated from which average velocities are calculated. These average velocities are placed at points along the streamlines, thereby generating a 3D velocity flow field in the vessel lumen. Simulations for steady flow conditions for straight vessels, curved (in-plane) vessels, and vessels with stenoses, for noiseless and noisy (10% peak contrast) angiograms were performed. The calculated and simulated 3D contrast distributions agree well for both noiseless and noisy conditions (errors < 2 voxels ~ 0.2 mm). Average absolute error of the calculated 3D flow velocities is approximately 10%. These promising initial results indicate that this technique may form the basis for calculating 3D-contrast and 3D-flow-velocity distributions from standard single-plane angiographic sequences.
PURPOSE:The authors describe a new technique to determine the system presampled modulation transfer function (MTF) in digital radiography using only the detector noise response.METHODS:A cascaded-linear systems analysis was used to develop an exact relationship between the two-dimensional noise power spectrum (NPS) and the presampled MTF for a generalized detector system. This relationship was then utilized to determine the two-dimensional presampled MTF. For simplicity, aliasing of the correlated noise component of the NPS was assumed to be negligible. Accuracy of this method was investigated using simulated images from a simple detector model in which the "true" MTF was known exactly. Measurements were also performed on three detector technologies (an x-ray image intensifier, an indirect flat panel detector, and a solid state x-ray image intensifier), and the results were compared using the standard edge-response method. Flat-field and edge images were acquired and analyzed according to guidelines set forth by the International Electrotechnical Commission, using the RQA 5 spectrum.RESULTS:The presampled MTF determined using the noise-response method for the simulated detector system was in close agreement with the true MTF with an averaged percent difference of 0.3% and a maximum difference of 1.1% observed at the Nyquist frequency (fN). The edge-response method of the simulated detector system also showed very good agreement at lower spatial frequencies (less than 0.5 fN) with an averaged percent difference of 1.6% but showed significant discrepancies at higher spatial frequencies (greater than 0.5 fN) with an averaged percent difference of 17%. Discrepancies were in part a result of noise in the edge image and phasing errors. For all three detector systems, the MTFs obtained using the two methods were found to be in good agreement at spatial frequencies less than 0.5 fN with an averaged percent difference of 3.4%. Above 0.5 fN, differences increased to an average of 20%. Deviations of the experimental results largely followed the trend seen in the simulation results, suggesting that differences between the two methods could be explained as resulting from the inherent inaccuracies of the edge-response measurement technique used in this study. Aliasing of the correlated noise component was shown to have a minimal effect on the measured MTF for the three detectors studied. Systems with significant aliasing of the correlated noise component (e.g., a-Se based detectors) would likely require a more sophisticated fitting scheme to provide accurate results.CONCLUSIONS:Results indicate that the noise-response method, a simple technique, can be used to accurately measure the MTF of digital x-ray detectors, while alleviating the problems and inaccuracies associated with use of precision test objects, such as a slit or an edge.
Rotational angiography (RA) is widely used clinically to obtain 3D data. In many procedures, e.g., neurovascular interventions, the imaged field of view (FOV) is much larger than the region of interest (ROI), thereby subjecting the patient to unnecessary x-ray dose. To reduce the dose in these procedures, we have proposed placing an x-ray attenuating filter with an open aperture (ROI) in the x-ray beam (called filtered region of interest (FROI) RA. We have shown that this approach yields high quality data for centered objects of interest (OoIs). In this study, we investigate the noise behavior of the FROI approach for off-center OoIs. Using filter-specific attenuation and noise characteristics, simulated FROI projection images were generated. The intensities in the peripheral region were equalized, and the 3D data reconstructed. For each reconstructed voxel, the intersections with the full intensity beam (ROI) were determined for each projection, and noise properties were evaluated. Off-center OoIs intersect the high intensity beam in more than 60% of the projections (ROI having 40% FOV area), with intersection frequency increasing with increasing ROI area and OoI proximity to the central region. The noise increases with distance from the central region up to a factor of two. Integral dose reductions range between 40% and 85%, depending on ROI area and filter thickness. Substantial dose reductions (40-85%) are achieved with less than a factor of two increase in noise for OoIs peripheral to the central region, indicating the FROI approach might be an alternative for reducing dose during standard procedures.
Recent works in neurology have explored ways to obtain a better understanding of blood flow circulation in the brain with the ultimate goal of improving the treatment of cerebrovascular diseases, such as strokes, stenosis, and aneurysms. In this paper, we propose a framework to reconstruct three-dimensional (3D) models of intracerebral vessels from biplane angiograms. The reconstructed vessel geometries are then used to perform simulations of computational fluid dynamic (CFD). A key component of our framework is to perform such a reconstruction by incorporating user interaction to identify the centerline of the vessels in each view. Then the vessel profile is estimated automatically at each point along the centerlines, and an optimization procedure refines the 3D model using epipolar constraints and back-projection in the original angiograms. Finally, the 3D model of the vessels is then used as the domain where the wall shear stress (WSS), and velocity vectors are estimated from a blood flow model that follows Navier-Stokes equations as an incompressible Newtonian fluid. Visualization of hemodynamic parameters are illustrated on two stroke patients.
Purpose: Digital Subtraction Angiography (DSA) is used to evaluate endovascular treatments, either visually or using time‐density curves (TDC), which present change of contrast as a function of time for either the entire aneurysm or sub‐volumes within (R‐TDC). Quantitative parameters such as peak‐density‐value, time‐to‐peak, input rate, influx, residence time, wash‐out‐time, and wash‐out‐rate were used in this study to examine the hemodynamic implications of several treatments using FMDs. Method and Materials: Flow evaluations for aneurysms (saccular and bifurcation geometries) were done using elastomer‐based replicas of clinical human cases. These phantoms were placed in in‐vitro pulsatile flow loops containing a blood‐simulating solution of glycerin‐water. One‐cc boluses of iodinated contrast were delivered at the proximal end of parent vessel of each aneurysm via 5‐Fr catheters using an automatic injector. DSA sequences were acquired at 30 frames/sec (5‐inch II‐mode). The necks of the aneurysms were covered using different‐porosity FMDs. TDCs were obtained pre‐and‐post‐treatment.Results: R‐TDC metrics indicate important modifications of flow occurred in different areas inside the aneurysm that are not evident from the total‐volume TDC. For example, in a sub‐region of saccular aneurysm treated with a zero‐porosity‐patch FMD, occluding the proximal portion of the aneurysmal orifice, peak‐density decreased 49% compared to untreated case and the flow behavior is changed from continuous to oscillatory, while the total aneurysm measurement shows a decrease in peak‐density of 21% and an increase of wash‐out‐time of 171% versus untreated case. In a sub‐region of the bifurcation aneurysm treated with non‐zero‐porosity patch FMD placed to occlude the entire neck, time‐to‐peak increased 67%, and input rate decreased 71% compared to untreated case, while the total aneurysm measurement shows a time‐to‐peak increase of 20% and an input rate of 50% versus untreated case.Conclusion: Proposed parameterization of TDC's is rapid and terms have physical meaning. Support: NIH R01‐NS43924, R01‐EB002873, Toshiba Corp.
PURPOSE Cone-beam rotational angiography (CBRA) is widely used in the modern clinical settings. In a number of procedures, the area of interest is often considerably smaller than the field of view (FOV) of the detector, subjecting the patient to potentially unnecessary x-ray dose. The authors therefore propose a filter-based method to reduce the dose in the regions of low interest, while supplying high image quality in the region of interest (ROI). METHODS For such procedures, the authors propose a method of filtered region of interest (FROI)-CBRA. In the authors' approach, a gadolinium filter with a circular central opening is placed into the x-ray beam during image acquisition. The central region is imaged with high contrast, while peripheral regions are subjected to a substantial lower intensity and dose through beam filtering. The resulting images contain a high contrast/intensity ROI, as well as a low contrast/intensity peripheral region, and a transition region in between. To equalize the two regions' intensities, the first projection of the acquisition is performed with and without the filter in place. The equalization relationship, based on Beer's law, is established through linear regression using corresponding filtered and nonfiltered data. The transition region is equalized based on radial profiles. RESULTS Evaluations in 2D and 3D show no visible difference between conventional FROI-CBRA projection images and reconstructions in the ROI. CNR evaluations show similar image quality in the ROI, with a reduced CNR in the reconstructed peripheral region. In all filtered projection images, the scatter fraction inside the ROI was reduced. Theoretical and experimental dose evaluations show a considerable dose reduction; using a ROI half the original FOV reduces the dose by 60% for the filter thickness of 1.29 mm. CONCLUSIONS These results indicate the potential of FROI-CBRA to reduce the dose to the patient while supplying the physician with the desired image detail inside the ROI.
The new Solid State X-ray Image Intensifier (SSXII) is being designed based on a modular imaging array of Electron Multiplying Charge Couple Devices (EMCCD). Each of the detector modules consists of a CsI(Tl) phosphor coupled to a fiber-optic plate, a fiber-optic taper (FOT), and an EMCCD sensor with its electronics. During the optical coupling and alignment of the modules into an array form, small orientation misalignments, such as rotation and translation of the EMCCD sensors, are expected. In addition, barrel distortion will result from the FOTs. Correction algorithms have been developed by our group for all the above artifacts. However, it is critical for the system's performance to correct these artifacts in real-time (30 fps). To achieve this, we will use two-dimensional Look-Up-Tables (LUT) (each for x and y coordinates), which map the corrected pixel locations to the acquired-image pixel locations. To evaluate the feasibility of this approach, this process is simulated making use of parallel coding techniques to allow real-time distortion corrections for up to sixteen modules when a standard quad processor is used. The results of this simulation confirm that tiled field-of-views (FOV) comparable with those of flat panel detectors can be generated in ~17 ms (>30 fps). The increased FOV enabled through correction of tiled images, combined with the EMCCD characteristics of low noise, negligible lag and high sensitivity, should make possible the practical use of the SSXII with substantial advantages over conventional clinical systems.
Geometric tomography deals with the retrieval of information about a geometric object from data concerning its projections (shadows) on planes or cross-sections by planes. It is a geometric relative of computerized tomography, which reconstructs an image from X-rays of a human patient. The subject overlaps with convex geometry and employs many tools from that area, including some formulas from integral geometry. It also has connections to discrete tomography, geometric probing in robotics and to stereology. This comprehensive study provides a rigorous treatment of the subject. Although primarily meant for researchers and graduate students in geometry and tomography, brief introductions, suitable for advanced undergraduates, are provided to the basic concepts. More than 70 illustrations are used to clarify the text. The book also presents 66 unsolved problems. Each chapter ends with extensive notes, historical remarks, and some biographies. This edition includes numerous updates and improvements, with some 300 new references bringing the total to over 800.
Purpose: Breast radiotherapy, particularly IMRT, involves large dose gradients and difficult patient positioning problems. A critical requirement for successful treatment is accurate reproduction of the patient's position assumed during CT simulation and planning. We have developed an optical image‐guided technique, which assists in accurately and reproducibly positioning the patient, by displaying her real‐time optical image superimposed on a perspective projection image of her 3D CT data. Methods and Materials: The Single Projection Technique (SPT) accurately determines the 3‐D position and orientation of a camera from a single image acquired of a known model. A calibration jig, composed of ten identifiable reflecting spheres, was constructed and CT imaged to provide this model. To implement our method, a digital photograph of the jig was acquired and the 2D coordinates of the spheres were found. Using this information, 3D CT patient data is projected onto the camera's imaging plane, and is displayed on a monitor, superimposed on the real‐time patient image. This enables the therapist to view both the patient's current and desired positions, and guides proper patient positioning. Results: The SPT can determine the position and orientation of the camera to an accuracy of 0.2 cm and 0.3°, respectively. Investigations are ongoing to determine the accuracy and reproducibility of our method in terms of the dose distribution of IMRT plans. Film measurements performed on a breast phantom will allow us to determine the spatial accuracy of isodose curves measured in several planes. Conclusions: We have developed a method to calibrate an optical camera system and superimpose a perspective projection of a CT image on a patient's real‐time optical image. Displaying this visual information will assist in accurate setup during breast radiotherapy. Future work will enable us to quantify the setup and dose delivery accuracy of this technique.
With a steady increase of CT interventions, population dose is increasing. Thus, new approaches must be developed to reduce the dose. In this paper, we present a means for rapid identification and reconstruction of objects of interest in reconstructed data. Active shape models are first trained on sets of data obtained from similar subjects. A reconstruction is performed using a limited number of views. As each view is added, the reconstruction is evaluated using the active shape models. Once the object of interest is identified, the volume of interest alone is reconstructed, saving reconstruction time. Note that the data outside of the objects of interest can be reconstructed using fewer views or lower resolution providing the context of the region of interest data. An additional feature of our algorithm is that a reliable segmentation of objects of interest is achieved from a limited set of projections. Evaluations were performed using simulations with Shepp-Logan phantoms and animal studies. In our evaluations, regions of interest are identified using about 33 projections on average. The overlap of the identified regions with the true regions of interest is approximately 91%. The identification of the region of interest requires about 1/5 of the time required for full reconstruction, the time for reconstruction of the region of interest is currently determined by the fraction of voxels in the region of interest (i.e, voxels in region of interest/voxels in full volume). The algorithm has several important clinical applications, e.g., rotational angiography, digital tomosynthesis mammography, and limited view computed tomography.
 Stephen Rudin合作论文数Toshiba Stroke Research Center, University at Buffalo (SUNY)92
 Daniel Bednarek合作论文数School of Medicine and Biomedical Sciences, State University of New York at Buffalo77
 Ciprian N. Ionita合作论文数Department of Neurosurgery, University at Buffalo49
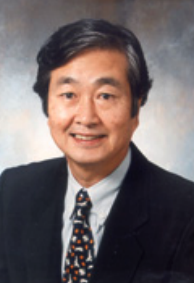 Kunio Doi合作论文数Department of Radiology, University of Chicago46
 Peter B. Noel合作论文数Department of Radiology, Perelman School of Medicine, University of Pennsylvania31
 Heber Macmahon合作论文数Department of Radiology, University of Chicago26
 Jinhui Xu (徐金辉)合作论文数School of Information Science and Technology, The Division of Information and Intelligence, University of Science and Technology of China23Ravishankar Chityala合作论文数20Alan M. Walczak合作论文数19
 Schaefer Sebastian合作论文数Cardiovascular and Metabolic Disorders, Duke-NUS Medical School16
 Vikas Patel合作论文数Aurora16
 Maryellen L. Giger合作论文数Department of Radiology, The University of Chicago15C Keleshis合作论文数15
 Jacqueline Esthappan Zoberi合作论文数15
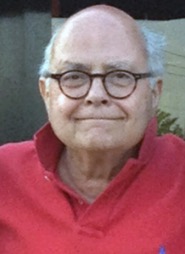 Charles E. Metz合作论文数The University of Chicago14Girijesh Yadava合作论文数14
 Fiebich Martin合作论文数13
 Vikas Singh合作论文数Department of Biostatistics & Medical Informatics, School of Medicine and Public Health, University of Wisconsin-Madison;Google13
 Abraham H. Dachman合作论文数The University of Chicago Medical Center;Pritzker School of Medicine, University of Chicago12
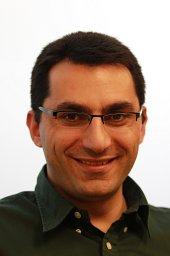 Iacovos S. Kyprianou合作论文数food and drug administration12D. Nazareth合作论文数11A Gopal合作论文数10Y Wu合作论文数10A Walczak合作论文数9Kg Chua合作论文数9
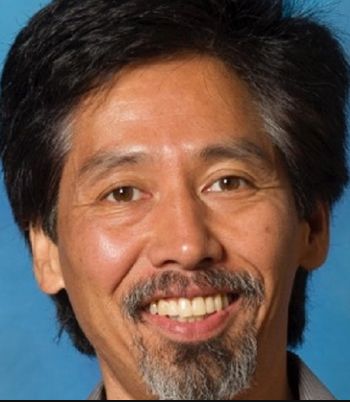 Robert Nishikawa合作论文数Center for Artificial Intelligence Innovation in Medical Imaging, University of Pittsburgh;Department of Radiology, University of Pittsburgh;Swanson School of Engineering, University of Pittsburgh9Hussain S. Rangwala合作论文数8Lan L合作论文数8Z Wang合作论文数7John D. Carroll合作论文数7
 Heang-Ping Chan合作论文数Computer-Aided Diagnosis-Artificial Intelligence Research Laboratory, Department of Radiology, Medical School, University of Michigan7
 Aleksandr a Verevkin合作论文数Department of Electrical and Computer Engineering and Laboratory of Laser Energetics, University of Rochester7Benjamin B. Williams合作论文数EPR Center for Viable Systems, Dartmouth Medical School7
 Anindya Sen合作论文数Department of Biological Sciences, Tata Institute of Fundamental Research7Y Samara合作论文数6
 Hui Meng合作论文数Department of Mechanical and Aerospace Engineering, School of Engineering and Applied Sciences, University at Buffalo, The State University of New York6A Kuhls-Gilcrist合作论文数6Thenkurussi Kesavadas合作论文数Dept. of Mechanical and Aerospace Engineering, University at Buffalo6Robert A. Schmidt合作论文数6
 Noam Alperin合作论文数Department of Radiology, University of Illinois6Ann M Paciorek合作论文数5
 Iman Borazjani合作论文数5H Harauchi合作论文数5Amit Jain合作论文数Toshiba Stroke & Vasc Res Ctr, Univ Buffalo5Shigehiko Katsuragawa合作论文数5
 Jason J. Corso合作论文数Department of Electrical Engineering and Computer Science, University of Michigan;Voxel51;Stevens Institute of Technology5Fred M. Behlen合作论文数5Snehal Kasodekar合作论文数5Zhenming Chen (陈振明)合作论文数5




