PDF file - 199KB, RNA was extracted from 18 human NSCLCs and 27 pancreatic directly xenografted low passage tumors. Levels of miR200c were measured by quantitative RT-PCR and mRNA levels of Mig6 and EGFR were determined by Affymetrix expression array. Expression levels of A. miR200c, B. Mig6 mRNA or C. EGFR mRNA transcripts were plotted against erlotinib responsiveness.
PDF file - 2120KB, FAK activity is significantly higher in erlotinib-resistant cells from lung and H and N origin. Total cell lysates were extracted from two pairs of lung (H358/H1703 and Calu3/Calu6) and two pairs of H and N (SCC-S/SCC-R and JHU011/JHU028) cancer cell lines and were subjected to immunoblot analysis with antibodies specific for phosphorylated and total FAK. Beta-actin was used a loading control.
AUC results of the drug sensitivity screens in conditionally reprogrammed PDAC cells.
PDF file - 127KB, Levels of Mig6 protein in the panel of 25 human cancer cell lines with known erlotinib resistance was identified by immunoblot analysis followed by densitometric quantification. The expression level of Mig6 was plotted against IC50 of corresponding cell line.
PDF - 75K, Normalized basal gene expression microarray data for non-squamous NSCLC NCI60 cell lines were grouped according to KRAS mutation status. Genes showing significant differences in expression between KRAS mutant and KRAS wildtype cells were analyzed using Ingenuity Pathway Analysis (IPA) and significantly different canonical pathways were identified.
PDF file - 108KB, TGFbeta induces EMT-associated kinase switch promotes erlotinib-resistance of tumor cells. A. Erlotinib sensitive cell lines H292 and SCC-S were treated with TGFβ1 (4 ng/ml) for 21 days and immunoblot analysis was performed with indicated antibodies. B. Parental and TGFbeta-induced H358 and SCC-S cells were treated with erlotinib for 72 hours and cell viability was assayed. Values were set at 100% for untreated controls. C. Protein lysates were extracted from H358 and SCC-S cells treated or untreated with TGFbeta for 21 days and immunoblot analysis was performed with antibodies against indicated phospho RTKs. Beta-actin was used as a loading control.
PDF file - 127KB, Levels of Mig6 protein in the panel of 25 human cancer cell lines with known erlotinib resistance was identified by immunoblot analysis followed by densitometric quantification. The expression level of Mig6 was plotted against IC50 of corresponding cell line.
PDF - 68K, Normalized basal gene expression microarray data for non-squamous NSCLC NCI60 cell lines were grouped according to KRAS mutation status. Genes showing significant differences in expression between KRAS mutant and KRAS wildtype cells were analyzed using Ingenuity Pathway Analysis (IPA) and significantly different upstream regulators were predicted.
PDF - 69K, Normalized basal gene expression microarray data for non-squamous NSCLC NCI60 cell lines were grouped according to KRAS mutation status. Genes showing significant differences in expression between KRAS mutant and KRAS wildtype cells were analyzed using Ingenuity Pathway Analysis (IPA) and genes predicted to be regulated by MYC were identified.
PDF file - 137KB, A. Mig6(mRNA)/miR200 ratios plotted on the linear scale. Each bar represents the Mig6(mRNA)/miR200 ratio of an indicated cell line. B. The exposure density of both EGFR and Mig6 blotted on the same membrane were quantified by densitometry and the values of Mig6/EGFR ration for every cell line were plotted on the linear scale.
Table S1. Genetic characterization of patient-derived xenografts using the Illumina Trusight panel capturing frequent mutations in 94 genes and 284 SNPs associated with cancer Table S3. Triptolide-induced effects on the mRNA abundance was determined by Illumina HighSeq RNA sequencing of 001 cells treated with 100 nM triptolide in vitro for 6 hours.
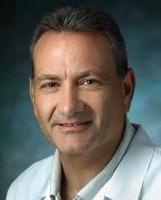 David Sidransky合作论文数The Sidney Kimmel Comprehensive Cancer Center, School of Medicine, Johns Hopkins University41
 Amanda Katz合作论文数22Ciznadija Daniel合作论文数15
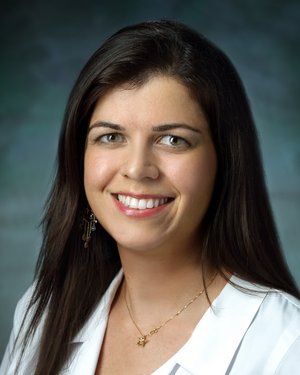 Mariana Brait合作论文数Head and Neck Cancer Research Lab, Department of Otolaryngology-Head and Neck Surgery, School of Medicine, The Johns Hopkins University13
 Evgeny Izumchenko合作论文数Committee on Cancer Biology, The University of Chicago13Vasquez David合作论文数13Kagohara Luciane T合作论文数Sidney Kimmel Comprehensive Cancer Center, Johns Hopkins University School of Medicine12Elizabeth Bruckheimer合作论文数11
 Igor Astsaturov合作论文数11Rajani K. Ravi合作论文数Department of Otolaryngology-Head and Neck Surgery, School of Medicine, Johns Hopkins University11
 Louis M. Weiner合作论文数Lombardi Comprehensive Cancer Center, Georgetown University;Department of Oncology, Georgetown University Medical Center11Xiaofei Chang合作论文数11Vladimir Khazak合作论文数11Sandra A. Jablonski合作论文数11Egor Bobrov合作论文数10Atul Bedi合作论文数Department of Otolaryngology-Head and Neck Surgery, School of Medicine, Johns Hopkins University10
 Christina Michailidi合作论文数10Gilson Baia合作论文数10
 Erica Golemis合作论文数Department of Cancer and Cellular Biology, Lewis Katz School of Medicine, Temple University;Fox Chase Cancer Center10
 Mohammad Hoque合作论文数Department of Otolaryngology-Head and Neck Surgery, School of Medicine, Johns Hopkins University10
 Ilya Serebriiskii合作论文数Fox Chase Cancer Center10Shizhang Ling合作论文数Departments of Pharmacology and Therapeutics, University of Calgary10Max Pressman合作论文数9Elena Lysenko合作论文数9Eugenia Banina合作论文数9Natalya Skobeleva合作论文数9John P. Hoffman合作论文数9Grigorii V. Andrianov合作论文数Fox Chase Canc Ctr, Program Mol Therapeut, Philadelphia, PA 19111 USA9Gabitova Linara合作论文数Program in Developmental Therapeutics, Fox Chase Cancer Center;Kazan Federal University9Restifo Diana合作论文数9Diana Behrens合作论文数9Michael Amatulli合作论文数8Natalya Beglyarova合作论文数8Ramilia Mukhamadeeva合作论文数7Yan Zhou合作论文数7James R Tonra合作论文数7Fernando López-Ríos合作论文数6Laura Brennan合作论文数6Siân Jones合作论文数6
 Pedro P. Lopez-Casas合作论文数Instituto de Investigación Sanitaria Hospital 12 de Octubre (imas12), Hospital Universitario 12 de Octubre6
 Victor E. Velculescu合作论文数Department of Genetic Medicine, School of Medicine, Johns Hopkins University;Delfi Diagnostics6Manuel Hidalgo Medina合作论文数Joan and Sanford I. Weill Department of Medicine, Weill Cornell Medicine, Cornell University6
 Angiuoli Samuel V合作论文数Personal Genome Diagnost, Baltimore, MD 21224 USA6Elena Garralda合作论文数Department of Medical Oncology, Vall d'Hebron University Hospital. Vall d'Hebron Institute of Oncology (VHIO)6Kann Lisa合作论文数6Sarno Francesca合作论文数6Sarah S Bacus合作论文数6
 Alfonso Valencia合作论文数Life Science Department, Barcelona Supercomputing Centre;INB Spanish National Bioinformatics Institute;IMPaCT Spanish Personalised Medicine initiative of the ISC-III6
 Fatima Al-Shahrour合作论文数Broad Institute6




