Ultra-thin atomic crystals are promising for fabricating next-generation photonic and optoelectronic devices. Wafer-scale characterization techniques are highly desired for efficient and accurate thickness identification of these crystals and their heterostructures. Optical contrast between atomic crystals and substrates based on Fresnel theory is a key technique for the identification of thicknesses. Both RGB color information and spectroscopic information have been explored for layer number counting and implemented with machine learning algorithms based on large amounts of data for feature extraction. In this work, a multispectral microscopic method combining the hardware design and deep-learning algorithms is developed. Multispectral image restoration during large-area scanning caused by optical imaging modality drifts and automated layer number identification based on multispectral grayscale images are studied using deep learning models: generative adversarial network (GAN) and 3D U-Net. These models are trained using custom-built multispectral data sets and evaluated quantitatively with indicators (Dice coefficient, confusion matrix, structural similarity). After these models are trained and tested, they are integrated into a graphic user interface for on-site identification use. The developed method provides a framework using multispectral images for 3D data reconstruction and segmentation and can be implemented for wafer-scale characterization of heterostructures containing different species of ultra-thin atomic crystals.
Zusammenfassung Die Lasertriangulation ist eine wichtige und häufig eingesetzte Messmethode in der absoluten Abstandsmessung. Dabei ist eines der Hauptprobleme, dass diese sehr anfällig gegenüber Verschiebungen des optomechanischen Aufbaus ist. So können bereits geringe Temperaturänderungen zu signifikanten Messabweichungen führen. In dieser Arbeit wird ein Kompensationsaufbau analysiert, mit dem wesentliche Fehlerquellen der Lasertriangulation eliminiert werden können. Durch thermische Simulationen wird gezeigt, dass sich durch die Kompensation bei Temperaturänderungen unter realen Bedingungen eine wesentliche Verbesserung der Messergebnisse erreichen lässt. Durch die Erweiterung der Kompensation um eine Berücksichtigung der Verschiebung der Kompensationsoptik kann die Messabweichung zusätzlich reduziert werden.
Two-dimensional van der Waals materials are attractive for photonics and optoelectronics due to distinctive layerdependent optical properties. Optical properties based on light-matter interactions have been revealed by modern imaging and spectroscopy techniques. Hyperspectral imaging microscopy working in line-scan mode (push-broom microspectroscopy) can provide abundant spectral information covering a large area compared to conventional spectroscopy techniques, with a higher acquisition speed than point-scan techniques such as atomic force microscopy and Raman imaging microscopy. This contribution studies in-depth the reconstruction of 3D datacubes and the extraction of optical responses of the sample. Monolayer MoS2, a subclass of semiconducting two-dimensional materials, is fabricated by the mechanical exfoliation method on the SiO2/Si substrate with an oxide thickness of 285 nm. The isolated monolayer MoS2 is observed and identified by a conventional optical microscope. The custom-built push-broom microspectroscope is utilized to scan the region of interest, with the whole spectrum of every line recorded at each frame. The spectral information of every point is collected and 3D spectral data sets are reconstructed for feature extraction and property analysis. To realize the thickness mapping of flakes, linear unmixing is employed to calculate the abundance of isolated monolayer MoS2 on the SiO2/Si substrate, improving flake identification performances. The characteristic spectrum of monolayer MoS2 is acquired by averaging the spectrum from the monolayer MoS2 flake. Furthermore, the optical dielectric response is further analyzed by Kramers-Kronig constrained analysis and Fresnel-law-based analysis. The optical dielectric function is calculated and compared based on the refractive index and medium thickness. This detailed analysis of optical dielectric responses highlights the feasibility of push-broom microspectroscopy for two-dimensional materials characterization.
 Alexander W. Koch合作论文数Institute for Measurement Systems and Sensor Technology, School of Computation, Information and Technology, Technical University of Munich3
 Martin Jakobi合作论文数3
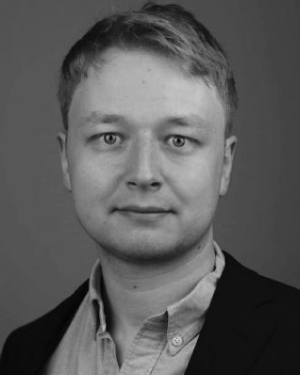 Michael H. Koehler合作论文数2
 Xingchen Dong合作论文数2
 Patrick Kienle合作论文数1
 Ali Yetisen合作论文数Department of Chemical Engineering, Faculty of Engineering, Imperial College London;School of Chemical Engineering, University of Birmingham1




