Food webs provide context to understand how ecological communities will respond to environmental change, but revealing their structure typically relies upon time-intensive sampling and analysis of species' diets. As a result, all food web models require some unavoidable simplifications because of limited data availability, whether temporally, spatially, or taxonomically. Large databases of published trophic interactions have made this process somewhat easier, but knowledge gaps persist. We combine the use of databases with extensive field surveys, including gut-content analysis, to generate a food web for Lake George, NY. Including aquatic plants, phytoplankton, zooplankton, macroinvertebrates, and fish, our analysis identified 279 genera in the lake involved in 1910 interactions. After removing genera with no identified interactions or improbable interactions and grouping some genera into higher categories, the food web included 49 nodes with 484 interactions among them. The network structure of the inferred Lake George food web exhibits several common patterns such as relatively few trophic levels and the prevalence of tritrophic chains. Our results suggest that constructing food webs from databases provides a useful first step to determine topology. However, in situ sampling allowed us to account for additional interactions, as only 50 of the 106 directly observed interactions between fish and their prey were also found in published databases. Finally, we highlight the need to focus on developing a better understanding of herbivory in lakes, as species interactions among the diverse plankton and macroinvertebrate populations are not well known.
The dynamics of populations in lake food webs are driven by a combination of spatial, environmental, and trophic processes. Differences among taxa in their ability to disperse and respond to the environment impact the food web and will be reflected in their abundances over time at different sites within a lake. The level of synchrony among lake sub-basins (within and across populations in a lake) is critical for determining the importance of spatial resolution when sampling and developing models. Using 7 years of survey data in Lake George, New York State (USA), we provide a high-level overview of changes in the densities of key food web groups over time (phytoplankton, zooplankton, and macroinvertebrates) and the synchrony of their dynamics among sub-basins. Phytoplankton biomass (measured as chlorophyll a ) and zooplankton densities showed strong seasonal and multi-year trends that were synchronous across space within each group. Several macroinvertebrate groups showed significant non-linear multi-year trends, but synchrony was lower. For phytoplankton and some macroinvertebrate groups, we found that densities were highest in the South Basin, likely reflecting the gradient of decreasing nutrients in the lake from south to north. Collectively, these results suggest that modeling the food web using sub-basins is a useful scale for better understanding species dynamics in large lakes.
To measure chlorophyll a (Chl a) fluorescence (F-chl), fluorometers use an excitation wavelength that is within the visible spectrum of most zooplankton, and as a result has the potential to cause a phototactic response in zooplankton. The transparent bodies of herbivorous zooplankton may allow viable chlorophyll a within an individual's digestive tract to fluoresce in response to sensor excitation light, resulting in measurement bias. To test for this bias, a fully factorial (+/- zooplankton and +/- light) experiment was conducted in an oligotrophic lake. Excitation light from fluorometers triggered a positive phototactic response during nighttime hours, resulting in swarms of zooplankton congregating beneath the sensor. The maximum hourly mean F-chl from nighttime/open treatments was higher and more variable than nighttime/zooplankton exclusion treatments, with the greatest single hour difference of 7.34 relative fluorescence units (RFU) vs. 0.26 RFU. In open treatments, sustained periods of F-chl exceeded 31x the values of exclusion treatments. A second series of experiments pulsed excitation lights in alternating periods in order to characterize zooplankton response times. Sensor bias was detected in as little as 20 s after initial illumination. Collectively, these results suggest that swarms of phototactic zooplankton can cause substantial bias in F-chl measurements at night. To correct for this bias, post-processing methods using time series decomposition were demonstrated to remove the majority of F-chl bias.
Stream nutrient concentrations exhibit marked temporal variation due to hydrology and other factors such as the seasonality of biological processes. Many water quality monitoring programs sample too infrequently (i.e., weekly or monthly) to fully characterize lotic nutrient conditions and to accurately estimate nutrient loadings. A popular solution to this problem is the surrogate-regression approach, a method by which nutrient concentrations are estimated from related parameters (e.g., conductivity or turbidity) that can easily be measured in situ at high frequency using sensors. However, stream water quality data often exhibit skewed distributions, nonlinear relationships, and multicollinearity, all of which can be problematic for linear-regression models. Here, we use a flexible and robust machine learning technique, Random Forests Regression (RFR), to estimate stream nitrogen (N) and phosphorus (P) concentrations from sensor data within a forested, mountainous drainage area in upstate New York. When compared to actual nutrient data from samples tested in the laboratory, this approach explained much of the variation in nitrate (89%), total N (85%), particulate P (76%), and total P (74%). The models were less accurate for total soluble P (47%) and soluble reactive P (32%), though concentrations of these latter parameters were in a relatively low range. Although soil moisture and fluorescent dissolved organic matter are not commonly used as surrogates in nutrient-regression models, they were important predictors in this study. We conclude that RFR shows great promise as a tool for modeling instantaneous stream nutrient concentrations from high-frequency sensor data, and encourage others to evaluate this approach for supplementing traditional (laboratory-determined) nutrient datasets.
In vivo fluorometers use chlorophyllafluorescence (F-chl) as a proxy to monitor phytoplankton biomass. However, the fluorescence yield ofF(chl)is affected by photoprotection processes triggered by increased irradiance (nonphotochemical quenching; NPQ), creating diurnal reductions inF(chl)that may be mistaken for phytoplankton biomass reductions. Published correction methods are mostly designed for pelagic oceans and are ill suited for inland waters or for high-frequency data collection. A machine learning-based method was developed to correct vertical profiler data from an oligotrophic lake. NPQ was estimated as a percent reduction inF(chl)by comparing daytime values to mean, unquenched values from the previous night. A random forest regression was trained on sensor data collected coincident withF(chl); including solar radiation, water temperature, depth, and dissolved oxygen saturation. The accuracy of the model was assessed using a grouped 10-fold cross validation (mean absolute error [MAE]: 7.6%; root mean square error [RMSE]: 10.2%), which was then used to correctF(chl)profiles. The model also predicted NPQ and corrected unseenF(chl)profiles from a future period with excellent results (MAE: 9.0%; RMSE: 14.4%).F(chl)profiles were then correlated to laboratory results, allowing corrected profiles to be compared directly to collected samples. The correction reduced error (RMSE) due to NPQ from 0.67 mu g L(-1)to 0.33 mu g L(-1)when compared to uncorrectedF(chl)data. These results suggest that the use of machine learning models may be an effective way to correct for NPQ and may have universal applicability.
Lake George (NY) is surrounded by Forever Wild Forest in the Adirondack Park and has a Class AA Special water quality rating, yet lake monitoring has revealed increasing anthropogenic impacts from salt and nutrient loading over the past 30 years. To reconstruct anthropogenic influence on the lake (e.g., salt loading, eutrophication, climate warming), we characterized modern stable isotopes and testate amoeba and diatom assemblages in surface sediments from 33 lake-wide sites and compared their variability to 36 years of water-quality data. Linear regression analyses support testate amoebae as rapid responders and recorders of environmental change because taxa are strongly correlated with percent change of important water quality parameters. Our assessment indicates that: 1) Netzelia gramen is associated with aquatic plants and filamentous algae, making them a valuable aquatic plant/alga indicator, which is supported by the co-occurrence of the diatom Cocconeis spp.; 2) difflugids are generally good indicators of eutrophication, except for Difflugia protaeiformis; and 3) seasonal differences in water quality trends are reflected in the fossil record on decadal time scales. We show that testate amoebae are highly sensitive to small environmental changes in an oligotrophic lake and exhibit established relationships from eutrophic and mesotrophic lakes as well as new, likely oligotrophic-specific correlations. Correlation coefficients of water quality variables and strains within a species also illustrate gradational relationships, suggesting testate amoebae exhibit ecophenotypic plasticity. Diatom and testate amoeba assemblages categorize modern lakebed sites into four subgroups: 1) benthic macrophyte; 2) high nutrient; 3) high alkalinity; and 4) salt loading assemblages.
Single-lake studies offer an opportunity for understanding, predicting, and mitigating local or regional threats to lake ecosystems. Our goal was to understand how concurrent environmental stressors such as climate change, eutrophication, and salinization affect long-term lake water quality. We report epilimnetic changes in 18 water-quality parameters collected at seven sites from 1980 to 2016 in Lake George, a large oligotrophic lake in the Adirondack Park, New York, USA. Improvements and deteriorations in water quality occurred over 37 years. We observed a 32% increase in chlorophyll a associated with an increase in orthophosphate, but not total phosphorus or a warming epilimnion (0.05 degrees C/year). Salinization from road deicing salts contributed to the largest deterioration in water quality. However, chloride concentrations and the current rate of increase are low enough that few ecological impacts are likely to occur over the next few decades. Increasing calcium concentrations were not high enough to facilitate the persistence of invasive species in the lake such as zebra mussels (Dreissena polymorpha) but are sufficient for Asian clams (Corbicula fluminea) and the spiny water flea (Bythotrephes longimanus). Similar to other lakes, environmental legislation has supported recovery from acidification, indicated by reduced sulfate and nitrate, and increased alkalinity and pH. Declines in water quality were minor relative to other lakes, suggesting that decades of tourism and development occurred without major deterioration in water quality, but management efforts are needed to curb salinization in the Lake George watershed, particularly as it relates to sodium concentrations to prevent a loss of drinking water quality.
Concurrent regional and global environmental changes are affecting freshwater ecosystems. Decadal-scale data on lake ecosystems that can describe processes affected by these changes are important as multiple stressors often interact to alter the trajectory of key ecological phenomena in complex ways. Due to the practical challenges associated with long-term data collections, the majority of existing long-term data sets focus on only a small number of lakes or few response variables. Here we present physical, chemical, and biological data from 28 lakes in the Adirondack Mountains of northern New York State. These data span the period from 1994-2012 and harmonize multiple open and as-yet unpublished data sources. The dataset creation is reproducible and transparent; R code and all original files used to create the dataset are provided in an appendix. This dataset will be useful for examining ecological change in lakes undergoing multiple stressors.
Groundwater inputs to two major streams along the southern end of Lake George attenuate summer temperatures resulting in deeper lake intrusion depths relative to other major streams. Between late April and early October, East and West Brook baseflow water temperatures generally were cooler than other major streams by ∼4 °C in mid-summer. Historical data for West Brook confirmed that the trend occurred as far back as 1970. As a consequence of cooler spring and summer temperatures coupled with higher salinity, deeper lake intrusion from these streams was hypothesized based on density calculations. Warmer streams entered the lake as overflow through late spring while East and West Brook intruded into the lake at depth. Upon stratification, East and West Brook intrude at or below the metalimnion while other monitored streams generally intrude at or above the metalimnion; by mid-August/early September all streams intruded below the metalimnion. High-resolution profiler data identified the presence of underflow during a fall storm event in 2014. Deeper intrusion depths of East and West Brook would supply organics and oxygen to the Caldwell Sub-basin hypolimnion which can potentially have both negative and positive effects on hypolimnetic oxygen depletion.
The Adirondack Mountain region is an extensive geographic area (26,305 km(2)) in upstate New York where acid deposition has negatively affected water resources for decades and caused the extirpation of local fish populations. The water quality decline and loss of an established brook trout (Salvelinus fontinalis [Mitchill]) population in Brooktrout Lake were reconstructed from historical information dating back to the late 1880s. Water quality and biotic recovery were documented in Brooktrout Lake in response to reductions of S deposition during the 1980s, 1990s, and 2000s and provided a unique scientific opportunity to re-introduce fish in 2005 and examine their critical role in the recovery of food webs affected by acid deposition. Using C and N isotope analysis of fish collagen and state hatchery feed as well as Bayesian assignment tests of microsatellite genotypes, we document in situ brook trout reproduction, which is the initial phase in the restoration of a preacidification food web structure in Brooktrout Lake. Combined with sulfur dioxide emissions reductions promulgated by the 1990 Clean Air Act Amendments, our results suggest that other acid-affected Adirondack waters could benefit from careful fish re-introduction protocols to initiate the ecosystem reconstruction of important components of food web dimensionality and functionality.
Lake George (NY) water temperature increased significantly between 1980 and 2009, leading to a longer aquatic growing season and increased degree-days. Surface water (0-10 m) temperatures increased by 0.063 and 0.051 C/yr, and degree-days increased by 229 and 195 degree-days in the North and South basins, respectively. The aquatic growing season increased by similar to 2 weeks, with extensions in both the spring and fall. The rate of warming, degree-days, and the duration of the growing season were consistently greater in the North Basin, due in part to a greater input of groundwater in the South Basin. Weather variables over the same time period changed significantly with wind speed and cloud cover decreasing, humidity and precipitation increasing, and no significant change identified for air temperature. Wind and cloud cover were correlated to the onset of the growing season and degree-days in both the North and South basins, suggesting they are influencing the lake thermal regime through reduced evaporative cooling in the fall, diminished spring mixing and increased solar radiation absorption. Warmer water temperatures have a myriad of consequences for aquatic ecosystems from increased primary production and shifting species composition to uncoupling of trophic dynamics and increased mineralization of organic carbon. While management practices are available for some of these issues, others have no management protocols, creating a foreseeable problem for lake managers in the future.
Road salt (NaCl) application around Lake George, New York, resulted in nearly tripling in-lake salt concentration between 1980 and 2009. Salt concentrations measured in 8 streams between 2007 and 2009 ranging in development from pristine to moderate resulted in 4 significantly different groups based on chloride concentrations. Chloride concentrations were significantly correlated to the amount of roadway surface within each sub-watershed, with chloride concentrations in the most impacted stream approaching 200 mg/L. In the more impacted streams, chloride concentrations were significantly and inversely correlated to discharge rate. The high road density around the more developed south end accounted for similar to 30% of the estimated road salt application, which created a chloride gradient within the lake that decreased as water flowed north to the single outlet. The continual and disproportionate input of road salt near the southern end of the lake strengthened the gradient over time to create 4 significantly different regions within the lake. While the consistent lake-wide increase seems to be open-ended, a steady-state salt concentration within the lake may occur in the near future. Based on change of lake chloride mass and export from the lake (2007-2009), an average lake-wide steady-state chloride concentration of similar to 17 mg/L is expected, with some variation anticipated due to interannual variation in precipitation and the salt gradient within the lake.
our many contributors has been essential to the progress we have made in understanding the state of Lake George water quality and its changing nature over time. We appreciate the thoughtful comments of Dr. on an earlier draft of this report. However, the final views and opinions presented herein remain solely those of the authors. In addition, we want to thank past and present FUND trustees, especially Dr.
Successful Eurasian watermilfoil (Myriophyllum spicatum L.) management requires the ability to rapidly establish the presence and relative abundance of the plant. Using hydroacoustics (BioSonics DT-X equipped with a 430-kHz transducer), we have developed a method to quickly survey the littoral zone for the presence of Eurasian watermilfoil. The algorithm developed to interpret hydroacoustics data makes it possible to distinguish Eurasian watermilfoil from native species. Physical growth parameters, including depth, lateral extent, percentage of water column occupied by the plant, and other parameters are used to locate or identify the plant based upon hydroacoustics data. After establishing the ability to accurately identify milfoil quickly and effectively, the method was utilized in 5 bays in the southern end of Lake George, New York. Survey results identified 6 previously unknown Eurasian watermilfoil sites and confirmed the existence of an additional 10 known locations.
The Adirondack Mountains in New York State have a varied surficial geology and chemically diverse surface waters that are among the most impacted by acid deposition in the U.S. No single Adirondack investigation has been comprehensive in defining the effects of acidification on species diversity, from bacteria through fish, essential for understanding the full impact of acidification on biota. Baseline midsummer chemistry and community composition are presented for a group of chemically diverse Adirondack lakes. Species richness of all trophic levels except bacteria is significantly correlated with lake acid-base chemistry. The loss of taxa observed per unit pH was similar: bacterial genera (2.50), bacterial classes (1.43), phytoplankton (3.97), rotifers (3.56), crustaceans (1.75), macrophytes (3.96), and fish (3.72). Specific pH criteria were applied to the communities to define and identify acid-tolerant (pH<5.0), acid-resistant (pH 5.0-5.6), and acid-sensitive (pH>5.6) species which could serve as indicators. Acid-tolerant and acid-sensitive categories are at end-points along the pH scale, significantly different at P<0.05; the acid-resistant category is the range of pH between these end-points, where community changes continually occur as the ecosystem moves in one direction or another. The biota acid tolerance classification (batc) system described herein provides a clear distinction between the taxonomic groups identified in these subcategories and can be used to evaluate the impact of acid deposition on different trophic levels of biological communities.
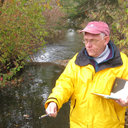 Charles W. Boylen合作论文数28
 James W. Sutherland合作论文数10
 Sandra A Nierzwicki-Bauer合作论文数9Farrell Jeremy L合作论文数7
 Rick Relyea合作论文数Johnny Morris Institute of Fisheries, Wetlands, and Aquatic Systems, University of Missouri-Columbia;School of Natural Resources, College of Agriculture, Food and Natural Resources, University of Missouri-Columbia7
 Matthew Schuler合作论文数Department of Biology, Indiana State University6
 Madsen, John Percival Vissing合作论文数University of Sydney6Mark A. Lucius合作论文数5
 Mark Swinton合作论文数Rensselaer Polytech Inst, Darrin Fresh Water Inst5
 Jonathan J. Borrelli合作论文数Rensselaer Polytech Inst4
 Jay Alan Bloomfield合作论文数4Donald F. Charles合作论文数3William Shaw合作论文数3Vincent W. Moriarty合作论文数3
 Brian M Mattes合作论文数Darrin Fresh Water Institute, Rensselaer Polytechnic Institute3Acker Frank W合作论文数3
 Eunice Calvete合作论文数3
 William D. Hintz合作论文数Department of Zoology 173 Life Science II, Southern Illinois University Fisheries and Illinois Aquaculture Center3
 Francine M G Mccarthy合作论文数3Robert A. Daniels合作论文数3j a cordoba合作论文数2B. Momen合作论文数2J.L. Nedel合作论文数2
 Joao Barbosa合作论文数2h d caceres合作论文数2j l de castro合作论文数2r san agustin合作论文数2t abadie合作论文数2Candace Schermerhorn合作论文数2
 Paul Michael Pilkington合作论文数2A.W.P. Ferreira Filho合作论文数2Erika Yates合作论文数2gonzalez m a molestina c j合作论文数2perez vicente l f gonzalez arias g合作论文数2r todd bombard合作论文数2Kenneth E. Johnston合作论文数2James P. Harrison合作论文数2
 Krystyna Kornecki合作论文数2Andrea M. Krueger合作论文数2s german合作论文数2
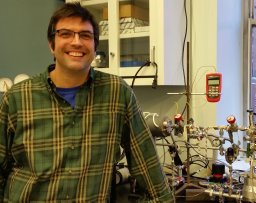 Morgan F. Schaller合作论文数Earth & Environm Sci, Rensselaer Polytech Inst2João Carlos Felício合作论文数2
 Timothy Sullivan合作论文数Department of Biology;Arizona State University;Department of Biology, Arizona State University2R. San Martin合作论文数2Jeffrey Bartkowski合作论文数2Mucio Silva Reis合作论文数2
 Luiz Carlos Federizzi合作论文数Faculdade de Agronomia;Universidade Federal do Rio Grande do Sul;Faculdade de Agronomia, Universidade Federal do Rio Grande do Sul2Elmar Luiz Floss合作论文数2




