The small-scale variability of solar radiation including 3D radiative effects is poorly observed and understood. In this study, we characterise the transition of global solar horizontal irradiance from sunshine to cloud shadow and attribute the transition signature to 3D radiative effects. This analysis is based on 5 case days with shallow cumulus clouds at the ARM Southern Great Plains Central Observatory. Observations are conducted by PyrNet, a network of 60 autonomous pyranometer stations deployed during a field campaign in summer 2023. Complementary observations of cloud mask and shadow motion are derived from the Clouds Optically Gridded by Stereo (COGS) product. Concentrating on shallow cumulus clouds, we explore how geometrical effects and the macro- and microphysical properties of clouds affect the pattern of solar irradiance variation close to the cloud shadow edge. Individual cloud entities and cloud motion vectors are identified using COGS. We discovered that the amplitude of radiation enhancement can reach 20 % above the clear sky values. Significant influence factors are the size of the cloud gaps, the height of the cloud base and the geometry between the sun and the clouds. The distance from the cloud at which radiation enhancement remains significant depends on the effective radius of the cloud droplets, cloud optical depth, and solar zenith angle. Our findings underscore the necessity of accounting for these 3D effects in atmospheric modelling to enhance the representation of solar radiation processes and are a step towards the development of transition signature parametrisations for photovoltaic energy applications.
Biomass burning aerosol (BBA) from agricultural fires in southern Africa contributes about one-third of the global carbonaceous aerosol load. These particles have strong radiative effects in the southeast Atlantic (SEA), which depend in part on the radiative contrast between the aerosol layer in the free troposphere (FT) and the underlying cloud layer. However, there is large disagreement in model estimates of aerosol-driven climate forcing due to uncertainties in the vertical distribution, optical properties, and life cycle of these particles. This study applies a novel method combining remote sensing observations with regional model outputs to investigate the aging of the BBA and its impact on the optical properties during transatlantic transport from emission sources in Africa to the SEA. Results show distinct variations in extinction Ångström exponent (EAE) and single-scattering albedo (SSA) as aerosols age. Near the source, fresh aerosols are characterized by low mean SSA (0.84) and high EAE (1.85), indicating smaller, highly absorbing particles. By isolating marine contributions from the total column during BBA transport across the SEA, our analysis reveals an initial decrease in BBA absorptivity, with mean FT SSA of 0.87 after 6–7 d, followed by increased absorptivity with mean FT SSA of 0.84 after 10 d, suggesting enhanced absorption due to chemical aging. These findings indicate that BBA becomes more absorbing during extended transport across the SEA, with implications for reducing model uncertainties. Our remote-sensing-based results agree well with previous in situ studies and offer new insights into aerosol–radiation interactions and the energy balance over the SEA.
Ozone (O-3) is a secondary atmospheric pollutant that can adversely impact human health, with production rates dependent on chemical precursors such as nitrogen oxides (NOx), Volatile Organic Compounds (VOCs), as well as meteorological variables such as incoming solar radiation, temperature, and humidity. NOx concentrations in Salt Lake City, UT (SLC), have decreased significantly since 2000 (-60%). However, during this time minimal declines in O-3 were observed. To better understand the drivers behind O-3 trends in SLC, we leveraged air quality measurements from sites maintained by the Utah Division of Air Quality, along with mobile O-3 measurements collected on top of a light-rail train that traverses the Salt Lake Valley (SLV). Analyses were carried out from March 15th through April (spring) and June through August (summer) for 2019, 2020, and 2021 and focused on the afternoon when O-3 was typically at the highest concentrations (1-4 p.m. MST). Overall, there were large differences in O-3 between the spring and summer months, with the latter being higher by similar to 10 ppb. However, there were relatively small differences in O-3 between weekday and weekend. For the spring, differences in afternoon O-3 concentrations were higher during weekends (<12%), while during the summer, the differences were smaller (1-2%) and higher during weekdays. While weekday vs weekend differences in NOx emissions are usually large (similar to 20%) due to changes in traffic activity, there were relatively minimal differences in O-3 between weekday and weekends. There were minimal differences at point locations such as downtown SLC, and along multiple points along the TRAX train line. The analyses carried out in this study suggests that cities such as SLC are primarily under the influence of VOC-limited chemical regimes, meaning that there is limited O-3 sensitivity to changes in NOx. These results suggest that reducing VOC emissions, would be the most effective approach for reducing O-3 pollution in cities like SLC.
Inadequate knowledge about the complex microphysical and optical processes of the aerosol–cloud system severely restricts our ability to quantify the resultant impact on climate. Contrary to the negative radiative forcing (cooling) exerted by aerosols in cloud-free skies over dark surfaces, the absorbing aerosols, when lofted over the clouds, can potentially lead to significant warming of the atmosphere. The sign and magnitude of the aerosol radiative forcing over clouds are determined mainly by the amount of aerosol loading, the absorption capacity of aerosols or single-scattering albedo (SSA), and the brightness of the underlying cloud cover. In satellite-based algorithms that use measurements from passive sensors, the assumption of aerosol SSA is known to be the largest source of uncertainty in quantifying above-cloud aerosol optical depth (ACAOD). In this paper, we introduce a novel synergy algorithm that combines direct airborne measurements of ACAOD and the top-of-atmosphere (TOA) spectral reflectance from Ozone Monitoring Instrument (OMI) and Moderate Resolution Imaging Spectroradiometer (MODIS) sensors of NASA's A-train satellites to retrieve (1) SSA of light-absorbing aerosols lofted over the clouds and (2) aerosol-corrected cloud optical depth (COD). Radiative transfer calculations show a marked sensitivity of the TOA measurements to ACAOD, SSA, and COD, further suggesting that the availability of accurate ACAOD allows retrieval of SSA for above-cloud aerosol scenes using the “color ratio” algorithm developed for satellite sensors carrying ultraviolet (UV) and visible-near-IR (VNIR) wavelength bands. The proposed algorithm takes advantage of airborne measurements of ACAOD acquired from the High Spectral Resolution Lidar-2 (HSRL-2) and Spectrometer for Sky-Scanning, Sun-Tracking Atmospheric Research (4STAR) sun photometer operated during the ORACLES (ObseRvations of Aerosols above CLouds and their intEractionS) field campaign (September 2016, August 2017, and October 2018) over the southeastern Atlantic Ocean and synergizes them with TOA reflectance from OMI and MODIS to derive spectral SSA in the near-UV (354–388 nm) and VNIR (470–860 nm), respectively. When compared against the ORACLES airborne remote sensing and in situ measurements and the inversion dataset of the ground-based Aerosol Robotic Network (AERONET) over land, the retrieved spectral SSAs from the satellites, on average, were found to be within agreement of ∼ 0.01 – the difference well within the uncertainties involved in all these inversion datasets. The retrieved SSA above the clouds at UV–Vis-NIR wavelengths shows a distinct increasing trend from August to October, which is consistent with the ORACLES in situ measurements, AERONET inversions, and previous findings. The sensitivity analysis quantifying theoretical uncertainties in the retrieved SSA shows that errors in the measured ACAOD, aerosol layer height, and the ratio of the imaginary part of the refractive index (spectral dependence) of aerosols by 20 %, 1 km, and 10 %, respectively, produce an error in the retrieved SSA at 388 nm (470 nm) by 0.017 (0.015), 0.008 (0.002), and 0.03 (0.005). The development of the proposed aerosol–cloud algorithm implies a possible synergy of Cloud–Aerosol Lidar with Orthogonal Polarization (CALIOP) and OMI–MODIS passive sensors to deduce a global product of ACAOD and SSA. Furthermore, the presented synergy algorithm assumes implications for future missions, such as the Atmosphere Observing System (AOS) and the Earth Cloud Aerosol and Radiation Explorer (EarthCARE). The availability of the intended global dataset can help constrain climate models with the much-needed observational estimates of the radiative effects of aerosols in cloudy regions and expand our ability to study aerosol effects on clouds.
Biomass burning (BB) is one of the largest sources of absorbing aerosols globally and accounts for about 40% of black carbon in the atmosphere. The Southern African region contributes approximately 35% of Earth’s BB aerosol emissions. During the Southern Hemisphere winter, smoke is transported over the southeast Atlantic Ocean, overlying and mixing with a semi-permanent stratocumulus cloud deck. Aerosol-cloud interactions contribute the largest uncertainty to anthropogenic forcing, and the southeast Atlantic region exhibits a large model-to-model divergence of climate forcing. This makes the region particularly valuable for understanding these interactions and was one of the factors motivating the three-year NASA ORACLES (ObseRvations of Aerosols above CLouds and their intEractionS) mission. Previous studies using ORACLES datasets have explored the distribution of aerosol and cloud particles, however, changes in some aerosol properties during transport are not well documented. This study investigates the evolution of biomass burning aerosol properties from emission within Southern Africa, transport over land, and then over the Atlantic. Measurements from a collection of airborne in situ and remote-sensing instruments including 4STAR (Spectrometer for Sky-Scanning, Sun-Tracking Atmospheric Research) along with ground-based AERONET (Aerosol Robotic Network) are combined with results from two regional models, the WRF-AAM and WRF-CAM5 to explore the changes in the optical properties of these smoke plumes as they age. The aerosol age is determined using tracers from the WRF-AAM configured with 12 km resolution over the region’s spatial domain (41 ºS – 14 ºN, 34 ºW – 51 ºE). Changes in extinction, single scattering Albedo (SSA) and angstrom exponent (AE) with age as well as a comparative analysis between observations and model results were carried out using datasets from airborne PSAP (Particle Soot Absorption Photometer) and nephelometers, 4STAR, AERONET, and WRF-CAM5.
While mobile, vehicle-based sampling of air quality has provided insights into pollutant distributions within cities, previous research has been limited in using observed pollution hotspots to identify and localize unknown emission sources away from the road. Such “hyperlocal source identification” requires hotspots identified through mobile sampling to be linked to emission sources by tracing atmospheric transport upwind from observed hotspots. Here we analyze almost one year's worth of pollutant observations from two Google Street View cars driven around the Salt Lake area, with repeated sampling in select neighborhoods. We then present a method to bridge the gap in hyperlocal source identification by using a high-resolution atmospheric transport model, as part of a new Stochastic Lagrangian Monte Carlo (SLMC) method to identify emission sources based on mobile observations. Case studies with both known and unknown sources are presented to illustrate the efficacy of the SLMC method in hyperlocal source identification. With the availability of techniques like SLMC, we envision mobile air quality monitoring vehicles can serve as “roving sentinels” in identifying unknown pollution sources.
The COVID‐19 pandemic resulted in a widespread lockdown during the spring of 2020. Measurements collected on a light rail system in the Salt Lake Valley (SLV), combined with observations from the Utah Urban Carbon Dioxide Network observed a notable decrease in urban CO 2 concentrations during the spring of 2020 relative to previous years. These decreases coincided with a ∼30% reduction in average traffic volume. CO 2 measurements across the SLV were used within a Bayesian inverse model to spatially allocate anthropogenic emission reductions for the first COVID‐19 lockdown. The inverse model was first used to constrain anthropogenic emissions for the previous year (2019) to provide the best possible estimate of emissions for 2020, before accounting for emission reductions observed during the COVID‐19 lockdown. The posterior emissions for 2019 were then used as the prior emission estimate for the 2020 COVID‐19 lockdown analysis. Results from the inverse analysis suggest that the SLV observed a 20% decrease in afternoon CO 2 emissions from March to April 2020 (−90.5 tC hr −1 ). The largest reductions in CO 2 emissions were centered over the northern part of the valley (downtown Salt Lake City), near major roadways, and potentially at industrial point sources. These results demonstrate that CO 2 monitoring networks can track reductions in CO 2 emissions even in medium‐sized cities like Salt Lake City.
Urban regions emit a large fraction of anthropogenic emissions of greenhouse gases (GHG) such as carbon dioxide (CO2) and methane (CH4) that contribute to modern-day climate change. As such, a growing number of urban policymakers and stakeholders are adopting emission reduction targets and implementing policies to reach those targets. Over the past two decades research teams have established urban GHG monitoring networks to determine how much, where, and why a particular city emits GHGs, and to track changes in emissions over time. Coordination among these efforts has been limited, restricting the scope of analyses and insights. Here we present a harmonized data set synthesizing urban GHG observations from cities with monitoring networks across North America that will facilitate cross-city analyses and address scientific questions that are difficult to address in isolation.
Utah has a rich history related to air pollution; however, it is not widely known or documented. This is despite air quality being a top issue of public concern for the state's urban residents and acute episodes that feature some of the world's worst short-term particulate matter exposure. As we discuss in this narrative review, the relationship between air pollution and the state's residents has changed over time, as fuel sources shifted from wood to coal to petroleum and natural gas. Air pollution rose in prominence as a public issue in the 1880s as Utah's urban areas grew. Since then, scientific advances have increased the understanding of air quality impacts on human health, groups of concerned citizens worked to raise public awareness, policy makers enacted legislation to improve air quality, and courts upheld rights to clean air. Utah's air quality future holds challenges and opportunities and can serve as useful case for other urbanizing regions struggling with air quality concerns. Population growth and changing climate will exacerbate current air quality trends, but economically viable clean energy technologies can be deployed to reduce air pollution, bringing substantial public health and economic benefits to the state's residents and other settings with similar public health concerns.
We tested the capabilities of urban greenhouse gas (GHG) measurement networks to detect abrupt changes in emissions, such as those caused by the roughly 6-week COVID-19 lockdown in March 2020 using hourly in situ GHG mole fraction measurements from six North American cities. We compared observed changes in CO 2 , CO, and CH 4 for different mole fraction metrics (diurnal amplitude, vertical gradients, enhancements, within-hour variances, and multi-gas enhancement ratios) during 2020 relative to previous years for three periods: pre-lockdown, lockdown, and ongoing recovery. The networks showed decreases in CO 2 and CO metrics during the lockdown period in all cities for all metrics, while changes in the CH 4 metrics were variable across cities and not statistically significant. Traffic decreases in 2020 were correlated with the changes in GHG metrics, whereas changes in meteorology and biology were not, implying that decreases in the CO 2 and CO metrics were related to reduced emissions from traffic and demonstrating the sensitivity of these tower networks to rapid changes in urban emissions. The enhancements showed signatures of the lockdowns more consistently than the three micrometeorological methods, possibly because the urban measurements are collected at relatively high altitudes to be sensitive to whole-city emissions. This suggests that urban observatories might benefit from a mixture of measurement altitudes to improve observational network sensitivity to both city-scale and more local fluxes.
Wintertime episodes of high aerosol concentrations occur frequently in urban and agricultural basins and valleys worldwide. These episodes often arise following development of persistent cold-air pools (PCAPs) that limit mixing and modify chemistry. While field campaigns targeting either basin meteorology or wintertime pollution chemistry have been conducted, coupling between interconnected chemical and meteorological processes remains an insufficiently studied research area. Gaps in understanding the coupled chemical-meteorological interactions that drive high pollution events make identification of the most effective air-basin specific emission control strategies challenging. To address this, a September 2019 workshop occurred with the goal of planning a future research campaign to investigate air quality in Western U.S. basins. Approximately 120 people participated, representing 50 institutions and 5 countries. Workshop participants outlined the rationale and design for a comprehensive wintertime study that would couple atmospheric chemistry and boundary-layer and complex-terrain meteorology within western U.S. basins. Participants concluded the study should focus on two regions with contrasting aerosol chemistry: three populated valleys within Utah (Salt Lake, Utah, and Cache Valleys) and the San Joaquin Valley in California. This paper describes the scientific rationale for a campaign that will acquire chemical and meteorological datasets using airborne platforms with extensive range, coupled to surface-based measurements focusing on sampling within the near-surface boundary layer, and transport and mixing processes within this layer, with high vertical resolution at a number of representative sites. No prior wintertime basin-focused campaign has provided the breadth of observations necessary to characterize the meteorological-chemical linkages outlined here, nor to validate complex processes within coupled atmosphere-chemistry models.
The 2085 km(2) Jordan River Basin, and its seven sub-catchments draining the Central Wasatch Range immediately east of Salt Lake City, UT, are home to an array of hydrologic, atmospheric, climatic and chemical research infrastructure that collectively forms the Wasatch Environmental Observatory (WEO). WEO is geographically nested within a wildland to urban land-use gradient and built upon a strong foundation of over a century of discharge and climate records. A 2200 m gradient in elevation results in variable precipitation, temperature and vegetation patterns. Soil and subsurface structure reflect systematic variation in geology from granitic, intrusive to mixed sedimentary clastic across headwater catchments, all draining to the alluvial or colluvial sediments of the former Lake Bonneville. Winter snowfall and spring snowmelt control annual hydroclimate, rapid population growth dominates geographic change in lower elevations and urban gas and particle emissions contribute to episodes of severe air pollution in this closed-basin. Long-term hydroclimate observations across this diverse landscape provide the foundation for an expanding network of infrastructure in both montane and urban landscapes. Current infrastructure supports both basic and applied research in atmospheric chemistry, biogeochemistry, climate, ecology, hydrology, meteorology, resource management and urban redesign that is augmented through strong partnerships with cooperating agencies. These features allow WEO to serve as a unique natural laboratory for addressing research questions facing seasonally snow-covered, semi-arid regions in a rapidly changing world and an excellent facility for providing student education and research training.
Air pollution causes more damage to health and economy than previously understood, contributing to approximately one in six deaths globally. However, pollution reduction policies remain controversial even when proven effective and cost negative, partially because of misunderstanding and growing mistrust in science. We used an expert assessment to bridge these research–policy divides in the State of Utah, USA, combining quantitative estimates from 23 local researchers and specialists on the human health and economic costs of air pollution. Experts estimated that air pollution in Utah causes 2480 to 8000 premature deaths annually (90% confidence interval) and decreases the median life expectancy by 1.1 to 3.6 years. Economic costs of air pollution in Utah totaled $0.75 to $3.3 billion annually, up to 1.7% of the state’s gross domestic product. Though these results were generally in line with available estimates from downscaled national studies, they were met with surprise in the state legislature, where there had been an almost complete absence of quantitative health and economic cost estimates. We discuss the legislative and personal responses of Utah policy makers to these results and present a framework for increasing the assimilation of data into decision making via regional expert assessment. In conclusion, combining quantitative assessments from local experts is a responsive and cost-effective tool to increase trust and information uptake during time-sensitive policy windows.
Urban environments are characterized by pronounced spatiotemporal heterogeneity, which can present sampling challenges when utilizing conventional greenhouse gas (GHG) measurement systems. In Salt Lake City, Utah, a GHG instrument was deployed on a light rail train car that continuously traverses the Salt Lake Valley (SLV) through a range of urban typologies. CO2 measurements from a light rail train car were used within a Bayesian inverse modeling framework to constrain urban emissions across the SLV during the fall of 2015. The primary objectives of this study were to (1) evaluate whether ground-based mobile measurements could be used to constrain urban emissions using an inverse modeling framework and (2) quantify the information that mobile observations provided relative to conventional GHG monitoring networks. Preliminary results suggest that ingesting mobile measurements into an inverse modeling framework generated a posterior emission estimate that more closely aligned with observations, reduced posterior emission uncertainties, and extends the geographical extent of emission adjustments.
Utah’s low-smoking population and high population density concentrated in mountain valleys, with intermittent industrial activity and frequent temperature inversions, have yielded unique opportunities to study air pollution. These studies have contributed to the understanding of the human health impacts of air pollution. The populated mountain valleys of Utah experience considerable variability in concentrations of ambient air pollution because of local emission sources that change over time and episodic atmospheric conditions that result in elevated concentrations of air pollution. Evidence from Utah studies indicates that air pollution, especially combustion-related fine particulate matter air pollution and ozone, contributes to various adverse health outcomes, including respiratory and cardiovascular morbidity and mortality and increased risk of lung cancer. The evidence suggests that air pollution may also contribute to risk of pre-term birth, pregnancy loss, school absences, and other adverse health outcomes.
One of the primary challenges associated with evaluating smoke models is the availability of observations. The limited density of traditional air quality monitoring networks makes evaluating wildfire smoke transport challenging, particularly over regions where smoke plumes exhibit significant spatiotemporal variability. In this study, we analyzed smoke dispersion for the 2018 Pole Creek and Bald Mountain Fires, which were located in central Utah. Smoke simulations were generated using a coupled fire‐atmosphere model, which simultaneously renders fire growth, fire emissions, plume rise, smoke dispersion, and fire‐atmosphere interactions. Smoke simulations were evaluated using PM2.5 observations from publicly accessible fixed sites and a semicontinuously running mobile platform. Calibrated measurements of PM2.5 made by low‐cost sensors from the Air Quality and yoU (AQ&U) network were within 10% of values reported at nearby air quality sites that used Federal Equivalent Methods. Furthermore, results from this study show that low‐cost sensor networks and mobile measurements are useful for characterizing smoke plumes while also serving as an invaluable data set for evaluating smoke transport models. Finally, coupled fire‐atmosphere model simulations were able to capture the spatiotemporal variability of wildfire smoke in complex terrain for an isolated smoke event caused by local fires. Results here suggest that resolving local drainage flow could be critical for simulating smoke transport in regions of significant topographic relief.
 John Chun-Han Lin合作论文数Department of Atmospheric Sciences, University of Utah;Wilkes Center for Climate Science & Policy, University of Utah;Utah-Atmospheric Trace Gas & Air Quality Lab24
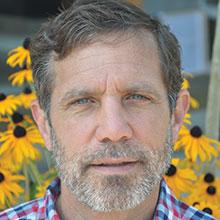 Ed Brook合作论文数College of Earth Ocean, and Atmospheric Sciences, Oregon State University21
 Daniel Mendoza合作论文数Department of Atmospheric Sciences, Purdue University17
 Ryan Bares合作论文数14
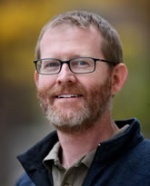 David R. Bowling合作论文数School of Biological Sciences, College of Science, The University of Utah;Biogeosciences Research Group, Department of Biology, The University of Utah12
 Jeffrey Severinghaus合作论文数Geosciences Research Division, Scripps Institution of Oceanography, University of California, San Diego11
 Derek V. Mallia合作论文数Department of Atmospheric Science, University of Utah11
 Jim Ehleringer合作论文数School of Biological Sciences, University of Utah10
 Daniel Baggenstos合作论文数Scripps Institution of Oceanography, University of California;Scripps Institution of Oceanography, University of California10
 Erik T. Crosman合作论文数Department of Atmospheric Sciences, University of Utah10
 John Horel合作论文数Department of Atmospheric Sciences, College of Mines and Earth Sciences, The University of Utah10
 Benjamin Fasoli合作论文数Dept Atmospher Sci, Univ Utah8
 Xavier Fain合作论文数Grenoble Alpes University;Laboratoire De Glaciologie Et Géophysique De L'environnement, French National Centre for Scientific Research8
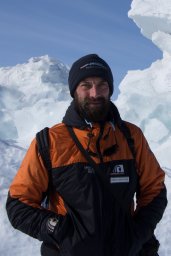 Hinrich Schaefer合作论文数Department of Geosciences, Oregon State University8Adrian Schilt合作论文数8
 Thomas Keith Bauska合作论文数Department of Earth Sciences, University of Cambridge8
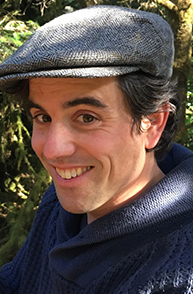 Christo Buizert合作论文数College of Earth, Ocean, and Atmospheric Sciences, Oregon State University8
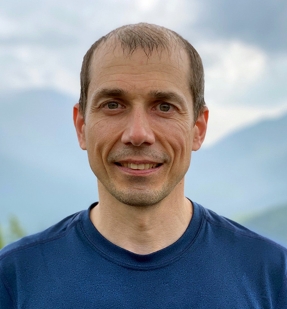 Vasilii Petrenko合作论文数Ice Core and Atmospheric Chemistry Lab, Department of Earth and Environmental Sciences, School of Arts & Sciences, University of Rochester8
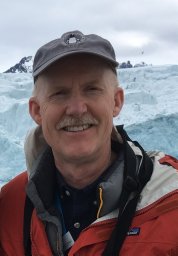 Joseph R. Mcconnell合作论文数Division of Hydrologic Sciences, Desert Research Institute8
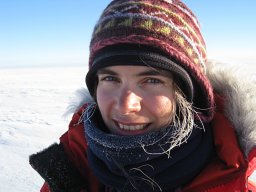 Anais J. Orsi合作论文数Earth Ocean & Atmospher Sci Dept, Univ British Columbia7
 Ray Weiss合作论文数Scripps Institution of Oceanography, University of California San Diego7
 Courtenay Strong合作论文数University of California, Irvine Irvine CA 92697 USA7Ben Fasoli合作论文数6
 Todd Sowers合作论文数Earth and Environmental Systems Institute, College of Earth and Mineral Sciences, Pennsylvania State University;Department of Geosciences, College of Earth and Mineral Sciences, Pennsylvania State University6
 Diane Pataki合作论文数School of Sustainability, College of Global Futures, Arizona State University6
 Katja Riedel合作论文数6Christina M. Harth合作论文数6
 Britton B. Stephens合作论文数Scripps Institution of Oceanography, University of California6
 Connor Flynn合作论文数6jc lin合作论文数5Douglas Catharine合作论文数5Sebastian Hoch合作论文数5julia rosen合作论文数5
 Alexander A. Jacques合作论文数Univ Utah, Dept Atmospher Sci, Salt Lake City, UT 84112 USA5Munkhbayar Baasandorj合作论文数5
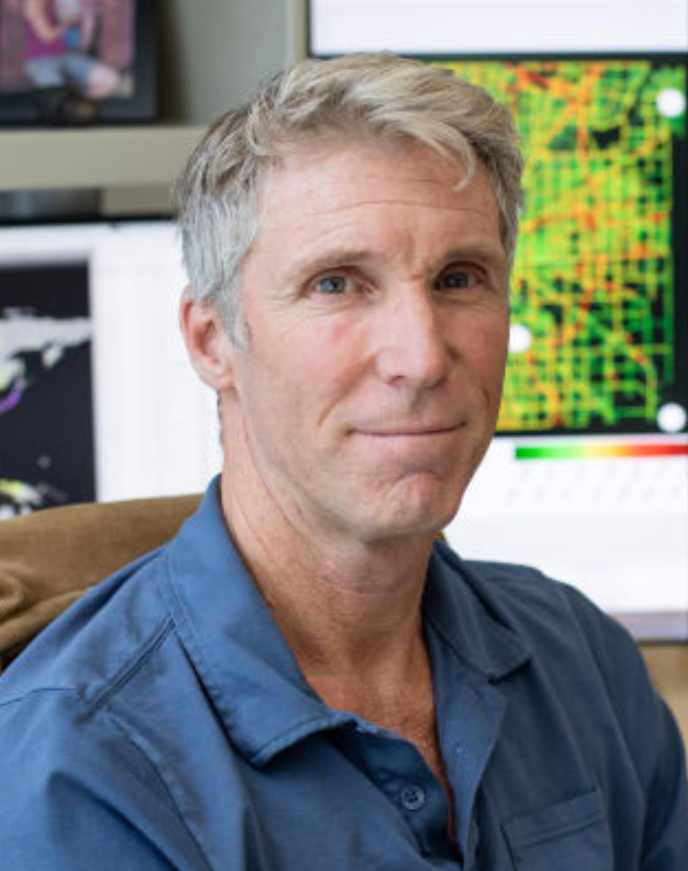 Kevin Gurney合作论文数School of Informatics, Computing and Cyber Systems, Northern Arizona University;Crosswalk Labs5
 Susan E. Bush合作论文数Department of Biology, University of Utah5
 Quan Hua合作论文数Physics Division;Private Mail Bag;Physics Division|Private Mail Bag5
 Lucy Hutyra合作论文数Dept Earth & Environm, Boston Univ5B. Fasoli合作论文数4
 Samuel E. LeBlanc合作论文数Ames Res Ctr, NASA4
 Conor K. Gately合作论文数Department of Earth and Environment, Boston University4Kristina Pistone合作论文数Scripps Institution of Oceanography, University of California4
 Scott J. Richardson合作论文数Department of Meteorology and Atmospheric Science, College of Earth and Mineral Sciences, Penn State University4
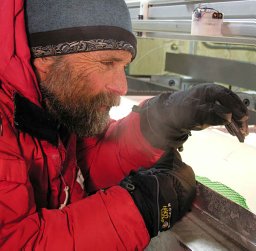 Kendrick C. Taylor合作论文数Desert Research Institute4
 Riley M. Duren合作论文数Jet Propulsion Laboratory;California Institute of Technology;Jet Propulsion Laboratory, California Institute of Technology4
 Jens Redemann合作论文数CLoud-CLimatE-Aerosol-Radiation Research Group, School of Meteorology, College of Atmospheric and Geographic Sciences, University of Oklahoma4
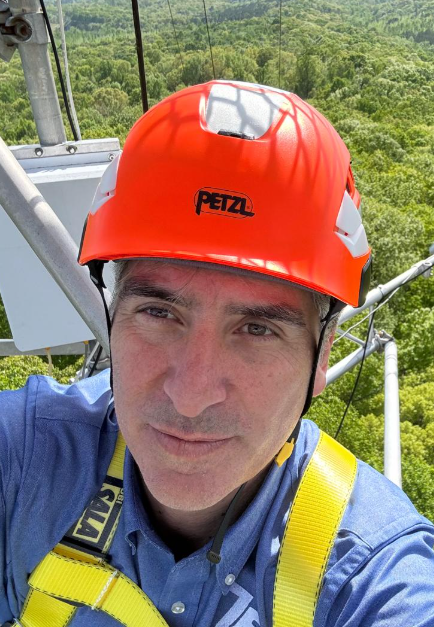 Ariel Stein合作论文数Air Resources Laboratory, National Oceanic and Atmospheric Administration4Thomas Blunier合作论文数4




