Much theoretical and observational work has been devoted to studying the occurrence of F region polar cap patches in the Northern Hemisphere; considerably less work has been applied to the Southern Hemisphere. In recent years, the Madrigal database of mappings of total electron content (TEC) has improved in Southern Hemisphere coverage, to the point that we can now carry out a study of patch frequency and occurrence. We find that Southern Hemisphere patch occurrence is very similar to that of the Northern Hemisphere with a half‐year offset, plus an offset in universal time of approximately 12 hr. This is further supported by running an ionospheric model for both hemispheres and applying the same patch‐to‐background technique. Further, we present a simple physical mechanism involving a sunlit dayside plasma source concurrent with a dark polar cap, which yields a patch‐to‐background pattern very much like that seen in the TEC mappings for both hemispheres.
Space weather deposits energy into the high polar latitudes, primarily via Joule heating that is associated with the Poynting flux electromagnetic energy flow between the magnetosphere and ionosphere. One way to observe this energy flow is to look at the ionospheric electron density profile (EDP), especially that of the topside. The altitude location of the ionospheric peak provides additional information on the net field‐aligned vertical transport at high latitudes. To date, there have been few studies in which physics‐based ionospheric model storm simulations have been compared with topside EDPs. A rich database of high‐latitude topside ionograms obtained from polar orbiting satellites of the International Satellites for Ionospheric Studies (ISIS) program exists but has not been utilized in comparisons with physics‐based models. Of specific importance is that the Alouette/ISIS topside EDPs spanned the timeframe from 1962 to 1983, a period that experienced very large geomagnetic storms. We use a physics‐based ionospheric model, the Utah State University Time Dependent Ionospheric Model (TDIM), to simulate ionospheric EDPs for quiet and storm high‐latitude passes of ISIS‐II for two geomagnetic storms. This initial study finds that under quiet conditions there is good agreement between model and observations. During disturbed conditions, however, a large difference is seen between model and observations. The model limitation is probably associated with the inability of its topside boundary to replicate strong outflow conditions. As a result, modeling of the ionospheric outflows needs to be extended well into the magnetosphere, thereby moving the upper boundary much higher and requiring the use of polar wind models.
The source and structuring mechanisms for F region density patches have been subjects of speculation and debate for many years. We have made a survey of mappings of total electron content (TEC) between the years 2009 and 2015 from the web-based Madrigal data server in order to determine when patches and/or a tongue of ionization (TOI) have been present in the Northern Hemisphere polar cap; we find that there is a UT and seasonal dependence that follows a specific pattern. This finding sheds considerable light upon the old question of the source of polar cap patches, since it virtually eliminates potential patch plasma sources that do not have a UT/seasonal dependence, for example, particle precipitation or flux transfer events. We also find that the frequency of occurrence of patches or TOIs has little to do with the level of geomagnetic activity.
One of the most important input fields for an ionospheric model is the horizontal neutral wind. The primary mechanism by which the neutral wind affects ionospheric densities is the inducement of an upward or downward ion drift along the magnetic field lines; this affects the rate at which ions are lost through recombination. The magnitude of this effect depends upon the dip angle of the magnetic field; for this reason, the impact of the neutral wind is somewhat less in polar regions than at mid‐latitudes. It is unfortunate that observations of the neutral wind are relatively scarce, as compared for example with observations of the Earth's electric field or auroral precipitation, and that the existing climatological models of the neutral wind are thus sharply limited in theirresolution. The observational data base of thermospheric winds is not sufficient to adequately constrain a three‐dimensional model across a variety of conditions such as solar cycle, season, geomagnetic activity, and so on. Using the physics‐based Time Dependent Ionospheric Model (TDIM) of Utah State University, we look for a quantitative answer to this question: How severe is the limitation imposed on ionospheric models by an uncertain specification of the neutral wind? We find that ionospheric modeling depends upon a detailed specification of the neutral wind to the extent that, if a climatologically averaged wind model is being used as a driver, this will lead to unavoidable uncertainties of 20‐30% in the modeled F‐region densities or Total Electron Content (TEC).
The neutral wind is a critical input parameter for physics-based ionospheric models, affecting both the height of the F layer and the total electron content. Unfortunately, the currently available models of the thermospheric wind do not seem to represent it very accurately, and this places a serious limitation on the effectiveness of ionospheric modeling and forecasting. We make use of several decades' worth of midlatitude ionosonde observations of the F region peak, in order to compare the effectiveness of several neutral wind models when used as drivers for an ionospheric model. We check the simulation results against the ground truth of the ionosonde observations using the technique of forecast skill scores. We find that with the ionospheric model in use here (the Utah State University Time Dependent Ionospheric Model (TDIM)), a very simple neutral wind pattern outperforms the more complex models. Increases in skill scores as high as 50% are obtained, relative to the reference case of zero wind; also, in some cases, there are similarly large decreases in skill scores. We view this as a sensitivity study, rather than an effort to identify the best wind model in an absolute sense, because any ionospheric model is an assemblage of algorithms, boundary conditions, and drivers that are themselves imperfect. We identify reasons for the large variability in skill scores with respect to season, longitude, and solar cycle level. We close with a brief discussion of other parameters in ionospheric modeling that are similarly uncertain, e. g., a downward electron flux and the Burnside factor.
This study evaluates how the new irradiance observations from the NASA Solar Dynamics Observatory (SDO) Extreme Ultraviolet Variability Experiment (EVE) can, with its high spectral resolution and 10s cadence, improve the modeling of the E region. To demonstrate this a campaign combining EVE observations with that of the NSF Arecibo incoherent scatter radar (ISR) was conducted. The ISR provides E region electron density observations with high-altitude resolution, 300m, and absolute densities using the plasma line technique. Two independent ionospheric models were used, the Utah State University Time-Dependent Ionospheric Model (TDIM) and Space Environment Corporation's Data-Driven D Region (DDDR) model. Each used the same EVE irradiance spectrum binned at 1nm resolution from 0.1 to 106nm. At the E region peak the modeled TDIM density is 20% lower and that of the DDDR is 6% higher than observed. These differences could correspond to a 36% lower (TDIM) and 12% higher (DDDR) production rate if the differences were entirely attributed to the solar irradiance source. The detailed profile shapes that included the E region altitude and that of the valley region were only qualitatively similar to observations. Differences on the order of a neutral-scale height were present. Neither model captured a distinct dawn to dusk tilt in the E region peak altitude. A model sensitivity study demonstrated how future improved spectral resolution of the 0.1 to 7nm irradiance could account for some of these model shortcomings although other relevant processes are also poorly modeled.
: The primary goals of the project are to conduct scientific studies to improve the science in the GAIM-Full Physics data assimilation model and to elucidate the processes underlying ionospheric weather features. The emphasis is on the effect that equatorial plasma bubbles have on data assimilation and on ways to improve the high-latitude ionosphere in the GAIM-FP model.
ABSTRACTOver the altitude range of 90–150 km, in dayside nonauroral regions, ionization is controlled almost entirely by solar ultraviolet irradiance; the response time for ionization during solar exposure is almost instantaneous, and likewise, the time scale for recombination into neutral species is very fast when the photoionizing source is removed. Therefore, if high‐resolution solar spectral data are available, along with accurate ionization cross sections as a function of wavelength, it should be possible to model this ionospheric region with greater accuracy. The Extreme Ultraviolet Variability Experiment (EVE) instrument on the National Aeronautics and Space Administration Solar Dynamics Observatory (SDO) satellite, launched in February 2010, is intended to provide just such solar data, at high resolution in both wavelength and time cadence. We use the Utah State University time‐dependent ionospheric model to assess the sensitivity in modeling that this solar irradiance data provide, under quiet solar conditions as well as during X‐class flares. The sensitivity studies show that the E and F1 regions, as well as the valley region, are strongly dependent upon wavelength in both electron density and ion composition.
With the storm of 7-8 September 2002 as a study case, we demonstrate that an ionospheric model driven by a suitable storm time convection electric field can reproduce the F region dayside density enhancements associated with the ionospheric storm positive phase. The ionospheric model in this case is the Utah State University Time Dependent Ionospheric Model (TDIM); the electric field model is the University of Michigan's Hot Electron and Ion Drift Integrator (HEIDI). Extensive ground truth is available throughout the study period from two independent sources: ground-based vertical TEC and ionosonde stations; our simulation results are in good agreement with these observations. We address the question of what is the source of the high-density plasma that is seen during the positive storm phase and show that in this case a magnetospheric electric field with an eastward component that penetrates to midlatitudes increases local production on the dayside to a degree that is sufficient to account for the storm time density increases that have been observed.
The electron energy balance in the ionosphere is affected by numerous local heating and cooling processes, as well as by transport processes. The thermal electrons gain energy from photoelectrons, auroral electrons, hot thermal ions, and a downward flow of heat from high altitudes. The thermal electrons lose energy in elastic collisions with ions and neutrals (N 2 , O 2 , O, He, H) and in inelastic collisions with neutrals, including rotational excitation of N 2 and O 2 , vibrational excitation of N 2 and O 2 , excitation of the fine structure levels of atomic oxygen, and electronic excitation of atomic oxygen, e.g., O( 1 S) and O( 1 D). The transport processes include thermal conduction and thermoelectric heat flow. Recently, new electron cooling rates have been calculated that are substantially different from those in current use, which are more than thirty years old. Therefore, model simulations were conducted that show the impact that these new cooling rates have on the electron temperatures and ion densities in the mid- and high-latitude ionosphere. It was found that, while several of the new cooling rates differ significantly from the old rates, collectively these differences largely cancel each other, with the result that the impact of the new rates on the ionospheric temperatures and densities is small. Also, a possible important source of heat for the thermal electrons in the polar cap is the downward flow of heat that results from the interaction of the escaping polar wind electrons with the relatively hot polar rain, squall, and drizzle. This electron heat source has typically been ignored in the past due to a lack of measurements, but recent work based on satellite measurements has made it possible to estimate values of the downward electron heat flow in the polar cap. Therefore, model simulations were also conducted to determine the effect of a downward electron heat flow on the high-latitude ionosphere. We found that in many cases the addition of a heat flow does have a large impact on the F-region temperatures and densities, sometimes increasing the total electron content (TEC) by 50% or more; topside densities may be increased by a factor of 5. The effects of the new cooling rates and downward heat flow were determined for a wide range of geophysical conditions.
With the National Geophysical Data Center's Space Physics Interactive Data Resource (SPIDR), we have collected ionosonde data from stations around the world from 1958 to 2006. The database consists of F‐layer peak frequency values (foF2) at hourly intervals (when data are available). We limit our study to midlatitude dayside density peak enhancements; we find that when such features appear, they are usually confined in longitude, being not wider than about 60–90 degrees, or 4–6 hours of local time. In this paper, we look only at enhancements over Europe, as data coverage is superior there. We define a “single‐day enhancement” and search the European sector of the database for such occurrences, finding 890 events during the 49‐year period. The frequency of occurrence of these events is seen to be anticorrelated with the solar activity cycle. There is also a seasonal distribution, with more events during the equinox months and the fewest during winter. We examine the geomagnetic activity levels on the days of the enhancements and find that a majority of the events are associated with small or moderate geomagnetic disturbances. Most of these disturbances are not large enough to be called “storms”; in many cases, there is a Dst drop of just 20–40 units or a Kp increase to a level of 3 or 4. These disturbances are not intense enough to cause a storm negative phase, but in many cases they are sufficient to bring about a dayside ionospheric density enhancement of 50% or more.
Enhancements of the total electron content (TEC) in the middle‐latitude dayside ionosphere have often been observed during geomagnetic storms. The enhancements can be as large as a factor of 2 or more, and many sightings of such structures have occurred over the United States. Here we investigate the effectiveness of an expanded convection electric field as a mechanism for producing such ionospheric enhancements. As a test case, we examine the storm period of 5–7 November 2001, for which observations from the DMSP F13 are used to drive the Time Dependent Ionospheric Model (TDIM). Our findings indicate that at favorable universal times, the presence of the expanded electric field is sufficient to create dayside TEC enhancements of a factor of 2 or more. The modeled enhancements consist of locally produced plasma; we do not find it necessary to transport high‐density plasma northward from low latitudes.
For many decades, the mid-latitude ionosphere was regarded as well characterized even if not well modeled. As a result, the Federal Aviation Authority's Wide Area Augmentation System (WAAS) was developed to provide augmented GPS positioning information to correct for ionospheric variability. However, over the past 5 years, recurrent superstorms in the ionosphere have forced the WAAS system to go offline for many hours at a time. This report discusses present-day knowledge regarding these conditions and how they are associated with unexpectedly steep horizontal gradients in the mid-latitude ionosphere total electron content (TEC). In a general sense, the possible physical mechanisms are understood, but during a storm the distribution and evolution of the driving forces for these mechanisms are neither understood nor adequately observed, the two main driving forces being the convection electric field and the neutral wind. In this paper a simplified convection electric field pattern is presented and used to drive a physics-based ionospheric model. This demonstrates how the superstorm ionospheric condition could be generated. Data assimilation is a new approach that could exceed present-day empirical and physical model limitations. There are three main expectations for data assimilation: (1) combined with a good ionospheric background model, the data assimilation must provide realistic global specification of the ionosphere; (2) it must also provide additional information about the ionosphere that is not already evident in the observation, that is, altitude profiles of the electron density when only slant TEC integrals of the electron density are available; and (3) with full physics-based models in the assimilation procedure, data assimilation models must also provide the drivers, that is, the neutral wind and electric field patterns. This paper examines the current status of these three expectations with regard to the future for the scientist and the space weather forecaster.
The existence of a month-long continuous database of incoherent scatter radar observations of the ionosphere from the EISCAT Savlbard Radar (ESR) at Longyearbyen, Norway, provides an unprecedented opportunity for model/data comparisons. Physics-based ionospheric models, such as the Utah State University Time Dependent Ionospheric Model (TDIM), are usually only compared with observations over restricted one or two day events or against climatological averages. In this study, using the ESR observations, the daily weather, day-to-day variability, and month-long climatology can be simultaneously addressed to identify modeling shortcomings and successes. Since for this study the TDIM is driven by climatological representations of the magnetospheric convection, auroral oval, neutral atmosphere, and neutral winds, whose inputs are solar and geomagnetic indices, it is not surprising that the daily weather cannot be reproduced. What is unexpected is that the horizontal neutral wind has come to the forefront as a decisive model input parameter in matching the diurnal morphology of density structuring seen in the observations.
 Jan J. Sojka合作论文数Space Environment Corporation27
 Robert Schunk合作论文数Center for Atmospheric & Space Sciences, College of Science, Utah State University;Department of Physics, College of Science, Utah State University25
 Anthea Jane Coster合作论文数Massachusetts Institute of Technology, Haystack Observatory4
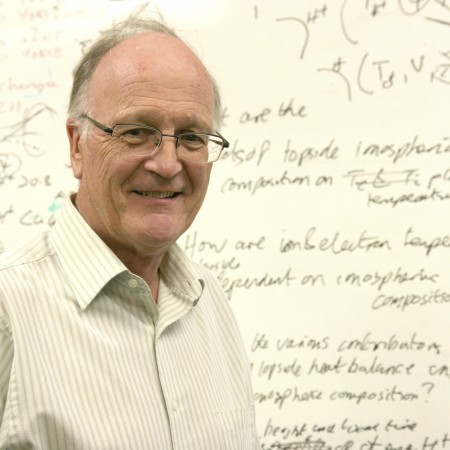 Roderick Heelis合作论文数Center for Space Sciences|University of Texas at Dallas3
 Vince Eccles合作论文数Space Environment Corporation3
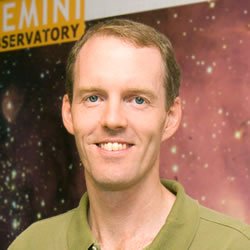 Joseph B. Jensen合作论文数Gemini3Tom Woods合作论文数2Thomas N. Woods合作论文数Laboratory for Atmospheric and Space Physics|University of Colorado , Boulder2
 Michael W. Liemohn合作论文数Department of Climate and Space Sciences and Engineering, College of Engineering, University of Michigan, Ann Arbor2A. P. van Eyken合作论文数1H. Gordon James合作论文数1Na Gondarenko合作论文数1D. C. Thompson合作论文数1joseph b jensen合作论文数University of New Hampshire1
 John C Foster合作论文数Haystack Observatory, Massachusetts Institute of Technology1J. Chen合作论文数1John L. Innis合作论文数1Robert F Benson合作论文数1J. A. Fedder合作论文数1D.J Della-Rose合作论文数1P.L. Dyson合作论文数School of Physics, La Trobe University1
 Lie Zhu (朱磊)合作论文数Department of Electronic and Computer Engineering, School of Engineering, The Hong Kong University of Science and Technology;The Hong Kong University of Science and Technology (Guangzhou)1Larry Gardner合作论文数1Steven Slinker合作论文数1
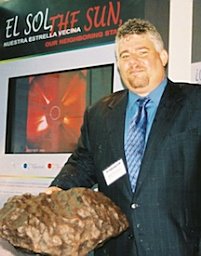 Sixto A. Gonzalez合作论文数Space and Atmospheric Sciences, NAIC/Arecibo Observatory1P. A. Greet合作论文数1
 Frank Eparvier合作论文数Laboratory for Atmospheric and Space Physics, University of Colorado1
 Ludger Scherliess合作论文数Department of Physics, College of Arts & Sciences, Utah State University1Parvez N Guzdar合作论文数1
 W Kent Tobiska合作论文数1
 Michael P. Sulzer合作论文数1




