Electroencephalography (EEG) data entail a complex spatiotemporal structure that reflects ongoing organization of brain activity. Characterization of the spatial patterns is an indispensable step in numerous EEG processing pipelines. We present a novel method for transforming EEG data into a spectral representation. First, we learn subject-specific graphs from each subject’s EEG data. Second, by eigendecomposition of the normalized Laplacian matrix of each subject’s graph, an orthonormal basis is obtained using which any given EEG map of the subject can be decomposed, providing a spectral representation of the data. We show that energy of EEG maps is strongly associated with low frequency components of the learned basis, reflecting the smooth topography of EEG maps. As a proof-of-concept for this alternative view of EEG data, we consider the task of decoding two-class motor imagery (MI) data. To this aim, the spectral representations are first mapped into a discriminative subspace for differentiating two-class data using a projection matrix obtained by the Fukunaga–Koontz transform (FKT). An SVM classifier is then trained and tested on the resulting features to differentiate MI classes. The method is benchmarked against features extracted from a subject-specific functional connectivity matrix as well as four alternative MI-decoding methods on Dataset IVa of BCI Competition III. Experimental results show the superiority of the proposed method over alternative approaches in differentiating MI classes, reflecting the added benefit of (i) decomposing EEG data using data-driven, subject-specific harmonic bases, and (ii) accounting for class-specific temporal variations in spectral profiles.
A growing body of research in the past decade has revealed that functional interaction between brain regions entail subject-specific idiosyncrasies that are highly replicable. As such, functional connectivity patterns can be seen as an individual's brain fingerprint, enabling their identification within a population, in health and disease. The conventional method involves constructing the functional connectome by treating brain regions as vertices and utilizing pairwise measures of statistical dependence, such as Pearson's correlation coefficient, between the regional time-courses as edge weights. However, by focusing on EEG data in our study, we propose an alternative approach to learn a sparse graph structure from an individual's EEG data using principles from graph signal processing. The inferred subject-specific graphs encode subtle instantaneous spatial relations between the ensemble set of EEG electrodes in such way that EEG maps are seen as smooth functions residing on the graph. We validated the inferred graphs on two publicly available EEG datasets, demonstrating that the learned graphs outperform correlation-based functional connectomes in fingerprinting performance. This talk provides an overview of our proposed method and related results, which was presented at the 2023 European Signal Processing Conference in Helsinki, Finland. The work was selected as the second-best student paper; aside from the talk, a poster was presented as part of the contest, segments of which can be found as figures in the present article.
Sparse representation of signals has achieved satisfactory results in classification applications compared to the conventional methods. Microarray data, which are obtained from monitoring the expression levels of thousands of genes simultaneously, have very high dimensions in relation to the small number of samples. This has led to the weaknesses of state-of-the-art classifiers to cope with the microarray data classification problem. The ability of the sparse representation to represent the signals as a linear combination of a small number of training data and to provide a brief description of signals led to reducing computational complexity as well as increasing classification accuracy in many applications. Using all training samples in the dictionary imposes a high computational burden on the sparse coding stage of high dimensional data. Proposed solutions to solve this problem can be roughly divided into two categories: selection of a subset of training data using different criteria, or learning a concise dictionary. Another important factor in increasing the speed and accuracy of a sparse representation-based classifier is the algorithm which is used to solve the related ℓ1 –norm minimization problem. In this paper, different sparse representation-based classification methods are investigated in order to tackle the problem of 14-Tumors microarray data classification. Our experimental results show that good performances are obtained by selecting a subset of the original atoms and learning the associated dictionary. Also, using SL0 sparse coding algorithm increases speed, and in most cases, accuracy of the classifiers. ### Competing Interest Statement The authors have declared no competing interest.
Taking advantage of the human brain functional connectome as an individual's fingerprint has attracted great research in recent years. Conventionally, Pearson correlation between regional time-courses is used as a pairwise measure for each edge weight of the connectome. Building upon recent advances in graph signal processing, we propose here to estimate the graph structure as a whole by considering all time-courses at once. Using data from two publicly available datasets, we show the superior performance of such learned brain graphs over correlation-based functional connectomes in characterizing an individual.
Dealing with irregular domains, graph signal processing (GSP) has attracted much attention especially in brain imaging analysis. Motor imagery tasks are extensively utilized in brain-computer interface (BCI) systems that perform classification using features extracted from Electroencephalogram signals. In this paper, a GSP-based approach is presented for two-class motor imagery tasks classification. The proposed method exploits simultaneous diagonalization of two matrices that quantify the covariance structure of graph spectral representation of data from each class, providing a discriminative subspace where distinctive features are extracted from the data. The performance of the proposed method was evaluated on Dataset IVa from BCI Competition III. Experimental results show that the proposed method outperforms two state-of-the-art alternative methods.
Nowadays, it is obvious that there is a relationship between changes in the retinal vessel structure and diseases such as diabetic, hypertension, stroke, and the other cardiovascular diseases in adults as well as retinopathy of prematurity in infants. Retinal fundus images provide non-invasive visualization of the retinal vessel structure. Applying image processing techniques in the study of digital color fundus photographs and analyzing their vasculature is a reliable approach for early diagnosis of the aforementioned diseases. Reduction in the arteriolar-venular ratio of retina is one of the primary signs of hypertension, diabetic, and cardiovascular diseases which can be calculated by analyzing the fundus images. To achieve a precise measuring of this parameter and meaningful diagnostic results, accurate classification of arteries and veins is necessary. Classification of vessels in fundus images faces with some challenges that make it difficult. In this paper, a comprehensive study of the proposed methods for classification of arteries and veins in fundus images is presented. Considering that these methods are evaluated on different datasets and use different evaluation criteria, it is not possible to conduct a fair comparison of their performance. Therefore, we evaluate the classification methods from modeling perspective. This analysis reveals that most of the proposed approaches have focused on statistics, and geometric models in spatial domain and transform domain models have received less attention. This could suggest the possibility of using transform models, especially data adaptive ones, for modeling of the fundus images in future classification approaches.
In recent years, classification using sparse representation of signals has attracted much attention and has achieved satisfactory results compared to the conventional methods. In this paper, a classification method using sparse representation is proposed for face verification in Labeled Faces in the Wild (LFW) data. The LFW dataset involves high intra-class variations due to the uncontrolled imaging conditions. According to our experimental results, matched and mismatched pairs of the LFW data can be better classified using separate dictionaries for each image of the input pair.
Sparse representation provides a good discrimination power for different categories of data. This characteristic of sparse representation has led to incredible classification results in many applications. Inspired by the superior performance of the Sparse Representation based Classifier (SRC) and its extensions, we address the problem of tumor classification using some approximations of the SRC algorithm. Microarray data which contain gene expression information of tumors are very high dimensional data. On the other hand, a limited number of microarray samples is usually available. So, conventional classification approaches are in trouble to cope with this problem. Also, one of the main drawbacks of the sparse representation-based methods is the computational complexity of the l1 minimization step. By increasing the size of the data, this problem will be more serious. Accordingly, in this study, we use some of the accelerated proposed sparse coding algorithms. Our experimental results show the remarkable ability of the sparse representation based methods by using the SL0 algorithm as compared to the state of the art tumor classification approaches.
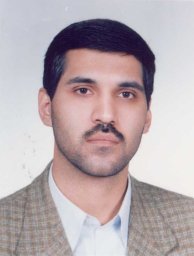 Vahid Abootalebi合作论文数Engineering Faculty, Yazd University6
 Hamid Behjat合作论文数Dept. of Biomed. Eng., Lund Univ.;c;Dept. of Biomed. Eng., Lund Univ.4
 Hamid Saeedi Sourck合作论文数3
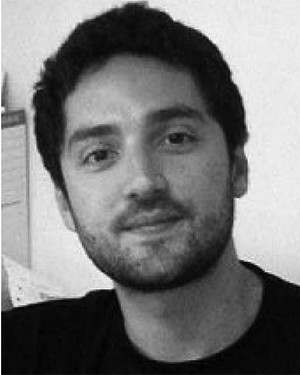 Enrico Amico合作论文数2
 Dimitri Van De Ville合作论文数Neuro-X Institute, School of Engineering, École Polytechnique Fédérale de Lausanne;Department of Radiology and Medical Informatics, Faculty of Medicine, University of Geneva2
 Mohammad Sadeghi合作论文数Yazd University, Iran2
 Zahra Amini合作论文数1
 Hossein Rabbani合作论文数Department of Biomedical Engineering, Isfahan University of Medical Sciences1
 Rahele Kafieh合作论文数Department of Biomedical Engineering, Medical University of Isfahan1




