We propose a conceptual framework for exploratory data analysis of (large) unstructured data (EluDA), combining classical elements (querying, visualization) with active knowledge construction in the "search for structure". In a formative study, users conceptualized a structure for an image dataset during exploration. We found that users conceptualize by building faceted classifications bottom-up and rarely create meaningful spatial categorization during this process. We also evaluated CLIP for zero-shot assignment and semantic categorization, finding that it remains unreliable for assigning user-defined concepts to images but does support semantic grouping. Based on these findings, we identify and discuss four key opportunities for human-AI collaboration in EluDA: intelligent sampling and visualization to maximize data visibility; incremental and few-shot learning to minimize effort for reliable assignment; automatic category, concept, and facet suggestions to reduce effort during the search for structure; and the necessity for effective trust calibration methods.
We present TreeON, a novel neural-based framework for reconstructing detailed 3D tree point clouds from sparse top-down geodata, using only a single orthophoto and its corresponding Digital Surface Model (DSM). Our method introduces a new training supervision strategy that combines both geometric supervision and a differentiable shadow and silhouette loss to learn point cloud representations of trees without requiring species labels, procedural rules, detailed terrestrial reconstruction data, or ground laser scan data. To address the lack of ground truth data, we generate a synthetic dataset of point clouds from procedurally modeled trees and train our network on it. Quantitative and qualitative experiments demonstrate better reconstruction quality and coverage compared to existing methods, as well as strong generalization to real-world data, leading to visually appealing and structurally plausible tree point cloud representations that can be integrated into interactive digital 3D maps. The codebase, synthetic dataset, and pretrained model are publicly available at https://angelikigram.github.io/treeON/.
We present interactive data-driven compute overlays for native and web-based 3D geographic map applications based on WebGPU. Our data-driven overlays are generated in a multi-step compute workflow from multiple data sources on the GPU. We demonstrate their potential by showing results from snow cover and avalanche simulations, where simulation parameters can be adjusted interactively and results are visualized instantly. Benchmarks show that our approach can compute large-scale avalanche simulations in milliseconds to seconds, depending on the size of the terrain and the simulation parameters, which is multiple orders of magnitude faster than a state-of-the-art Python implementation.
Digital 3D maps created from digital elevation models (DEMs) cannot properly capture trees due to the 2.5D nature of the DEMs. Leveraging publicly available DEMs and orthophotos as the only input data sources, we present a fully automatic pipeline that models landmark trees. We conducted two crowdsourced user studies to evaluate visual appeal and scene recognizability using two different levels of detail of tree representations generated using our pipeline. Users found highly detailed trees much more appealing, and also easier and more trustworthy to recognize, with open-ended responses revealing key factors like realism, coherence, and tree shape influencing their preferences. However, the ability to recognize a location seems to depend more on the surrounding environment than the representation of the landmark tree in focus. We discuss the implications of these results for digital 3D outdoor maps.
Large unlabeled datasets demand efficient and scalable data labeling solutions, in particular when the number of instances and classes is large. This leads to significant visual scalability challenges and imposes a high cognitive load on the users. Traditional instance-centric labeling methods, where (single) instances are labeled in each iteration struggle to scale effectively in these scenarios. To address these challenges, we introduce cVIL, a Class-Centric Visual Interactive Labeling methodology designed for interactive visual data labeling. By shifting the paradigm from assigning-classes-to-instances to assigning-instances-to-classes, cVIL reduces labeling effort and enhances efficiency for annotators working with large, complex and class-rich datasets. We propose a novel visual analytics labeling interface built on top of the conceptual cVIL workflow, enabling improved scalability over traditional visual labeling. In a user study, we demonstrate that cVIL can improve labeling efficiency and user satisfaction over instance-centric interfaces. The effectiveness of cVIL is further demonstrated through a usage scenario, showcasing its potential to alleviate cognitive load and support experts in managing extensive labeling tasks efficiently.
Bias in generative Text-to-Image (T2I) models is a known issue, yet systematically analyzing such models' outputs to uncover it remains challenging. We introduce the Visual Bias Explorer (ViBEx) to interactively explore the output space of T2I models to support the discovery of visual bias. ViBEx introduces a novel flexible prompting tree interface in combination with zero-shot bias probing using CLIP for quick and approximate bias exploration. It additionally supports in-depth confirmatory bias analysis through visual inspection of forward, intersectional, and inverse bias queries. ViBEx is model-agnostic and publicly available. In four case study interviews, experts in AI and ethics were able to discover visual biases that have so far not been described in literature.
Large-scale vision-language models (VLMs) such as CLIP have gained popularity for their generalizable and expressive multimodal representations. By leveraging large-scale training data with diverse textual metadata, VLMs acquire open-vocabulary capabilities, solving tasks beyond their training scope. This paper investigates the temporal awareness of VLMs, assessing their ability to position visual content in time. We introduce TIME10k, a benchmark dataset of over 10,000 images with temporal ground truth, and evaluate the time-awareness of 37 VLMs by a novel methodology. Our investigation reveals that temporal information is structured along a low-dimensional, non-linear manifold in the VLM embedding space. Based on this insight, we propose methods to derive an explicit ``timeline'' representation from the embedding space. These representations model time and its chronological progression and thereby facilitate temporal reasoning tasks. Our timeline approaches achieve competitive to superior accuracy compared to a prompt-based baseline while being computationally efficient. All code and data are available at https://tekayanidham.github.io/timeline-page/.
Understanding and analyzing univariate distributions of data in terms of their shapes as well as their specific characteristics, regarding gaps, spikes, or outliers, is crucial in many scientific disciplines. In this paper, we propose a design space composed of the visual channels position and color for representing accumulated distributions. The designs are a mixture of color-coded stripes with density lines. The width and coloring of the stripes is based on the applied binning technique. In a crowd-sourced experiment we explore a subspace, called the AccuStripes (i.e., “accumulated stripes”) design space, consisting of nine representations. These AccuStripes designs integrate three composition strategies (color only, overlay, filled curve) with three binning techniques, one uniform (UB) and two adaptive methods, namely Bayesian Blocks (BB) and Jenks’ Natural Breaks (NB). We evaluate the accuracy, efficiency, and confidence ratings of the nine AccuStripes designs for structural estimation and comparison tasks. Across all study tasks, the overlay composition was found to be most accurate and preferred by observers. Furthermore, the results demonstrate that while no binning method performed best in both identification and comparison, detection of structures using adaptive binning was the most accurate one. For validation we compared the best AccuStripes’ design, i.e., the overlay composition, to line charts. Our results show that the AccuStripes’ design outperformed the line charts in accuracy for all study tasks.
We introduce a workflow for the visual assessment of interobserver variability in medical image segmentation. Image segmentation is a crucial step in the diagnosis, prognosis, and treatment of many diseases. Despite the advancements in autosegmentation, clinical practice widely relies on manual delineations performed by radiologists. Our work focuses on designing a solution for understanding the radiologists’ thought processes during segmentation and for unveiling reasons that lead to interobserver variability. To this end, we propose a visual analysis tool connecting multiple radiologists’ delineation processes with their outcomes, and we demonstrate its potential in a case study.
Selecting targets in dense, dynamic 3D environments presents a significant challenge. In this study, we introduce two novel selection techniques based on distractor pruning to assist users in selecting targets moving unpredictably: BaggingHook and AutoBaggingHook. Both are built upon the Hook intention-prediction heuristic, which continuously measures the distance between the user’s cursor and each object to compute per-object scores and estimate the intended target. Our techniques reduce the number of targets in the environment, making heuristic convergence potentially faster. Once pruned away, distractors are also made semi-transparent to reduce occlusion and the overall difficulty of the task. However, their motion is not altered, so that users can still perceive the dynamics of the environment. We designed two pruning approaches: BaggingHook lets users manually prune distractors away, while AutoBaggingHook uses automated, score-based pruning. We conducted a user study in a virtual reality setting inspired by molecular dynamics simulations, featuring crowded scenes of objects moving fast and unpredictably, in 3D. We compared both proposed techniques to the Hook baseline under more challenging circumstances than it had previously been tested. Our results show that AutoBaggingHook was the fastest, and did not lead to higher error rates. BaggingHook, on the other hand, was preferred by the majority of participants, due to the greater degree of control it provides to users, leading some to see entertainment value in its use. This work shows the potential benefits of varying the types of inputs used in intention-prediction heuristics, not just to improve performance, but also to reduce occlusion, overall task load, and improve user experience.
We present cVIL, a class-centric approach to visual interactive labeling, which facilitates human annotation of large and complex image data sets. cVIL uses different property measures to support instance labeling for labeling difficult instances and batch labeling to quickly label easy instances. Simulated experiments reveal that cVIL with batch labeling can outperform traditional labeling approaches based on active learning. In a user study, cVIL led to better accuracy and higher user preference compared to a traditional instance-based visual interactive labeling approach based on 2D scatterplots.
We conducted a study to systematically investigate the communication of complex dynamic processes along a two-dimensional design space, where the axes represent a representation's manifestation (physical or virtual) and operation (manual or automatic). We exemplify the design space on a model embodying cardiovascular pathologies, represented by a mechanism where a liquid is pumped into a draining vessel, with complications illustrated through modifications to the model. The results of a mixed-methods lab study with 28 participants show that both physical manifestation and manual operation have a strong positive impact on the audience's engagement. The study does not show a measurable knowledge increase with respect to cardiovascular pathologies using manually operated physical representations. However, subjectively, participants report a better understanding of the process-mainly through non-visual cues like haptics, but also auditory cues. The study also indicates an increased task load when interacting with the process, which, however, seems to play a minor role for the participants. Overall, the study shows a clear potential of physicalization for the communication of complex dynamic processes, which only fully unfold if observers have to chance to interact with the process.
Immersive virtual reality environments are gaining popularity for studying and exploring crowded three-dimensional structures. When reaching very high structural densities, the natural depiction of the scene produces impenetrable clutter and requires visibility and occlusion management strategies for exploration and orientation. Strategies developed to address the crowdedness in desktop applications, however, inhibit the feeling of immersion. They result in nonimmersive, desktop-style outside-in viewing in virtual reality. This article proposes Nanotilus-a new visibility and guidance approach for very dense environments that generates an endoscopic inside-out experience instead of outside-in viewing, preserving the immersive aspect of virtual reality. The approach consists of two novel, tightly coupled mechanisms that control scene sparsification simultaneously with camera path planning. The sparsification strategy is localized around the camera and is realized as a multi-scale, multi-shell, variety-preserving technique. When Nanotilus dives into the structures to capture internal details residing on multiple scales, it guides the camera using depth-based path planning. In addition to sparsification and path planning, we complete the tour generation with an animation controller, textual annotation, and text-to-visualization conversion. We demonstrate the generated guided tours on mesoscopic biological models - SARS-CoV-2 and HIV. We evaluate the Nanotilus experience with a baseline outside-in sparsification and navigational technique in a formal user study with 29 participants. While users can maintain a better overview using the outside-in sparsification, the study confirms our hypothesis that Nanotilus leads to stronger engagement and immersion.
3D animations are an effective method to learn about complex dynamic phenomena, such as mesoscale biological processes. The animators' goals are to convey a sense of the scene's overall complexity while, at the same time, visually guiding the user through a story of subsequent events embedded in the chaotic environment. Animators use a variety of visual emphasis techniques to guide the observers' attention through the story, such as highlighting, halos – or by manipulating motion parameters of the scene. In this paper, we investigate the effect of smoothing the motion of contextual scene elements to attract attention to focus elements of the story exhibiting high‐frequency motion. We conducted a crowdsourced study with 108 participants observing short animations with two illustrative motion smoothing strategies: geometric smoothing through noise reduction of contextual motion trajectories and visual smoothing through motion blur of context items. We investigated the observers' ability to follow the story as well as the effect of the techniques on speed perception in a molecular scene. Our results show that moderate motion blur significantly improves users' ability to follow the story. Geometric motion smoothing is less effective but increases the visual appeal of the animation. However, both techniques also slow down the perceived speed of the animation. We discuss the implications of these results and derive design guidelines for animators of complex dynamic visualizations.
Similarity maps show dimensionality-reduced activation vectors of a high number of data points and thereby can help to understand which features a neural network has learned from the data. However, similarity maps have severely limited expressiveness for large datasets with hundreds of thousands of data instances and thousands of labels, such as ImageNet or word2vec. In this work, we present “concept splatters” as a scalable method to interactively explore similarities between data instances as learned by the machine through the lens of human-understandable semantics. Our approach enables interactive exploration of large latent spaces on multiple levels of abstraction. We present a web-based implementation that supports interactive exploration of tens of thousands of word vectors of word2vec and CNN feature vectors of ImageNet. In a qualitative study, users could effectively discover spurious learning strategies of the network, ambiguous labels, and could characterize reasons for potential confusion.
We present sMolBoxes, a dataflow representation for the exploration and analysis of long molecular dynamics (MD) simulations. When MD simulations reach millions of snapshots, a frame-by-frame observation is not feasible anymore. Thus, biochemists rely to a large extent only on quantitative analysis of geometric and physico-chemical properties. However, the usage of abstract methods to study inherently spatial data hinders the exploration and poses a considerable workload. sMolBoxes link quantitative analysis of a user-defined set of properties with interactive 3D visualizations. They enable visual explanations of molecular behaviors, which lead to an efficient discovery of biochemically significant parts of the MD simulation. sMolBoxes follow a node-based model for flexible definition, combination, and immediate evaluation of properties to be investigated. Progressive analytics enable fluid switching between multiple properties, which facilitates hypothesis generation. Each sMolBox provides quick insight to an observed property or function, available in more detail in the bigBox View. The case studies illustrate that even with relatively few sMolBoxes, it is possible to express complex analytical tasks, and their use in exploratory analysis is perceived as more efficient than traditional scripting-based methods.
To exploit the potential of immersive network analytics for engaging and effective exploration, we promote the metaphor of "egocentrism", where data depiction and interaction are adapted to the perspective of the user within a 3D network. Egocentrism has the potential to overcome some of the inherent downsides of virtual environments, e.g., visual clutter and cyber-sickness. To investigate the effect of this metaphor on immersive network exploration, we designed and evaluated interfaces of varying degrees of egocentrism. In a user study, we evaluated the effect of these interfaces on visual search tasks, efficiency of network traversal, spatial orientation, as well as cyber-sickness. Results show that a simple egocentric interface considerably improves visual search efficiency and navigation performance, yet does not decrease spatial orientation or increase cyber-sickness. An occlusion-free Ego-Bubble view of the neighborhood only marginally improves the user's performance. We tie our findings together in an open online tool for egocentric network exploration, providing actionable insights on the benefits of the egocentric network exploration metaphor.
• texture influence (Section A.1 and Section A.2), • shape sensitivity (Section A.3), • low frequency information (Section A.4), • high frequency information (Section A.5), • adversarial attacks (Section A.6), • fading to black (Section A.7), • geometric transformations (Section A.8), • as well as geometric transformations in combination with background modifications (Section A.9). • development of activations & feature visualizations during fine-tuning (Section A.10).
 Dieter Schmalstieg合作论文数Visualization Research Center, University of Stuttgart;Institute for Visualization and Interactive Systems, University of Stuttgart18
 Ivan Viola合作论文数Department of Informatics, University of Bergen;Computer, Electrical and Mathematical Science and Engineering Division, King Abdullah University of Science and Technology;Nanographics12
 Eduard Gröller合作论文数Institute of Visual Computing & Human-Centered Technology, Faculty of Informatics, Vienna University of Technology;VRVis9
 Marc Streit合作论文数Visual Data Science Lab, Institute of Computer Graphics, Johannes Kepler University Linz;Datavisyn6
 Christian Pirchheim合作论文数Institute of Computer Graphics and Knowledge Visualisation, Graz University of Technology5
 Matthias Zeppelzauer合作论文数Vienna University of Technology5
 BACHELOR’S THESIS合作论文数4
 Nicolas Grossmann合作论文数Ochanomizu University, Tokyo Japan#TAB#4
 Alexander Lex合作论文数Visualization Design Lab, Scientific Computing and Imaging Institute, Kahlert School of Computing, University of Utah;Datavisyn4Mathieu Le Muzic合作论文数4
 Hsiang-Yun Wu合作论文数TU Wien4
 Markus Steinberger合作论文数Graz University of Technology4Nicholas Waldin合作论文数3
 David Kouril合作论文数TU Wien3
 Renata Raidou合作论文数Research Unit of Computer Graphics, Institute of Visual Computing & Human-Centered Technology, Faculty of Informatics, Technische Universität Wien3
 Kresimir Matkovic合作论文数VRVis Research Center3
 Johannes Sorger合作论文数TU Wien Vienna Austria3
 Michael Sedlmair合作论文数Institute for Visualization and Interactive Systems, University of Stuttgart3
 Barbora Kozlikova合作论文数Masaryk University3Wolfgang Knecht合作论文数Section of Molecular Microbiology, BioCentrum-DTU3
 Mathias Lechner合作论文数Liquid AI;Computer Science and Artificial Intelligence Laboratory, Massachusetts Institute of Technology2
 Aleksandr Amirkhanov合作论文数2Sebastian Schrey合作论文数2
 Laura R Luidolt合作论文数TU Wien2
 Thomas Geymayer合作论文数Graz University of Technology, Graz, Austria2
 Sérgio M Marques合作论文数Inst Super Tecn, Ctr Quim Estrutural, P-1049001 Lisbon, Portugal2
 Judy Borowski合作论文数University of Tuebingen2
 Oscar Argudo合作论文数Corresponding author2
 Tobias Klein合作论文数TU Wien Austria2
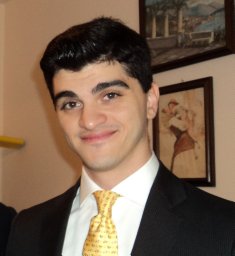 Alessio Arleo合作论文数TU Wien2
 Ramin Hasani合作论文数Computer Science and Artificial Intelligence Lab, Massachusetts Institute of Technology;Liquid AI2
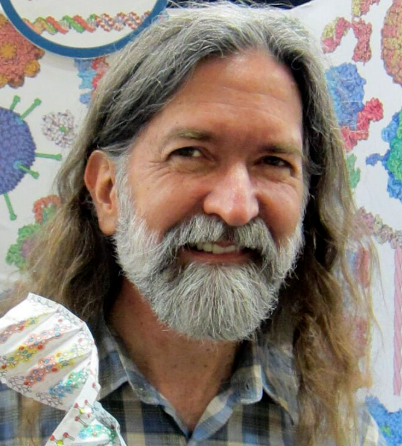 David S. Goodsell合作论文数Department of Integrative Structural and Computational Biology, Scripps Research Institute;Center for Integrative Proteomics Research, Rutgers University2
 Raphael David Andre Grasset合作论文数PTC2
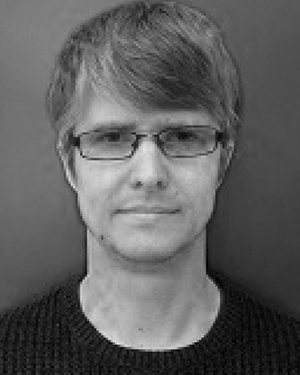 Jan Byska合作论文数University of Bergen2
 Matthias Bernhard合作论文数2
 Ernst Kruijff合作论文数School of Interactive Arts & Technology, Simon Fraser University;Institute of Visual Computing, Department of Computer Science, Bonn-Rhein-Sieg University of Applied Sciences;SIAT2Ludovic Autin合作论文数Laboratoire de Minéralogie-Cristallographie de Paris, Universités Paris 6 and 72
 Peter Mindek合作论文数Slovak University of Technology2Nidham Tekaya合作论文数1Juergen Bernardi合作论文数1
 Pedro Hermosilla合作论文数Computer Vision Lab, TU Wien1Alexey Karimov合作论文数1Henry Ehlers合作论文数1Jürgen Zauner合作论文数1Alexandre Kouyoumdjian合作论文数1Takayuki Itoh合作论文数1Johannes Eschner合作论文数1Dea Cizmic合作论文数1Daniel Pahr合作论文数1




