This article presents a novel hybrid control chart for monitoring of manufacturing processes with skewed quality characteristics and potential contamination in Phase II. The chart integrates the classical mean control chart with asymmetry correction in Phase I and robust M-estimators of location with logistic curves in Phase II. To assess the performance of classical mean estimators and robust M-estimators in detecting process variability, simulation studies were conducted. The results demonstrate that M-estimators are more effective in distinguishing significant signals and reducing false alarms, while also detecting larger, critical deviations. Nevertheless, further research is needed to compare the proposed chart with other methods and explore its practical application in industrial settings, where quality data often deviate from normal distributions.
PurposeThe main purpose of this paper is twofold: to present a proposal for a model of educational quality management system within a process approach context for technical universities, and a conceptual model of a performance measurement system (PMS) towards the assessment of the quality level of management, core and support processes.Design/methodology/approachThe paper encompasses two main parts: a theoretical portion and a case study. Within the theoretical background, the authors discuss the issue of educational quality management supported on a process approach perspective as well as performance measurement system in high education (HE). The case study reports the development of the concept of performance measurement system for technical universities.FindingsThe proposed system of educational quality management supported on a process approach, together with a conceptual model of the performance measurement system, can be implemented in every technical university. The identification of processes in the education quality management system permitted the development of the PMS. The model covers 32 key performance indicators (KPIs) for management processes, 39 for core processes and 19 for supporting ones.Research limitations/implicationsThe proposed performance measurement system is limited in its focus on educational processes and support of these processes. The evaluation of scientific and research activity and aspects related to financial resources is not pursued.Originality/valueElaboration of a conceptual model of a performance measurement system towards the assessment of the quality level of management, core and support processes is dedicated to technical universities.
The unexpected outbreak of the COVID-19 pandemic has harmed the shipping industry, especially the cruise sector. During this period, the cruise crew, as a neglected subject, experienced great work, life and psychological pressures. However, many states, including China, do not pay enough attention to the legal protection of their rights. The legal literature on this issue is insufficient, and this paper attempts to fill the gap. This paper aims to give a legal suggestion for how to protect the legal rights of cruise crews in ways that are both responsible and effective in the post-COVID-19 pandemic era. To achieve the goal, this paper adopts legal research methods to analyze the application of international conventions and Chinese laws and regulations. The paper discusses the legal limitations on the rights’ protection of cruise crews in the context of the COVID-19 pandemic, and the research results are legal considerations and suggestions for the protection of the cruise crew. In addition to taking reasonable measures to reduce the impact of the epidemic on cruise crews, the legitimate rights and interests of all cruise crew individuals should be realized as much as possible under existing international conventions and domestic laws. It is important for states to further improve crew and labour legislation and strengthen international cooperation to deal with the impact of the global pandemics on the cruise.
Because rice is one of China’s staple foods, studying the total factor productivity (TFP) of rice is of great importance for China’s food security. There are many similarities between rice production in China and Japan. Japan has achieved an effective supply of high-quality rice under the constraints of insufficient production resources and limited environmental capacity. In this paper, we use the DEA Malmquist index method to comparatively analyze the production efficiency of the rice industry in China and Japan, as well as its trends and changes. The contribution of each decomposition index is analyzed by using grey correlation, and kernel density estimation is used to analyze the dynamic evolution of rice productivity in both countries. The empirical results show that rice TFP in Japan is higher than that in China. Technological progress is an important driver of TFP and is the main reason for the difference in rice TFP between the two countries. The concentration of rice TFP distribution in China is decreasing, and regional differences are increasing, whereas in Japan, the opposite trend is observed, with the proportion of areas of high TFP increasing in both countries.
The paper presents the results of the application of the hierarchical clustering methods for the classification of the acoustic emission (AE) signals generated by eight basic forms of partial discharges (PD), which can occur in paper-oil insulation of power transformers. Based on the registered AE signals from the particular PD forms, using a frequency descriptor in the form of the power spectral density (PSD) of the signal, their representation in the form of the set of points on plane XY was created. Next, these sets were subjected to analysis using research algorithms consisting of selected clustering methods. Based on the suggested numeric performance indicators, the analysis of the degree of reproduction of the actual distribution of points showing the particular time waveforms of the AE signals from eight adopted PD forms (PD classes) in the obtained clusters was carried out. As a result of the analyses carried out, the clustering algorithms of the highest effectiveness in the identification of all eight PD classes, classified simultaneously, where indicated. Within the research carried out, an attempt to draw general conclusions as to the selection of the most effective hierarchical clustering method studied and the similarity function to be used for classification of the selected basic PD forms.
In practical terms, the measurement data from production processes are usually contaminated which may translate into failure to meet the assumed normality. In consequence, using classical Shewhart control charts to monitor the stability of production processes leads to the occurrence of numerous false signals. The purpose of this article is to propose hybrid control charts and to investigate their performance in monitoring the parameters of location and variability of production processes for which there occurs contamination of measurement data appearing at the stage of monitoring production cycles. To construct the control charts proposed by the authors, we should use extended control limits of classical Shewhart charts for means and ranges (Phase I) and robust estimators as test statistics to control the production cycle (Phase II). The article demonstrates the conducted simulation testing of classical and robust estimators for location and dispersion in terms of their effectiveness, as well as determining the relationship between them. These analyses have contributed to the design of hybrid control charts. Comparative simulation tests of classic and hybrid control charts performance have confirmed the effectiveness of the suggested measures. It follows that the proposed control charts can replace the classic counterparts, because they do not respond to an acceptable level of measurement data contamination, thanks to which it is possible to avoid taking unnecessary corrective actions in the production process. The theoretical portion is closed by a case study based on actual data which aims to illustrate the proposed approach.
Purpose:The aim of the article is to present a proposal for a model of educational quality management system using a process approach for technical universities too.Design/Methodology/Approach: The theoretical part of the article discusses the issue of an education quality management system for technical universities in terms of processes.Further, the activities carried out by universities in the field of the teaching process were identified.A top-down method was used to define the general areas of the universities' didactic activities.In the next stage, the processes carried out at a technical university were divided into managerial, core and suppository ones.Findings: On the basis of a case study, it is possible to apply a process approach to the management of educational activities.Practical Implications: The proposed system of education quality management using a process approach together can be implemented in every technical university.Originality/value: The research conducted at a selected technical university allowed for the development of an original model of an education quality management system based on a process approach.This is a new model proposed for an institution operating in the field of higher education.In practice, such institutions are managed based on classical, vertical, and organizational structures.
Control charts are tools used to detect an incorrect course of production processes. There are many applications of control charts going even beyond the area of manufacturing processes, e.g. in health care, finance, human resources and many others. Control charts can be applied to essentially any measurable process output including such as defects, production cycle time, customer complaints, inventory on hand, cost per unit, average sale price or other important performance indicators, or metrics. In classic terms, estimating process parameters (location and variability) is based on the estimation of these parameters using historical data assuming that it runs correctly and that the data is free of contamination. In a situation when outliers and/or other contaminations appear, classic estimators can lead to a significant extension and/or narrowing of the range of control limits. As a consequence, this type of chart proves to be useless. The solution may be the use of robust estimators or distribution-free control charts. The use of robust estimators provides good estimates in both the absence and the presence of outliers. The article presents a review of literature in the field of robust control charts, as well as a definition of directions for further research in this area.
The paper presents results of studies aimed at the determination of the possibility of demand prediction based on its sales variability in the past. For a group of selected products, the coefficient of variation in subsequent weeks was calculated and introduced as an input to a Nonlinear Autoregressive Neural Network model. The neural network model predicted future demand on the basis of what it has learned guided by historical data input to it. The quality of the match was determined using the coefficient of the residual sum, calculated as the sum of residuals is the distance between the actual and the predicted value and by means of the mean squared error value. In the analyses, the impact of the type of learning function and the size of the delay vector, which are parameters of the neural network, were investigated. The type of function which guarantees the best quality of the predictive model was determined.
Continuous Improvement is a concept recognised in the literature and management practice as essential in today's business environment. The article deals with the management of projects implemented in manufacturing companies as part of broadly understood organisation improvement programmes The first part of the article presents the conclusions resulting from literature analysis regarding the significance of improvement projects. Attention was drawn to the need for skilful management of this type of initiatives, errors appearing in their implementation and their classification. This was followed by a reference to empirical research conducted in a manufacturing company, which allowed for their more detailed characteristics.
The purpose of the article is to determine the Type I error and Average Run Length values for charts and R, for which control limits have been determined based on the Skewness Correction method (SC method), with an unknown probability distribution of the qualitative feature being tested. The study also used the Monte Carlo Simulation, in which two sampling methods were used to obtain random input scenarios - matching theoretical distributions (selected skewed distributions) and bootstrap resampling based on a manufacturing company’s measurement data. The presented article is a continuation of Czabak-Górska's (2016) research. The purpose of the article was to determine Type I error value and ARL type A for chart and R, for which the control limits were determined based on the skewness correction method. For this purpose, measurement data from a company producing car seat frames. Presented case study showed that the chart determined using the skewness correction method works better for the data described by the gamma or log-normal distribution. This, in turn, may suggest that appropriate distribution was selected for the presented data, thanks to which it is possible to determine the course and nature of the process, which is important from the point of view of its further analysis, e.g. in terms of the process capability.
This article applies to the set of performance indicators in companies operating in the transport and forwarding services. The authors described the importance of the process approach in the management of the organization, and its main requirements connected with the measurements and performance indicators. On this basis, the identification and analysis of the processes was carried out in small and medium-sized enterprises in the area of transport and forwarding. This is followed by a proposal to develop a performance measurement system dedicated to such companies. The system includes a comprehensive set of indicators to monitor the efficiency, effectiveness, timeliness and quality of the identified processes. The presented project is the original proposal of the authors, complementing the available literature knowledge. The paper depicts the research results which are based on a case study approach
The subject matter of this paper refers to the application of the acoustic emission method (AE) for the measurement and analysis of the pulses (AE) generated by surface partial discharges (SPD) occurring on bushing and stand-off insulators. Within the research work carried out, the results of which are presented in this paper, the AE pulses generated by SPDs were measured at meteorological and technical parameter changes for high-voltage experiments carried out. The range of the research work included the comparison of the timefrequency analysis results of the AE pulses generated by SPDs in a bushing insulator at the distance changes between an insulation grip and a ferrule, and at the internal electrode diameter changes. In Summing-up the comparative analysis was carried out for the results obtained in the time-frequency domain for bushing and stand-off insulators.
Within the research work carried out, the results of which are presented in this paper, a comparative analysis of the acoustic emission (AE) signals generated by partial single- and multi-source discharges (PDs) was carried out. The investigations were carried out in a model system, in which PDs were generated with two identical spark-gaps. In the work, spark-gaps in the surface system were used, due to the fact that this is the PD form occurring most often in power transformers. The AE signals were registered with a contact transducer placed on the external part of the tub. For the AE signals generated by both single-source PDs and multisource PDs, a frequency analysis using a fast Fourier transform (FFT) and an analysis in the time-frequency domain using a short-time Fourier transform (STFT) were carried out. The results of the frequency analysis are presented in the form of power density spectra, and the time-frequency analysis results in the form of spectrograms. Analyzing the research results the signals registered were compared from the point of view of identification possibilities of the particular PD forms. The aim of the research work carried out is also proving the usefulness of the AE method for diagnosing the condition of high-voltage power appliance insulation, in which multi-source discharges occur.
The paper presents the application of the multicomparative algorithm for classifying acoustic signals generated by eight basic partial discharge (PD) forms modeled in insulation oil. The signals were measured and catalogued by using the acoustic method. The aim of the research work carried out was creation of a discriminating classifier which would make it possible to recognize the eight basic signal classes which could be associated with a strictly defined defect type of paper-oil insulation of power transformers. (The application of the multicomparative algorithm for classifying acoustic signals coming from partial discharges).
 Tomasz Boczar合作论文数Technical University of Opole37
 S. Borucki合作论文数Institute of Electric Power Engineering, Technical University of Opole20
 Andrzej Cichoń合作论文数Institute of Computer Engineering, Control and Robotics, Wroclaw University of Technology17
 Aneta Kucinska-Landwojtowicz合作论文数Opole Univ Technol, Fac Prod & Logist Engn, Opole, Poland10
 Izabela D. Czabakgorska合作论文数Opole University of Technology8j skubis合作论文数6A. Cicho合作论文数3Szmechta, M.合作论文数3Zmarzly, D.合作论文数3
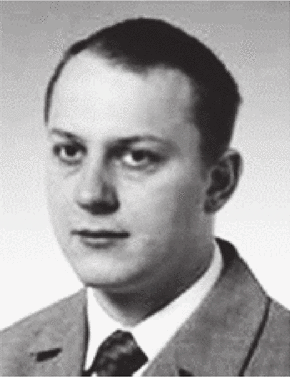 Dariusz Zmarz¿y合作论文数Faculty of Electrical Engineering, Automatic Control and Computer Science, Opole University of Technology Prószkowska3Dariusz Zmarz合作论文数2Pawel Kurtasz合作论文数Katedra Wysokich Napiec, Politech Opolska2P. Fracz合作论文数1P. Witkowski合作论文数1Jacek Luczak合作论文数1Yanan Yu合作论文数1
 Pedro Domingues合作论文数Univ Minho1Przemyslaw Witkowski合作论文数1
 Mariusz Roland Rzasa合作论文数1
 Brygida Klemens合作论文数Fac Econ & Management, Opole Univ Technol1
 Yude Shao合作论文数1
 Mariusz Czabak合作论文数Fac Civil Engn & Architecture, Opole Univ Technol1
 Daria Wotzka合作论文数Autom. Control & Inf., Opole Univ. of Technol.;c;Autom. Control & Inf., Opole Univ. of Technol.1
 Aksamit, P.合作论文数1
 Paulo Sampaio合作论文数Dept Prod & Syst, Univ Minho1Qianhui Gao (高千惠)合作论文数1
 Ranachowski Zbigniew合作论文数1D. Frączek合作论文数1




