Supplemental table detailing statistics from the GSEA analysis comparing ritux and RV
Supplemental figure describing the proportion of peripheral monocyte cell subsets based on clinical response
Anti-programmed cell death protein1 (anti-PD-1) based immunotherapies improve survival in oesophageal adenocarcinoma (OAC) patients, but not all patients benefit. Inhibitors of the histone methyltransferase EZH2 (EZH2i) have been shown upregulate major histocompatibility complex (MHC) class I and II expression which overcame anti-PD-1 resistance in other cancers. This in vitro study assessed the efficacy of EZH2i and their impact on MHC expression in OAC. Three OAC cell lines (FLO1, MFD1, OE33) and a EZH2i-sensitive line (HS-SY-II) were cultured in 2D and treated with a EZH2i panel. Cell viability (via EC50 calculation) was assessed via MTS assay. Differential gene expression analysis followed by gene set enrichment analysis of RNA-sequencing data from the cell lines treated with EZH2i or DMSO control was performed in R. Flow cytometry of MHC Class I (HLA-ABC) and II (HLA-DR) was performed in parallel replicate experiments. EZH2i demonstrated similar efficacy in all 4 cell lines (EC50 > 5 µM). In the RNA-sequencing data, EZH2i was associated with gene set enrichment of interferon alpha and gamma signalling pathways (p<0.001). In FLO1 cells, HLA-ABC stain intensity was significantly increased (p=0.006) following EZH2i but not the proportion of cells expressing HLA-ABC (99.3% vs 99.0%). EZH2i increased in the proportion of cells expressing HLA-DR (18.3% vs 1.0%, p=0.001). Our data demonstrate the potential of EZH2i as a therapy to upregulate tumour cell MHC 1 and 2 expression which in turn may enhance anti-PD-1 immunotherapy response in OAC. Future work requires investigating EZH2i in combination with anti-PD-1 and chemotherapies.
Supplemental figure portraying the cell communication analysis in both pre- and on-treatment biopsies in PR versus NR.
Supplemental table detailing the top 50 DEGs and leading edge genes from scRNAseq and bulk RNAseq and the resulting overlapping genes
Supplemental figure describing the proportion of peripheral lymphoid cell subsets based on clinical response
Supplemental table detailing statistics from the GSEA analysis comparing progressive disease and partial response
Supplemental figure showing the correlation analysis between peripheral blood and immune subsets
Supplemental table detailing expression of CD27 on individual immune subsets by clinical response
Supplementary table detailing characteristics of (overall) clinical responses to treatment
Supplemental figure showing changes in peripheral lymphoid populations throughout the trial
Supplemental figure showing the comparison of cell fractions between high and low grade disease
 Jon Strefford合作论文数Faculty of Medicine, University of Southampton51
 John Holloway合作论文数Southampton Marine and Maritime Institute, Faculty of Engineering and Physical Sciences, University of Southampton36
 Andrew R. Collins (Andrew Collins)合作论文数University of Southampton30
 Aymen Al-Shamkhani合作论文数29Helen Parker合作论文数28
 Anna Turaj合作论文数27
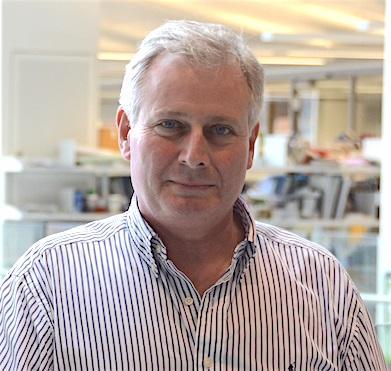 Peter Johnson合作论文数University of Southampton27Tibor Keler合作论文数27
 Kim Linton合作论文数Division of Cancer Sciences, School of Medical Sciences, Faculty of Biology, Medicine and Health, The University of Manchester26
 David Oscier合作论文数Royal Bournemouth Hospital26Louise Stanton合作论文数Faculty of Medicine, University of Southampton26
 Gareth Griffiths合作论文数Faculty of Medicine, University of Southampton26
 Anton Parker合作论文数26Adam Coleman合作论文数25Wendy Osborne合作论文数25Kerensa Thorne合作论文数25Zadie Davis合作论文数The Royal Bournemouth and Christchurch Hospitals NHS Foundation Trust25Pam McKay合作论文数24
 Jane Gibson合作论文数Faculty of Medicine, University of Southampton22Renata Walewska合作论文数19Anne Gardiner合作论文数17
 Tim Underwood合作论文数University of Southampton16
 Francesco Forconi合作论文数Department of Clinical Medicine and Immunological Sciences, University of Siena16Marina Parry合作论文数15
 Jade Forster合作论文数15Davies Andrew R合作论文数15
 Jonathan West合作论文数Faculty of Medicine, University of Southampton14
 Steele Andrew J合作论文数Faculty of Medicine, University of Southampton;Faculty of Medicine, University of Southampton14
 Richard Rosenquist Brandell合作论文数Department of Molecular Medicine and Surgery, Karolinska Institutet;Karolinska University Hospital14Sheila Barton合作论文数Faculty of Medicine, University of Southampton14
 Castro David Gonzalez de合作论文数12Xochelli Aliki合作论文数Institute of Applied Biosciences, Center for Research and Technology Hellas;Hematology Department and HCT Unit, G. Papanicolaou Hospital;Science for Life Laboratory, Uppsala University12
 Stephen Holgate合作论文数Faculty of Medicine, University of Southampton12
 Graham Packham合作论文数University of Southampton11Christina Kalpadakis合作论文数Department of Hematology, University of Crete School of Medicine11
 Rachel Parker合作论文数11Neil McIver-Brown合作论文数10
 Jun Wang合作论文数BGI Shenzhen, Shenzhen 518083, Peoples R China10
 Margaret Ashton-Key合作论文数10
 Viktor Ljungstrom合作论文数10
 Mark Cragg合作论文数Centre for Cancer Immunology, University of Southampton10
 Guy Pratt合作论文数Cancer Research UK Clinical Trials Unit, University of Birmingham10
 Sarah Ennis合作论文数Human Genetics Division. School of Medicine, University of Southampton10
 Ghia Paolo Prospero合作论文数Medical School, Università Vita-Salute San Raffaele;B-Cell Neoplasia Unit, Division of Experimental Oncology, IRCCS Ospedale San Raffele10Gerassimos A. Pangalis合作论文数First Department of Internal Medicine, University of Athens School of Medicine10A. Gardiner合作论文数9
 Marta Larrayoz合作论文数9




