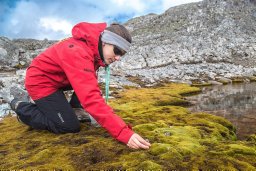
Aim Polar and alpine plants live at the edge of their physiological limits. Thus, relatively small changes in climate can have disproportionate effects on biological and ecological processes. Antarctic mosses display highly variable micro-topography (canopy architecture) over centimetre scales that correspond with spatial patterns in moss health. We aimed to assess the influence of centimetre-scale micro-topography on biologically relevant canopy microclimates across Antarctic moss beds.Location Trans-Antarctic.Time Period 2018-2023.Major Taxa Studied Moss communities (bryophytes).Methods Spatially explicit microclimate data were measured (canopy temperature and water content) at different micro-topographic positions (micro-ridges and valleys, and various micro-slopes and aspects) within 1 m2 plots of continuous moss cover in Maritime and East Antarctica. Solar radiation was modelled at 1 cm2 resolution.Results (1) Moss canopies varied by up to 2.24 degrees C in mean and 15 degrees C in maximum temperature within plots, with centimetre-scale micro-topography consistently shaping microclimate conditions. (2) Micro-topographic position, seasonal solar dynamics and processes such as radiative trapping jointly influence the spatial structure of moss temperatures over centimetre scales. (3) East Antarctic mosses show a greater ability to warm above ambient air temperature compared to Maritime Antarctic mosses and may be especially at risk of exceeding upper temperature thresholds.Main Conclusions This study considers the effect of centimetre-scale moss micro-topography on moss canopy microclimates and more broadly offers novel insights into the spatial structure and variation of ground-level climate over scales typically overlooked by in situ measurements. We discuss centimetre-scale microclimate variation in terms of moss physiology and observed declines in the health of East Antarctic mosses which visibly map to the micro-topography. These findings are especially relevant for regions across the globe with short-stature vegetation, like bio-crusts, and alpine and polar fellfields. Recognising climate variation at micro-topographic scales is crucial for understanding ecophysiology and plant-climate interactions.
AimThe scale of environmental data is often defined by their extent (spatial area, temporal duration) and resolution (grain size, temporal interval). Although describing climate data scale via these terms is appropriate for most meteorological applications, for ecology and biogeography, climate data of the same spatiotemporal resolution and extent may differ in their relevance to an organism. Here, we propose that climate proximity, or how well climate data represent the actual conditions that an organism is exposed to, is more important for ecological realism than the spatiotemporal resolution of the climate data.LocationTemperature comparison in nine countries across four continents; ecological case studies in Alberta (Canada), Sabah (Malaysia) and North Carolina/Tennessee (USA).Time Period1960-2018.Major Taxa StudiedCase studies with flies, mosquitoes and salamanders, but concepts relevant to all life on earth.MethodsWe compare the accuracy of two macroclimate data sources (ERA5 and WorldClim) and a novel microclimate model (microclimf) in predicting soil temperatures. We then use ERA5, WorldClim and microclimf to drive ecological models in three case studies: temporal (fly phenology), spatial (mosquito thermal suitability) and spatiotemporal (salamander range shifts) ecological responses.ResultsFor predicting soil temperatures, microclimf had 24.9% and 16.4% lower absolute bias than ERA5 and WorldClim respectively. Across the case studies, we find that increasing proximity (from macroclimate to microclimate) yields a 247% improvement in performance of ecological models on average, compared to 18% and 9% improvements from increasing spatial resolution 20-fold, and temporal resolution 30-fold respectively.Main ConclusionsWe propose that increasing climate proximity, even if at the sacrifice of finer climate spatiotemporal resolution, may improve ecological predictions. We emphasize biophysically informed approaches, rather than generic formulations, when quantifying ecoclimatic relationships. Redefining the scale of climate through the lens of the organism itself helps reveal mechanisms underlying how climate shapes ecological systems.
The persistence of a soil seed bank influences weed management options. However, for many species, the degree of persistence of a soil seed bank is unknown. We assessed how long seeds remain in the soil for two invasive weeds, Chrysanthemoides monilifera subsp. monilifera (boneseed) and C. monilifera subsp. rotundata (bitou bush), as seeds of these species were predicted to have different longevity in the soil associated with differences in seed coat thickness. Seeds of both subspecies were buried at two depths at two sites in eastern Australia. Seeds were tested for germinability and viability regularly over an 8-year period. Freshly collected seeds had quite low viability, and there was a rapid decline in viability in the first couple of years after burial, with C. m. rotundata declining faster than C. m. monilifera. Some seeds, however, remained viable in the soil at some sites for up to 8 years, with high site-to-site variability. The variability in viability from site to site may be due to the length of time soils remain moist: a combination of rainfall quantity and humidity levels. The low numbers of seeds remaining viable at 8 years indicate progressively lower probabilities of recruitment at sites following weed control but also suggest that monitoring for both subspecies needs to occur for a long period to minimize the risk of reinfestation from the seed bank.
Most statistical models of microclimate focus on the difference or "offset' between standardized air temperatures (macroclimate) and those of a specific habitat such as forest understorey, grassland or under a log. However, these offsets can fluctuate from positive to negative over a single day such that common practice consists in aggregating data into daily mean, minimum and maximum before modelling monthly offsets for each summary statistic. Here, we propose a more parsimonious and flexible approach relying on just two parameters: the slope and equilibrium. The slope captures the linear relationship between microclimate and macroclimate, while the equilibrium is the point at which microclimate equals macroclimate. Although applicable to other habitats, we demonstrate the relevance of our method by focusing on forest understoreys.We installed temperature sensors at 1-m height inside forest stands and in nearby open grasslands equipped with standardized weather stations, across 13 sites in France spanning a wide climatic gradient. From a year of hourly temperatures and for each sensor, we established relationships between microclimate and macroclimate temperatures using two linear mixed-effects models, during the leaf -on (May- November) and leaf -off period (December- April). We extracted the monthly equilibrium and slope for each sensor, and used another set of linear mixed-effects models to investigate their main determinants.The slope was chiefly determined by stand structure variables interacting with the leaf- on/leaf- off period: stand type (conifer vs broadleaf); shade-casting ability; stand age; dominant height; stem density; and cover of the upper and lower shrub layer. In contrast, forest structure had no explanatory power on the equilibrium. We found the equilibrium to be positively related to mean macroclimate temperature, interacting with the open/forest habitat.The method introduced here overcomes several shortcomings of modelling microclimate offsets. By demonstrating that the slope and equilibrium vary in predictable ways, we have established a general linkage between microclimate and macroclimate temperatures that can be applied to any location or time if we know the mean macroclimate temperature (equilibrium) and buffering or amplifying capacity of the habitat (slope). We also warn about methodological biases due to the reference used for macroclimate.
Microclimate research gained renewed interest over the last decade and its importance for many ecological processes is increasingly being recognized. Consequently, the call for high-resolution microclimatic temperature grids across broad spatial extents is becoming more pressing to improve ecological models. Here, we provide a new set of open-access bioclimatic variables for microclimate temperatures of European forests at 25 × 25 m2 resolution.
Research in global change ecology relies heavily on global climatic grids derived from estimates of air temperature in open areas at around 2 m above the ground. These climatic grids do not reflect conditions below vegetation canopies and near the ground surface, where critical ecosystem functions occur and most terrestrial species reside. Here, we provide global maps of soil temperature and bioclimatic variables at a 1‐km 2 resolution for 0–5 and 5–15 cm soil depth. These maps were created by calculating the difference (i.e. offset) between in situ soil temperature measurements, based on time series from over 1200 1‐km 2 pixels (summarized from 8519 unique temperature sensors) across all the world's major terrestrial biomes, and coarse‐grained air temperature estimates from ERA5‐Land (an atmospheric reanalysis by the European Centre for Medium‐Range Weather Forecasts). We show that mean annual soil temperature differs markedly from the corresponding gridded air temperature, by up to 10°C (mean = 3.0 ± 2.1°C), with substantial variation across biomes and seasons. Over the year, soils in cold and/or dry biomes are substantially warmer (+3.6 ± 2.3°C) than gridded air temperature, whereas soils in warm and humid environments are on average slightly cooler (−0.7 ± 2.3°C). The observed substantial and biome‐specific offsets emphasize that the projected impacts of climate and climate change on near‐surface biodiversity and ecosystem functioning are inaccurately assessed when air rather than soil temperature is used, especially in cold environments. The global soil‐related bioclimatic variables provided here are an important step forward for any application in ecology and related disciplines. Nevertheless, we highlight the need to fill remaining geographic gaps by collecting more in situ measurements of microclimate conditions to further enhance the spatiotemporal resolution of global soil temperature products for ecological applications.
This collection contains all code and data to reproduce the soil offset maps and soil bioclimatic variable, and uncertainty analyses The following files are available: 20201215_SoilT_monthtlyVals_Sampled_gapfilled.csv: temperature logger locations with sampled covariate data 20201215_SoilTemp_monthly_cleaned.csv: observations 20200422_soilT_data_processing.R: to process and combine the above two csv files 20201215_soilT_pipeline.py: mapping pipeline 20201215_PCA_ConvexHull_IntExt.ipynb: spatial assessment of interpolation vs. extrapolation 20210118_spatial_leave_one_out.py: spatial leave-one-out cross-validation analysis 202101018_soilT_part_dep_plots.R: partial dependence plots 20210126_Bioclim_calcs_0_5cm.js: bioclimatic variable calculations at 0-5cm 20210126_Bioclim_calcs_5_15cm.js: bioclimatic variable calculations at 5-15cm 20210224_Fig1_FigS1_FigS4.R: to analyze the yearly mean data 20210224_SoilTemp_Annual.txt: yearly observations
Ecological research heavily relies on coarse‐gridded climate data based on standardized temperature measurements recorded at 2 m height in open landscapes. However, many organisms experience environmental conditions that differ substantially from those captured by these macroclimatic (i.e. free air) temperature grids. In forests, the tree canopy functions as a thermal insulator and buffers sub‐canopy microclimatic conditions, thereby affecting biological and ecological processes. To improve the assessment of climatic conditions and climate‐change‐related impacts on forest‐floor biodiversity and functioning, high‐resolution temperature grids reflecting forest microclimates are thus urgently needed. Combining more than 1200 time series of in situ near‐surface forest temperature with topographical, biological and macroclimatic variables in a machine learning model, we predicted the mean monthly offset between sub‐canopy temperature at 15 cm above the surface and free‐air temperature over the period 2000–2020 at a spatial resolution of 25 m across Europe. This offset was used to evaluate the difference between microclimate and macroclimate across space and seasons and finally enabled us to calculate mean annual and monthly temperatures for European forest understories. We found that sub‐canopy air temperatures differ substantially from free‐air temperatures, being on average 2.1°C (standard deviation ± 1.6°C) lower in summer and 2.0°C higher (±0.7°C) in winter across Europe. Additionally, our high‐resolution maps expose considerable microclimatic variation within landscapes, not captured by the gridded macroclimatic products. The provided forest sub‐canopy temperature maps will enable future research to model below‐canopy biological processes and patterns, as well as species distributions more accurately.
Forest microclimates contrast strongly with the climate outside forests. To fully understand and better predict how forests' biodiversity and functions relate to climate and climate change, microclimates need to be integrated into ecological research. Despite the potentially broad impact of microclimates on the response of forest ecosystems to global change, our understanding of how microclimates within and below tree canopies modulate biotic responses to global change at the species, community and ecosystem level is still limited. Here, we review how spatial and temporal variation in forest microclimates result from an interplay of forest features, local water balance, topography and landscape composition. We first stress and exemplify the importance of considering forest microclimates to understand variation in biodiversity and ecosystem functions across forest landscapes. Next, we explain how macroclimate warming (of the free atmosphere) can affect microclimates, and vice versa, via interactions with land-use changes across different biomes. Finally, we perform a priority ranking of future research avenues at the interface of microclimate ecology and global change biology, with a specific focus on three key themes: (1) disentangling the abiotic and biotic drivers and feedbacks of forest microclimates; (2) global and regional mapping and predictions of forest microclimates; and (3) the impacts of microclimate on forest biodiversity and ecosystem functioning in the face of climate change. The availability of microclimatic data will significantly increase in the coming decades, characterizing climate variability at unprecedented spatial and temporal scales relevant to biological processes in forests. This will revolutionize our understanding of the dynamics, drivers and implications of forest microclimates on biodiversity and ecological functions, and the impacts of global changes. In order to support the sustainable use of forests and to secure their biodiversity and ecosystem services for future generations, microclimates cannot be ignored.
Current analyses and predictions of spatially explicit patterns and processes in ecology most often rely on climate data interpolated from standardized weather stations. This interpolated climate data represents long-term average thermal conditions at coarse spatial resolutions only. Hence, many climate-forcing factors that operate at fine spatiotemporal resolutions are overlooked. This is particularly important in relation to effects of observation height (e.g. vegetation, snow and soil characteristics) and in habitats varying in their exposure to radiation, moisture and wind (e.g. topography, radiative forcing or cold-air pooling). Since organisms living close to the ground relate more strongly to these microclimatic conditions than to free-air temperatures, microclimatic ground and near-surface data are needed to provide realistic forecasts of the fate of such organisms under anthropogenic climate change, as well as of the functioning of the ecosystems they live in. To fill this critical gap, we highlight a call for temperature time series submissions to SoilTemp, a geospatial database initiative compiling soil and near-surface temperature data from all over the world. Currently, this database contains time series from 7,538 temperature sensors from 51 countries across all key biomes. The database will pave the way toward an improved global understanding of microclimate and bridge the gap between the available climate data and the climate at fine spatiotemporal resolutions relevant to most organisms and ecosystem processes.
Understanding the factors that determine species' resistance to environmental change is of utmost importance for biodiversity conservation. Here we investigated how the abundances of marshland species are determined by niche properties and functional traits. We re-surveyed 150 vegetation plots that were first surveyed in 1973 in order to explore species abundance changes over time. We found that the mean water level in the habitats of most studied species decreased significantly from 1973 to 2012. Nine of 17 target species were identified as abundance decreasing species and the other eight as abundance increasing species. The comparisons of seven plant characteristics (niche position water level, plant height, and five leaf traits) showed that the decreasing species had a significantly higher value of optimum water level and marginally significantly lower leaf N contents and specific leaf area (SLA) than those in increasing species. The stepwise regression analysis showed that optimum water level and leaf N were the best predictors of abundance changes of marsh plant species, as well as that the effect of optimum water level was stronger than that of leaf N. Our findings demonstrated that niche properties may be important for forecasting changes in wetland plant communities over time.
The terrestrial flora of Antarctica's frozen continent is restricted to sparse ice-free areas and dominated by lichens and bryophytes. These plants frequently battle sub-zero temperatures, extreme winds and reduced water availability; all influencing their ability to survive and grow. Antarctic mosses, however, can have canopy temperatures well above air temperature. At midday, canopy temperatures can exceed 15°C, depending on moss turf water content. In this study, the optimum temperature of photosynthesis was determined for six Antarctic moss species: Bryum pseudotriquetrum, Ceratodon purpureus, Chorisodontium aciphyllum, Polytrichastrum alpinum, Sanionia uncinata, and Schistidium antarctici collected from King George Island (maritime Antarctica) and/or the Windmill Islands, East Antarctica. Both chlorophyll fluorescence and gas exchange showed maximum values of electron transport rate occurred at canopy temperatures higher than 20°C. The optimum temperature for both net assimilation of CO2 and photoprotective heat dissipation of three East Antarctic species was 20-30°C and at temperatures below 10°C, mesophyll conductance did not significantly differ from 0. Maximum mitochondrial respiration rates occurred at temperatures higher than 35°C and were lower by around 80% at 5°C. Despite the extreme cold conditions that Antarctic mosses face over winter, the photosynthetic apparatus appears optimised to warm temperatures. Our estimation of the total carbon balance suggests that survival in this cold environment may rely on a capacity to maximize photosynthesis for brief periods during summer and minimize respiratory carbon losses in cold conditions.
Climate change is affecting Antarctica and minimally destructive long-term monitoring of its unique ecosystems is vital to detect biodiversity trends, and to understand how change is affecting these communities. The use of automated or semi-automated methods is especially valuable in harsh polar environments, as access is limited and conditions extreme. We assessed moss health and cover at six time points between 2003 and 2014 at two East Antarctic sites. Semi-automatic object-based image analysis (OBIA) was used to classify digital photographs using a set of rules based on digital red, green, blue (RGB) and hue-saturation-intensity (HSI) value thresholds, assigning vegetation to categories of healthy, stressed or moribund moss and lichens. Comparison with traditional visual estimates showed that estimates of percent cover using semi-automated OBIA classification fell within the range of variation determined by visual methods. Overall moss health, as assessed using the mean percentages of healthy, stressed and moribund mosses within quadrats, changed over the 11 years at both sites. A marked increase in stress and decline in health was observed across both sites in 2008, followed by recovery to baseline levels of health by 2014 at one site, but with significantly more stressed or moribund moss remaining within the two communities at the other site. Our results confirm that vegetation cover can be reliably estimated using semi-automated OBIA, providing similar accuracy to visual estimation by experts. The resulting vegetation cover estimates provide a sensitive measure to assess change in vegetation health over time and have informed a conceptual framework for the changing condition of Antarctic mosses. In demonstrating that this method can be used to monitor ground cover vegetation at small scales, we suggest it may also be suitable for other extreme environments where repeat monitoring via images is required.
In the face of the growing challenges brought about by human activities, effective planning and decision-making in biodiversity and ecosystem conservation, restoration, and sustainable development are urgently needed. Ecological models can play a key role in supporting this need and helping to safeguard the natural assets that underpin human wellbeing and support life on land and below water (United Nations Sustainable Development Goals; SDG 15 & 14). The urgency and complexity of safeguarding forest (SDG 15.2) and mountain ecosystems (SDG 15.4), for example, and halting decline in biodiversity (SDG 15.5) in the Anthropocene requires a re-envisioning of how ecological models can best support the comprehensive assessments of biodiversity and its change that are required for successful action. A key opportunity to advance ecological modeling for both predictive and explanatory purposes arises through a collaboration between ecologists and the Earth observation community, and a close integration of remote sensing and species distribution models. Remote sensing products have the capacity to provide continuous spatiotemporal information about key factors driving the distribution of organisms, therefore improving both the use and accuracy of these models for management and planning. Here we first survey the literature on remote sensing data products available to ecological modelers interested in improving predictions of species range dynamics under global change. We specifically explore the key biophysical processes underlying the distribution of species in the Anthropocene including climate variability, changes in land cover, and disturbances. We then discuss potential synergies between the ecological modeling and remote sensing communities, and highlight opportunities to close the data and conceptual gaps that currently impede a more effective application of remote sensing for the monitoring and modeling of ecological systems. Specific attention is given to how potential collaborations between the two communities could lead to new opportunities to report on progress towards global agendas - such as the Agenda 2030 for sustainable development of the United Nations or the Post-2020 Global Biodiversity Framework of the Convention for Biological Diversity, and help guide conservation and management strategies towards sustainability.
Heatwaves, with increases in day and night time temperatures, are predicted to increase in frequency. We investigated the response of forbs, shrubs, grasses and non-grass monocotyledons from warm temperate environments in Australia to repeated heatwaves to determine if responses differed with growth form and whether the addition of hot night temperatures influenced the ability of species to grow and acclimate. Plants were subjected to 3, 3-day heatwaves comprising either hot days and nights or hot days and cool nights, with control plants maintained under cool days and nights. All species were thermotolerant to repeated heatwaves, although two species showed lower biomass under heat treatments, indicating repeated heatwaves influenced function in some, but not all species. While there was evidence of photosynthetic damage in some species, these recovered by the end of the experiment. While grasses and one herb showed some evidence of photosystem acclimation, increases in the threshold temperatures for membrane breakdown only occurred in one shrub. Leaf sacrifice in grasses was significantly increased after repeated heatwaves suggesting that fuel loads in grass communities will increase in the future. These results indicate high resilience for these Australian native warm temperate plants although lower growth rates in some species after heatwaves may result in changes to community composition.
East Antarctica has shown little evidence of warming to date1–3 with no coherent picture of how climate change is affecting vegetation4–6. In stark contrast, the Antarctic Peninsula experienced some of the most rapid warming on the planet at the end of the last century2,3,7,8 causing changes to the growth and distribution of plants9–11. Here, we show that vegetation in the Windmill Islands, East Antarctica is changing rapidly in response to a drying climate. This drying trend is evident across the region, as demonstrated by changes in isotopic signatures measured along moss shoots12,13, moss community composition and declining health, as well as long-term observations of lake salinity14 and weather. The regional drying is possibly due to the more positive Southern Annular Mode in recent decades. The more positive Southern Annular Mode is a consequence of Antarctic ozone depletion and increased greenhouse gases, and causes strong westerly winds to circulate closer to the continent, maintaining colder temperatures in East Antarctica despite the increasing global average15–18. Colder summers in this region probably result in reduced snow melt and increased aridity. We demonstrate that rapid vegetation change is occurring in East Antarctica and that its mosses provide potentially important proxies for monitoring coastal climate change. Vegetation in the Windmill Islands, East Antarctica, is changing rapidly in response to a drying climate. Mosses provide potentially important indicators of coastal climate change in the region.
Understanding the net photosynthesis of plant canopies requires quantifying photosynthesis in challenging environments, principally due to the variable light intensities and qualities generated by sunlight interactions with clouds and surrounding foliage. The dynamics of sunflecks and rates of change in light intensity at the beginning and end of sustained light (SL) events makes photosynthetic measurements difficult, especially when dealing with less accessible parts of plant foliage. High time resolved photosynthetic monitoring from pulse amplitude modulated (PAM) fluorometers has limited applicability due to the invasive nature of frequently applied saturating flashes. An alternative approach used here provides remote (<5 m), high time resolution (10 s), PAM equivalent but minimally invasive measurements of photosynthetic parameters. We assessed the efficacy of the QA flash protocol from the Light-Induced Fluorescence Transient (LIFT) technique for monitoring photosynthesis in mature outer canopy leaves of potted Persea americana Mill. cv. Haas (Avocado) trees in a semi-controlled environment and outdoors. Initially we established that LIFT measurements were leaf angle independent between ±40° from perpendicular and moreover, that estimates of 685 nm reflectance (R685) from leaves of similar chlorophyll content provide a species dependent, but reasonable proxy for incident light intensity. Photosynthetic responses during brief light events (≤10 min), and the initial stages of SL events, showed similar declines in the quantum yield of photosystem II (ΦII) with large transient increases in 'constitutive loss processes' (ΦNO) prior to dissipation of excitation by non-photochemical quenching (ΦNPQ). Our results demonstrate the capacity of LIFT to monitor photosynthesis at a distance during highly dynamic light conditions that potentially may improve models of canopy photosynthesis and estimates of plant productivity. For example, generalized additive modelling performed on the 85 dynamic light events monitored identified negative relationships between light event length and ∆ΦII and ∆electron transport rate using either ∆photosynthetically active radiation or ∆R685 as indicators of leaf irradiance.
Linked Article: https://doi.org/10.1002/ece3.3972
 John R. Gollan合作论文数Australian Musuem15
 Sharon A Robinson合作论文数GlaxoSmithKline11
 Jonathan Lenoir合作论文数Université de Picardie Jules Verne;Laboratoire Écologie et Dynamique Des, Centre National de La Recherche Scientifique10
 Jonas Lembrechts合作论文数Department of Biology, Faculty of Science, Utrecht University;Department of Biology, University of Antwerp;CitizenWise9
 Miska Luoto合作论文数Geotieteiden ja maantieteen osasto, Matemaattis-luonnontieteellinen tiedekunta, Helsingin Yliopisto9
 Aalto Juha合作论文数Finnish Meteorological Institute8
 Pieter De Frenne合作论文数Laboratory of Forestry, Ghent University8
 Vangansbeke Pieter合作论文数7
 Kopecký Martin合作论文数7
 Ilya M. D. Maclean合作论文数Environment and Sustainability Institute,University of Exeter7
 Daniel Ramp合作论文数School of Biological, Earth & Environmental Sciences, University of New South Wales7
 Kristoffer Hylander合作论文数Department of Botany, Stockholm University7
 Ivan Nijs合作论文数University of Antwerp Research Group of Plant and Vegetation Ecology, Department of Biology Universiteitsplein 1 2610 Wilrijk Belgium7
 David H. Klinges合作论文数School of Natural Resources and Environment, University of Florida6
 Stef Haesen合作论文数Dept Earth & Environm Sci, Katholieke Univ Leuven6
 Camille Meeussen合作论文数Forest & Nat Lab, Univ Ghent6
 Sanne Govaert合作论文数Forest & Nat Lab, Univ Ghent6
 Pekka Niittynen合作论文数Univ Helsinki, Dept Geosci & Geog, Helsinki, Finland6
 Caroline Greiser合作论文数Bolin Ctr Climate Res, Stockholm Univ6
 Martin Macek合作论文数Inst Bot, Czech Acad Sci6
 Koenraad Van Meerbeek合作论文数Division Forest, Nature and Landscape, Department of Earth and Environmental Sciences, KU Leuven, Leuven, Belgium6
 Zellweger Florian合作论文数Snow and Landscape Research, WSL Swiss Federal Institute for Forest;Institute of Terrestrial Ecosystems, ETH Zürich;Institute of Terrestrial Ecosystems, WSL Swiss Federal Institute for Forest6
 Brett Scheffers合作论文数Department of Wildlife Ecology and Conservation, Institute of Food and Agricultural Sciences, University of Florida6
 Kris O. French合作论文数Sch Biol Sci, Univ Wollongong6
 Jan Wild合作论文数Institute of Botany, Academy of Sciences of the Czech Republic6
 Jonas Schmeddes合作论文数5
 Josef Bruna合作论文数5
 Lucia Hederova合作论文数5Johan van den Hoogen合作论文数5Matěj Man合作论文数Czech Acad Sci, Inst Bot, Zamek 1, Pruhonice 25243, Czech Republic5
 Lena Muffler合作论文数5
 Marek Ciliak合作论文数5
 Roman Plichta合作论文数5
 Nina Buchmann合作论文数Department of Environmental Systems Science, Institut Des Sciences Agronomiques, Eidgenossische Technische Hochschule Zurich5
 Radim Matula合作论文数Faculty of Forestry and Wood Technology, Mendel University in Brno5
 Gharun Mana合作论文数Faculty of Agriculture and Environment, University of Sydney5
 Patrice Descombes合作论文数Unit of Ecology &Evolution, University of Fribourg;Unit of Ecology & Evolution, University of Fribourg5
 Merinero Sonia合作论文数Área de Biodiversidad y Conservación, Universidad Rey Juan Carlos5
 Melinda Waterman合作论文数5
 Robert Weigel合作论文数Institute for Electronics Engineering, University of Erlangen-Nuremberg5
 Frantisek Malis合作论文数5
 Jane Wasley合作论文数Australian Antarctic Division;Department of the Environment;Channel Highway;Australian Antarctic Division|Department of the Environment|Channel Highway5
 Johanna Turnbull合作论文数5Juergen Kreyling合作论文数5
 Fabien Spicher合作论文数5
 Laurie Chisholm合作论文数5Joseph J. Bailey合作论文数4
 Krystal Randall合作论文数4Jhonatan Sallo Bravo合作论文数4




