Purpose: Sleep is an essential physiologic process, which is frequently disrupted in children with illness and/or injury. Accurate identification and quantification of sleep may provide insights to improve long-term clinical outcomes. Traditionally, however, the identification of sleep stages has relied on the resource-intensive and time-consuming gold standard polysomnogram. We sought to use limited EEG data, converted into density spectrum array EEG, to accurately identify sleep stages in a clinical pediatric population. Methods: We reviewed 87 clinically indicated pediatric polysomnographic studies with concurrent full montage EEG, between March 2017 and June 2020, of which 11 had normal polysomnogram and EEG interpretations. We then converted the EEG data of those normal studies into density spectral array EEG trends and had five blinded raters classify sleep stage (wakefulness, nonrapid eye movement [NREM] 1, NREM 2, NREM 3, and rapid eye movement) in 5-minute epochs. We compared the classified sleep stages from density spectral array EEG to the gold standard polysomnogram. Results: Inter-rater reliability was highest (κ = 0.745, P < 0.0001) when classifying state into wakefulness, NREM sleep, and rapid eye movement sleep. Agreement between group classification and polysomnogram was highest (κ = 0.873, [0.819, 0.926], P < 0.0001) when state was classified into wakefulness and sleep and was lowest (κ = 0.674 [0.645, 0.703], P < 0.0001) when classified into wakefulness, NREM 1, NREM 2, NREM 3, and rapid eye movement. The most common error that raters made was overscoring of NREM 1. Conclusions: Density spectral array EEG can be used to identify sleep stages in clinical pediatric patients without relying on traditional polysomnography.
As a key life-history trait, growth rates are often used to measure individual performance and to inform parameters in demographic models. Furthermore, intraspecific trait variation generates diversity in nature. Therefore, partitioning out and understanding drivers of spatiotemporal variation in growth rate is of fundamental interest in ecology and evolution. However, this has rarely been attempted owing to the amount of individual-level data required through both time and space, and issues with missing data in important covariates. Here, we implemented a Bayesian state-space model using individual-level data from 20 populations of Arctic charr (Salvelinus alpinus) across 15 capture occasions, which allowed us to: (i) integrate over the uncertainty of missing recapture records; (ii) robustly estimate size-dependence; and (iii) include a covariate (water temperature) that contained missing data. Interestingly, although there was substantial spatial, temporal and spatiotemporal variation in growth rate, this was only weakly associated with variation in water temperature and almost entirely independent of size, suggesting that spatiotemporal variation in other environmental conditions affected individuals across sizes similarly. This fine-scale spatiotemporal variation emphasizes the importance of local conditions and highlights the potential for spatiotemporal variation in a size-dependent life-history trait, even when environmental conditions are apparently very similar.
PURPOSE:Seizures occur in up to 40% of neonates with neonatal encephalopathy. Earlier identification of seizures leads to more successful seizure treatment, but is often delayed because of limited availability of continuous EEG monitoring. Clinical variables poorly stratify seizure risk, and EEG use to stratify seizure risk has previously been limited by need for manual review and artifact exclusion. The goal of this study is to compare the utility of automatically extracted quantitative EEG (qEEG) features for seizure risk stratification. METHODS:We conducted a retrospective analysis of neonates with moderate-to-severe neonatal encephalopathy who underwent therapeutic hypothermia at a single center. The first 24 hours of EEG underwent automated artifact removal and qEEG analysis, comparing qEEG features for seizure risk stratification. RESULTS:The study included 150 neonates and compared the 36 (23%) with seizures with those without. Absolute spectral power best stratified seizure risk with area under the curve ranging from 63% to 71%, followed by range EEG lower and upper margin, median and SD of the range EEG lower margin. No features were significantly more predictive in the hour before seizure onset. Clinical examination was not associated with seizure risk. CONCLUSIONS:Automatically extracted qEEG features were more predictive than clinical examination in stratifying neonatal seizure risk during therapeutic hypothermia. qEEG represents a potential practical bedside tool to individualize intensity and duration of EEG monitoring and decrease time to seizure recognition. Future work is needed to refine and combine qEEG features to improve risk stratification.
The estimation of natural selection is used to understand ecological and evolutionary processes in wild populations and is often used to predict change. However, the direct application of quantitative genetic methods, originally developed in animal breeding, has been less successful in the wild; in particular, predictions of evolutionary change are often made that are not observed. This misprediction, known as the “paradox of stasis,” can arise due to bias in estimates of selection via nonrandom missing data in phenotypes if viability selection has previously occurred on correlated traits. Here, we check for this bias in a wild population of Soay sheep where estimates of selection suggest that “bigger is better” for adult size, but evolutionary change of the predicted magnitude does not occur. We establish that standard procedures for estimating total lifetime selection are biased by prior viability selection. In particular, while phenotypically large lambs have high first year survival, we also show that lambs that are genetically predisposed to large adult size traits also suffer elevated juvenile mortality. While the phenotypic traits driving early-life selection against large adult body size are unknown, our genetic analysis reveals correlated selection against larger adult sizes that essentially resolves the paradox of stasis for adult body size traits in this wild population. The pattern we reveal is potentially widespread in nature; previous results showing predominantly positive selection of large body size could in general be explained by this kind of antagonistic prior viability selection.
Dispersal is critical to population persistence, colonization and connectivity which are all critical components of invasive success. While individual propensity to disperse varies within populations, the underlying mechanisms promoting individual dispersal remain unclear. Collectively, dispersal is influenced by the environment and individual phenotype. Here we investigated individual dispersal propensity in the Trinidadian guppy, Poecilia reticulata, and related individual variation in dispersal behaviour to phenotype and social/environmental conditions. Namely, we addressed the effect of sex ratio (social/environmental factor) on the tendency for individuals to disperse across physical barriers via jumping behaviour. Jumping is vital for the dispersal of many aquatic species and has been anecdotally linked to the guppy's global invasive success. We found similar jumping behaviour for males and females, with population sex ratio not influencing the magnitude of male or female dispersal. Further, we found consistent among-individual variation in jumping probability; individual differences explained 17.46% and 7.92% of total variation in jumping probability for males and females, respectively. These results strongly indicate that sex ratio does not influence jumping behaviour, suggesting that species invasions are mediated by a nonrandom subset of individuals with greater dispersal tendencies. Overall, this study stresses the need to move the focus of invasion biology from the species level to incorporate information on individual variation in behaviour.
BACKGROUND:A major goal in evolutionary biology is to understand the processes underlying phenotypic variation in nature. Commonly, studies have focused on large interconnected populations or populations found along strong environmental gradients. However, studies on small fragmented populations can give strong insight into evolutionary processes in relation to discrete ecological factors. Evolution in small populations is believed to be dominated by stochastic processes, but recent work shows that small populations can also display adaptive phenotypic variation, through for example plasticity and rapid adaptive evolution. Such evolution takes place even though there are strong signs of historical bottlenecks and genetic drift. Here we studied 24 small populations of the freshwater fish Arctic charr (Salvelinus alpinus) found in groundwater filled lava caves. Those populations were found within a few km2-area with no apparent water connections between them. We studied the relative contribution of neutral versus non-neutral evolutionary processes in shaping phenotypic divergence, by contrasting patterns of phenotypic and neutral genetic divergence across populations in relation to environmental measurements. This allowed us to model the proportion of phenotypic variance explained by the environment, taking in to account the observed neutral genetic structure.RESULTS:These populations originated from the nearby Lake Mývatn, and showed small population sizes with low genetic diversity. Phenotypic variation was mostly correlated with neutral genetic diversity with only a small environmental effect.CONCLUSIONS:Phenotypic diversity in these cave populations appears to be largely the product of neutral processes, fitting the classical evolutionary expectations. However, the fact that neutral processes did not explain fully the phenotypic patterns suggests that further studies can increase our understanding on how neutral evolutionary processes can interact with other forces of selection at early stages of divergence. The accessibility of these populations has provided the opportunity for long-term monitoring of individual fish, allowing tracking how the environment can influence phenotypic and genetic divergence for shaping and maintaining diversity in small populations. Such studies are important, especially in freshwater, as habitat alteration is commonly breaking populations into smaller units, which may or may not be viable.
In evolutionary quantitative genetics, the missing fraction problem refers to a specific kind of bias in parameters estimated later in life that occurs when nonrandom subsets of phenotypes are missing from the population due to prior viability selection on correlated traits. The missing fraction problem thus arises when the following hold: (a) viability selection and (b) correlation between later-life traits and traits important for early-life survival. Although it is plausible that these conditions are widespread in wild populations, this problem has received little empirical attention. This may be natural: the problem could appear intractable, given that it is impossible to measure phenotypes of individuals that have previously died. However, it is not impossible to correctly measure lifetime selection, or correctly predict evolutionary trajectories, of later-life traits in the presence of the missing fraction. Two basic strategies are available. First, given phenotypic data on selected early life traits, well established but underused episodes of selection theory can yield correct values of evolutionary parameters throughout life. Second, when traits subjected to early-life viability selection are not known and/or measured, it is possible to use the genetic association of later-life traits with early-life viability to correctly infer important information about the consequences of prior viability selection for later-life traits. By carefully reviewing the basic nature of the missing fraction problem, and describing the tractable solutions to the problem, we hope that future studies will be able to be better designed to cope with the (likely pervasive) consequences of early-life viability selection.
Abstract Ecologists and evolutionary biologists are regularly tasked with the comparison of binary data across groups. There is, however, some discussion in the biostatistics literature about the best methodology for the analysis of data comprising binary explanatory and response variables forming a 2 × 2 contingency table. We assess several methodologies for the analysis of 2 × 2 contingency tables using a simulation scheme of different sample sizes with outcomes evenly or unevenly distributed between groups. Specifically, we assess the commonly recommended logistic (generalised linear model [GLM]) regression analysis, the classical Pearson chi‐squared test and four conventional alternatives (Yates' correction, Fisher's exact, exact unconditional and mid‐p), as well as the widely discouraged linear model (LM) regression. We found that both LM and GLM analyses provided unbiased estimates of the difference in proportions between groups. LM and GLM analyses also provided accurate standard errors and confidence intervals when the experimental design was balanced. When the experimental design was unbalanced, sample size was small, and one of the two groups had a probability close to 1 or 0, LM analysis could substantially over‐ or under‐represent statistical uncertainty. For null hypothesis significance testing, the performance of the chi‐squared test and LM analysis were almost identical. Across all scenarios, both had high power to detect non‐null effects and reject false positives. By contrast, the GLM analysis was underpowered when using z‐based p‐values, in particular when one of the two groups had a probability near 1 or 0. The GLM using the LRT had better power to detect non‐null results. Our simulation results suggest that, wherever a chi‐squared test would be recommended, a linear regression is a suitable alternative for the analysis of 2 × 2 contingency table data. When researchers opt for more sophisticated procedures, we provide R functions to calculate the standard error of a difference between two probabilities from a Bernoulli GLM output using the delta method. We also explore approaches to compliment GLM analysis of 2 × 2 contingency tables with credible intervals on the probability scale. These additional operations should support researchers to make valid assessments of both statistical and practical significances.
When environmental variation contributes to relationships between traits and fitness, it can confound analyses of phenotypic selection and, ultimately, bias predictions of adaptive evolution. To date, discussions of how to combat this problem emphasise complex statistical analyses aimed at estimating the genetic basis of the relationship between traits and fitness (e.g., the secondary theorem of selection). This article presents a path analysisbased description of the environmental confounding problem, which clarifies the issue and motivates simpler analyses as potential solutions. We show how standard selection analyses can be expanded to explicitly include environmental variables that may confound trait-fitness relationships, potentially leading to dramatically improved predictions of the evolutionary response to selection relative to classical phenotype-based estimates. We provide both univariate and multivariate treatments of the decomposition of the selection differential into components that may cause evolution via direct and indirect selection and components representing evolutionarily inert, environmentally-induced covariance. The multivariate treatment also yields expressions for the decomposition of the selection differential based on extended selection gradients, which may be of wide general interest beyond the environmental problem. Our approach to the environmental confounding problem makes more plausible demands on data than previous, more involved, quantitative genetic approaches, and addresses the issue of environmental confounding in a more biologically informative way.
Senescence-the deterioration of functionality with age-varies widely across taxa in pattern and rate. Insights into why and how this variation occurs are hindered by the predominance of laboratory-focused research on short-lived model species with determinate growth. We synthesize evolutionary theories of senescence, highlight key information gaps and clarify predictions for species with low mortality and variable degrees of indeterminate growth. Lake trout are an ideal species to evaluate predictions in the wild. We monitored individual males from two populations (1976-2017) longitudinally for changes in adult mortality (actuarial senescence) and body condition (proxy for energy balance). A cross-sectional approach (2017) compared young (ages 4-10 years) and old (18-37 years) adults for (i) phenotypic performance in body condition, and semen quality-which is related to fertility under sperm competition (reproductive senescence)-and (ii) relative telomere length (potential proxy for cellular senescence). Adult growth in these particular populations is constrained by a simplified foodweb, and our data support predictions of negligible senescence when maximum size is only slightly larger than maturation size. Negative senescence (aka reverse senescence) may occur in other lake trout populations where diet shifts allow maximum sizes to greatly exceed maturation size.
The rate of adaptive evolution, the contribution of selection to genetic changes that increase mean fitness, is determined by the additive genetic variance in individual relative fitness. To date, there are few robust estimates of this parameter for natural populations, and it is therefore unclear whether adaptive evolution can play a meaningful role in short-term population dynamics. We developed and applied quantitative genetic methods to long-term datasets from 19 wild bird and mammal populations and found that, while estimates vary between populations, additive genetic variance in relative fitness is often substantial and, on average, twice that of previous estimates. We show that these rates of contemporary adaptive evolution can affect population dynamics and hence that natural selection has the potential to partly mitigate effects of current environmental change.
Log-linear models are widely used for assessing determinants of fitness in empirical studies, for example, in determining how reproductive output depends on trait values or environmental conditions. Similarly, theoretical works of fitness and natural selection employ log-linear models, often with a negative quadratic term, generating Gaussian fitness functions. However, in the specific application of regression-based analysis of natural selection, such models are rarely employed. Rather, OLS regression is the predominant means of assessing the form of natural selection. OLS regressions allow specific evolutionary quantitative parameters, selection gradients, to be estimated, and benefit from the fact that the associated statistical models are easily applied. We examine whether selection gradients can be directly expressed in terms of the coefficients of models using exponential fitness functions with linear or quadratic arguments. Such models can be easily fitted with generalized linear models (GLMs). The expressions we obtain coincide with those for Gaussian functions, but relax the major constraint that the (log) fitness function is concave (downwardly curved). Additionally these results lead to univariate and multivariate analyses of both linear and quadratic selection that potentially incorporate pragmatic and interpretable models of fitness functions, where the parameters can be related analytically to selection gradients, and that can be operationalized using widely available statistical tools.
The ability to re-identify individuals is fundamental to the individual-based studies that are required to estimate many important ecological and evolutionary parameters in wild populations. Traditional methods of marking individuals and tracking them through time can be invasive and imperfect, which can affect these estimates and create uncertainties for population management. Here we present a photographic re-identification method that uses spot constellations in images to match specimens through time. Photographs of Arctic charr ( Salvelinus alpinus ) were used as a case study. Classical computer vision techniques were compared with new deep-learning techniques for masks and spot extraction. We found that a U-Net approach trained on a small set of human-annotated photographs performed substantially better than a baseline feature engineering approach. For matching the spot constellations, two algorithms were adapted, and, depending on whether a fully or semi-automated set-up is preferred, we show how either one or a combination of these algorithms can be implemented. Within our case study, our pipeline both successfully identified unmarked individuals from photographs alone and re-identified individuals that had lost tags, resulting in an approximately 4% increase in our estimate of survival rate. Overall, our multi-step pipeline involves little human supervision and could be applied to many organisms.
Background Studying the development of fitness related traits in hybrids from populations diverging in sympatry is a fundamental approach to understand the processes of speciation. However, such traits are often affected by covariance structures that complicate the comprehension of these processes, especially because the interactive relationships between traits of different nature (e.g. morphology, behaviour, life-history) remain largely unknown in this context. In a common garden setup, we conducted an extensive examination of a large suit of traits putatively involved in the divergence of two morphs of Arctic charr (Salvelinus alpinus), and investigated the consequences of potential patterns of trait covariance on the phenotype of their hybrids. These traits were measured along ontogeny and involved growth, yolk sac resorption, developmental timing (hatching and the onset of exogeneous feeding), head morphology and feeding behaviour. Results Growth trajectories provided the strongest signal of phenotypic divergence between the two charr. Strikingly, the first-generation hybrids did not show intermediate nor delayed growth but were similar to the smallest morph, suggesting parental biases in the inheritance of growth patterns. However, we did not observe extensive multivariate trait differences between the two morphs and their hybrids. Growth was linked to head morphology (suggesting that morphological variations in early juveniles relate to simple allometric effects) but this was the only strong signal of covariance observed between all the measured traits. Furthermore, we did not report evidence for differences in overall phenotypic variance between morphs, nor for enhanced phenotypic variability in their hybrids. Conclusion Our study shed light on the multivariate aspect of development in a context of adaptive divergence. The lack of evidence for the integration of most traits into a single covariance structure suggested that phenotypic constraints may not always favour nor impede divergence toward ecological niches differing in numerous physical and ecological variables, as observed in the respective habitats of the two charr. Likewise, the role of hybridization as a disruptive agent of trait covariance may not necessarily be significant in the evolution of populations undergoing resource polymorphism.
The population of Soay sheep on the island of Hirta in the Outer Hebrides has been the subject of continuous study for more than 35 years. This paper focuses on the botanical aspects of the plant–herbivore interaction, showing how the vegetation affects and is affected by the sheep. Grazing impacts on biomass and spatial structure varied across plant communities, with Holcus / Agrostis grasslands affected most and Wet Heath least, consistent with the hypothesis that herbivore impacts are proportional to plant productivity. Within plant communities, the negative relationships between sheep numbers and plant abundance (sward height, gap/tussock cover and biomass) were significant in March but not significant in August, as expected if sheep numbers are limited by food supply in winter. In most species, flower stem density declined with increasing sheep numbers. There were no examples where unpalatable plants showed increased flowering (e.g. from competitor release under selective grazing). Plant production in temporary grazing exclosures (above‐ground net primary production) was greatest in Holcus / Agrostis grassland (12.6 t ha −1 dry matter year −1 ), lower in Nardus grassland (5.1 t ha −1 year −1 ) and least in Plantago sward (1.3 t ha −1 year −1 ) associated with differences in historical nutrient supply and microclimate. The net effect of grazing on plant species richness was positive: A few highly palatable species were excluded, but small‐scale coexistence of grazing‐tolerant species was enhanced by defoliation. The Soay sheep population fluctuated from 908 (in 1988) to 2,208 (in 2009), increasing by an average of 39 extra animals per year over the period 1985–2011. Between 2011 and 2020, the population fluctuated less widely and showed no trend. Population change (ln( N ( t + 1)/ N ( t ))) was inversely density dependent but positively correlated with plant production in Holcus / Agrostis grassland which increased during the study. This plant–herbivore interaction is highly resilient, and though some species ( Festuca rubra and Ranunculus acris ) declined in the Holcus / Agrostis grassland, there was no significant upward trend in the abundance of unpalatable plant species. Synthesis . Implications for future studies and analyses of plant–herbivore data. Concentrating on estimating primary productivity and herbivore offtake, rather than simply measuring change in plant biomass, is likely to provide greatly improved explanatory power for understanding herbivore population dynamics.
We review the concepts of correlation and repeatability, as they are key components to studies of consistent individual differences in behaviour, commonly termed personality. These two concepts are widely used in an interchangeable way, which is sensible when studying consistency of behaviour within a single context. However, their quantitative values and qualitative meaning can diverge greatly when they are applied to understanding consistency of behaviour across contexts. Some scenarios exist where one is defined, and the other is not. Importantly, in scenarios where they are both defined, they need not be of the same sign. We provide an explicit mathematical analysis of the two concepts to disambiguate their meanings. Finally, we use an explicit, but simple, mathematical analysis to address the meaning of negative correlations across contexts, an issue that has been widely and conspicuously avoided to date in discussions of behavioural correlations. We hope that our mathematical investigation of the different aspects of consistent individual differences in behaviour encapsulated by correlations and repeatabilities can facilitate the application of these quantities in empirical studies of animal personality. (c) 2021 The Association for the Study of Animal Behaviour. Published by Elsevier Ltd. All rights reserved.
A recent article in Evolutionary Applications by LaSharr et al. reports on trends in the size of horns of bighorn sheep (Ovis canadensis) throughout much of the species' range. The article concludes that there are "... stable or increasing trends in horn growth over nearly 3 decades in the majority of hunt areas throughout the western U.S. and Canada." However, the article equates nonsignificance of predominantly negative trends in the areas with the most selective harvest as evidence for the null hypothesis of no trends and also fails to consider well-known and serious biases in the use of data collected in size-regulated hunts. By applying meta-analysis to the estimates reported by LaSharr et al., we show that there has been a pervasive overall trend of declining horn sizes in Alberta, where the combination of horn size-based legality, combined with unrestricted hunter numbers are understood to generate the greatest selective pressures. Given the nature of the biases in the underlying data, the magnitudes of the trends resulting from our re-analysis of LaSharr et al.'s (Evolutionary Applications, 2019, 12, 1823) trend estimates are probably underestimated.
Many biological traits covary with body size, resulting in an allometric relationship. Identifying the evolutionary drivers of these traits is complicated by possible relationships between a candidate selective agent and body size itself, motivating the widespread use of multiple regression analysis. However, the possibility that multiple regression may generate misleading estimates when predictor variables are correlated has recently received much attention. Here, we argue that a primary source of such bias is the failure to account for the complex causal structures underlying brains, bodies, and agents. When brains and bodies are expected to evolve in a correlated manner over and above the effects of specific agents of selection, neither simple nor multiple regression will identify the true causal effect of an agent on brain size. This problem results from the inclusion of a predictor variable in a regression analysis that is (in part) a consequence of the response variable. We demonstrate these biases with examples and derive estimators to identify causal relationships when traits evolve as a function of an existing allometry. Model mis-specification relative to plausible causal structures, not collinearity, requires further consideration as an important source of bias in comparative analyses.
 Loeske Kruuk合作论文数School of Biological Sciences, University of Edinburgh14
 Josephine Pemberton合作论文数School of Biological Sciences,University of Edinburgh13
 Alastair Wilson合作论文数Centre for Ecology and Conservation, University of Exeter’s Cornwall Campus8
 Adam M. Siepielski合作论文数Department of Biology, University of San Diego;Department of Biology, University of San Diego7
 de Villemereuil Pierre合作论文数UMR 5553, Université Grenoble Alpes Saint Martin d'Hères France7
 Moira Ferguson合作论文数Department of Integrative Biology, University of Guelph7
 Ben Sheldon合作论文数Edward Grey Institute, Department of Biology, University of Oxford6
 Elizabeth A Mittell合作论文数5
 Camille A.-L. Leblanc合作论文数Dept Aquaculture & Fish Biol, Holar Univ5
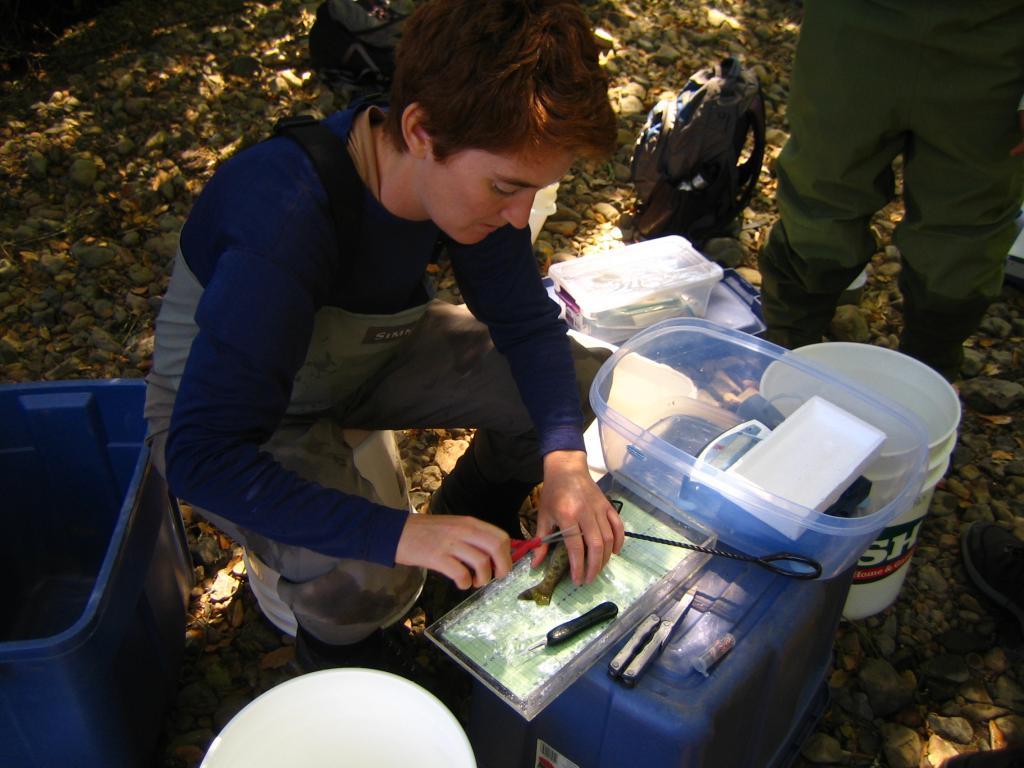 Stephanie M. Carlson合作论文数Department of Environmental Science, Policy and Management, College of Natural Resources, University of California, Berkeley5
 Kiyoko Gotanda合作论文数Redpath Museum and Department of Biology, McGill University5
 Joel Kingsolver合作论文数Department of Biology, College of Arts and Sciences, The University of North Carolina at Chapel Hill;National Evolutionary Synthesis Center5
 Kapralova Kalina H合作论文数Institute of Life- and Environmental Sciences, University of Iceland5
 Jill G. Pilkington合作论文数5
 Tim Clutton-Brock合作论文数Department of Zoology, University of Cambridge5
 Maria João Janeiro合作论文数Auburn Univ4
 Quentin J.B. Horta-Lacueva合作论文数Inst Life & Environm Sci, Univ Iceland4
 Ryan Martin合作论文数Department of Mathematics, Statistics, and Computer Science, University of Illinois at Chicago4
 Walling Craig A合作论文数Institute of Evolutionary Biology, School of Biological Sciences, University of Edinburgh, Edinburgh, UK. craig.walling@ed.ac.uk4
 Timothee Bonnet合作论文数4
 Augustine Kate E合作论文数Department of Biology, University of North Carolina4
 Marco Festa Bianchet合作论文数Departement De Biologie, Universite De Sherbrooke4
 Michael J. Wade合作论文数Department of Biology, The College of Arts & Sciences, Indiana University Bloomington4
 Eugene I. Shakhnovich合作论文数Department of Chemistry and Chemical Biology, Faculty of Arts and Sciences, Harvard University4
 Sigurður S. Snorrason合作论文数Univ Iceland4
 Bjarni Kristofer Kristjansson合作论文数Hólar University College4
 Holger Schielzeth合作论文数Institute for Ornithology4
 Dick James合作论文数Department of Physics, University of Bath;Centre for Networks and Collective Behaviour, University of Bath4
 Clinton David Francis合作论文数Department of Ecology and Evolutionary Biology, University of Colorado4
 Nina Sletvold合作论文数Museum of Natural History and Archaeology, NTNU4
 Shinichi Nakagawa合作论文数Department of Biological Sciences, Faculty of Science, University of Alberta4
 Christina M. Caruso合作论文数Department of Biology, Grinnell College4
 Christian Rutz合作论文数Department of Zoology;University of Oxford;Department of Zoology, University of Oxford4
 Joseph Di Battista合作论文数School of Environment and Science, McGill University4James J. H. St Clair合作论文数4
 Andrew MacColl合作论文数Centre for the Environment, Faculty of Science, The University of Nottingham3
 Brian Otis合作论文数Verily3
 Burns Zackory T合作论文数Department of Zoology, University of Oxford3
 Tim Coulson合作论文数Department of Biology, University of Oxford3
 Jonathan Henshaw合作论文数Research School of Biology, Australian National University3
 Jon Slate合作论文数School of Biosciences, University of Sheffield3
 Graeme Douglas Ruxton合作论文数School of Biology, University of St Andrews;Institute of Behavioural and Neural Sciences, University of St Andrews;Centre for Biological Diversity, University of St Andrews3
 E. Postma合作论文数Wageningen University;Department of Environmental Sciences;Tropical Nature Conservation and Vertebrate Ecology Group;Tropical Nature Conservation and Vertebrate Ecology Group, Wageningen University3
 Mathieu Buoro合作论文数3Bruce L. Tufts合作论文数3
 Erik Svensson合作论文数Department of Biology, Lund University3
 Sonya Clegg合作论文数Department of Biology, University of Oxford;Department of Zoology, University of Oxford3Joe Hereford合作论文数3
 Miguel Barbosa合作论文数Unidade de Investigac;Instituto Superior de Psicologia Aplicada;Unidade de Investigac, Instituto Superior de Psicologia Aplicada3




