The rapid accumulation of biological network data is creating an urgent need for computational methods capable of integrative network analysis. This paper discusses a suite of algorithms that we have developed to discover biologically significant patterns that appear frequently in multiple biological networks: coherent dense subgraphs, frequent dense vertex-sets, generic frequent subgraphs, differential subgraphs, and recurrent heavy subgraphs. We demonstrate these methods on gene co- expression networks, using the identified patterns to systematically annotate gene functions, map genome to phenome, and perform high-order cooperativity analysis.
The rapid accumulation of biological network data is creating an urgent need for computational methods on integrative network analysis. Thus far, most such methods focused on the analysis of single biological networks. This chapter discusses a suite of methods we developed to mine patterns across many biological networks. Such patterns include frequent dense subgraphs, frequent dense vertex sets, generic frequent patterns, and differential subgraph patterns. Using the identified network patterns, we systematically perform gene functional annotation, regulatory network reconstruction, and genome to phenome mapping. Finally, tensor computation of multiple weighted biological networks, which filled a gap of integrative network biology, is discussed.
Background Complex human diseases are often caused by multiple mutations, each of which contributes only a minor effect to the disease phenotype. To study the basis for these complex phenotypes, we developed a network-based approach to identify coexpression modules specifically activated in particular phenotypes. We integrated these modules, protein-protein interaction data, Gene Ontology annotations, and our database of gene-phenotype associations derived from literature to predict novel human gene-phenotype associations. Our systematic predictions provide us with the opportunity to perform a global analysis of human gene pleiotropy and its underlying regulatory mechanisms. Results We applied this method to 338 microarray datasets, covering 178 phenotype classes, and identified 193,145 phenotype-specific coexpression modules. We trained random forest classifiers for each phenotype and predicted a total of 6,558 gene-phenotype associations. We showed that 40.9% genes are pleiotropic, highlighting that pleiotropy is more prevalent than previously expected. We collected 77 ChIP-chip datasets studying 69 transcription factors binding over 16,000 targets under various phenotypic conditions. Utilizing this unique data source, we confirmed that dynamic transcriptional regulation is an important force driving the formation of phenotype specific gene modules. Conclusion We created a genome-wide gene to phenotype mapping that has many potential implications, including providing potential new drug targets and uncovering the basis for human disease phenotypes. Our analysis of these phenotype-specific coexpression modules reveals a high prevalence of gene pleiotropy, and suggests that phenotype-specific transcription factor binding may contribute to phenotypic diversity. All resources from our study are made freely available on our online Phenotype Prediction Database [1].
About 85% of the maize genome consists of highly repetitive sequences that are interspersed by low-copy, gene-coding sequences. The maize community has dealt with this genomic complexity by the construction of an integrated genetic and physical map (iMap), but this resource alone was not sufficient for ensuring the quality of the current sequence build. For this purpose, we constructed a genome-wide, high-resolution optical map of the maize inbred line B73 genome containing >91,000 restriction sites (averaging 1 site/ approximately 23 kb) accrued from mapping genomic DNA molecules. Our optical map comprises 66 contigs, averaging 31.88 Mb in size and spanning 91.5% (2,103.93 Mb/ approximately 2,300 Mb) of the maize genome. A new algorithm was created that considered both optical map and unfinished BAC sequence data for placing 60/66 (2,032.42 Mb) optical map contigs onto the maize iMap. The alignment of optical maps against numerous data sources yielded comprehensive results that proved revealing and productive. For example, gaps were uncovered and characterized within the iMap, the FPC (fingerprinted contigs) map, and the chromosome-wide pseudomolecules. Such alignments also suggested amended placements of FPC contigs on the maize genetic map and proactively guided the assembly of chromosome-wide pseudomolecules, especially within complex genomic regions. Lastly, we think that the full integration of B73 optical maps with the maize iMap would greatly facilitate maize sequence finishing efforts that would make it a valuable reference for comparative studies among cereals, or other maize inbred lines and cultivars.
Phenotypes are complex, and difficult to quantify in a high-throughput fashion. The lack of comprehensive phenotype data can prevent or distort genotype–phenotype mapping. Here, we describe “PhenoProfiler,” a computational method that enables in silico phenotype profiling. Drawing on the principle that similar gene expression patterns are likely to be associated with similar phenotype patterns, PhenoProfiler supplements the missing quantitative phenotype information for a given microarray dataset based on other well-characterized microarray datasets. We applied our method to 587 human microarray datasets covering >14,000 samples, and confirmed that the predicted phenotype profiles are highly consistent with true phenotype descriptions. PhenoProfiler offers several unique capabilities: (i) automated, multidimensional phenotype profiling, facilitating the analysis and treatment design of complex diseases; (ii) the extrapolation of phenotype profiles beyond provided classes; and (iii) the detection of confounding phenotype factors that could otherwise bias biological inferences. Finally, because no direct comparisons are made between gene expression values from different datasets, the method can use the entire body of cross-platform microarray data. This work has produced a compendium of phenotype profiles for the National Center for Biotechnology Information GEO datasets, which can facilitate an unbiased understanding of the transcriptome-phenome mapping. The continued accumulation of microarray data will further increase the power of PhenoProfiler, by increasing the variety and the quality of phenotypes to be profiled.
Although many studies have been successful in the discovery of cooperating groups of genes, mapping these groups to phenotypes has proved a much more challenging task. In this paper, we present the first genome-wide mapping of gene coexpression modules onto the phenome. We annotated coexpression networks from 136 microarray datasets with phenotypes from the Unified Medical Language System (UMLS). We then designed an efficient graph-based simulated annealing approach to identify coexpression modules frequently and specifically occurring in datasets related to individual phenotypes. By requiring phenotypespecific recurrence, we ensure the robustness of our findings. We discovered 9,183 modules specific to 47 phenotypes, and developed validation tests combining Gene Ontology, GeneRIF and UMLS. Our method is generally applicable to any kind of abundant network data with defined phenotype association, and thus paves the way for genome-wide, gene network-phenotype maps.
MOTIVATION A major challenge in studying gene regulation is to systematically reconstruct transcription regulatory modules, which are defined as sets of genes that are regulated by a common set of transcription factors. A commonly used approach for transcription module reconstruction is to derive coexpression clusters from a microarray dataset. However, such results often contain false positives because genes from many transcription modules may be simultaneously perturbed upon a given type of conditions. In this study, we propose and validate that genes, which form a coexpression cluster in multiple microarray datasets across diverse conditions, are more likely to form a transcription module. However, identifying genes coexpressed in a subset of many microarray datasets is not a trivial computational problem. RESULTS We propose a graph-based data-mining approach to efficiently and systematically identify frequent coexpression clusters. Given m microarray datasets, we model each microarray dataset as a coexpression graph, and search for vertex sets which are frequently densely connected across [theta m] datasets (0 < or = theta < or = 1). For this novel graph-mining problem, we designed two techniques to narrow down the search space: (1) partition the input graphs into (overlapping) groups sharing common properties; (2) summarize the vertex neighbor information from the partitioned datasets onto the 'Neighbor Association Summary Graph's for effective mining. We applied our method to 105 human microarray datasets, and identified a large number of potential transcription modules, activated under different subsets of conditions. Validation by ChIP-chip data demonstrated that the likelihood of a coexpression cluster being a transcription module increases significantly with its recurrence. Our method opens a new way to exploit the vast amount of existing microarray data accumulation for gene regulation study. Furthermore, the algorithm is applicable to other biological networks for approximate network module mining. AVAILABILITY http://zhoulab.usc.edu/NeMo/.
The recent development of microarray technology provided unprecedented opportunities to understand the genetic basis of aging. So far, many microarray studies have addressed aging-related expression patterns in multiple organisms and under different conditions. The number of relevant studies continues to increase rapidly. However, efficient exploitation of these vast data is frustrated by the lack of an integrated data mining platform or other unifying bioinformatic resource to enable convenient cross-laboratory searches of array signals. To facilitate the integrative analysis of microarray data on aging, we developed a web database and analysis platform ‘Gene Aging Nexus’ (GAN) that is freely accessible to the research community to query/analyze/visualize cross-platform and cross-species microarray data on aging. By providing the possibility of integrative microarray analysis, GAN should be useful in building the systems-biology understanding of aging. GAN is accessible at .
 Xianghong Jasmine Zhou合作论文数Department of Pathology and Laboratory Medicine, David Geffen School of Medicine, University of California, Los Angeles;EarlyDiagnostics8
 Juan Nunez-Iglesias合作论文数Howard Hughes Medical Institute6
 Michael Waterman合作论文数Dana and David Dornsife College of Letters, Arts and Sciences, University of Southern California;University of Virginia5
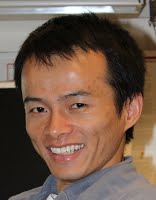 Yu S. Huang (黄宇)合作论文数The National Center for Drug Screening4
 Xifeng Yan合作论文数Department of Computer Science, University of California at Santa Barbara4
 Haiyan Hu (胡海燕)合作论文数Shanghai Sixth People's Hospital3
 Min Xu (徐旻)合作论文数Computational Biology Department, School of Computer Science, Carnegie Mellon University;Mohamed bin Zayed University of Artificial Intelligence3
 Haifeng Li合作论文数Equinix3
 Vincent Li合作论文数Facebook2
 Wenyuan Li合作论文数1
 Steve Goldstein合作论文数1Fusheng Wei合作论文数1Min Xu合作论文数1Fei Pan合作论文数1
 Roger P Wise合作论文数Department of Plant Pathology and Microbiology, College of Agriculture and Life Sciences, Iowa State University1
 Rod A. Wing合作论文数Division of Biological and Environmental Science and Engineering, King Abdullah University of Science and Technology;Center for Desert Agriculture, King Abdullah University of Science and Technology1
 John Nguyen合作论文数1David C. Schwartz合作论文数1K Zhang合作论文数1
 Mrinal Kalakrishnan合作论文数Meta1
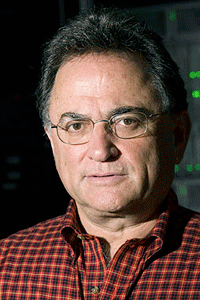 Miron Livny合作论文数Department of Computer Sciences, School of Computer, Data & Information Sciences, University of Wisconsin-Madison;Wisconsin Institute for Discovery, University of Wisconsin-Madison1
 Philip S. Yu (俞士綸)合作论文数Department of Computer Science, College of Engineering, University of Illinois Chicago;Big Data and Social Computing Lab, University of Illinois Chicago1Sudip Pulapura合作论文数1
 Chao Dai合作论文数College of Life Sciences, Wuhan University1Chi-Hsien Chiu合作论文数1Konstantinos D. Potamousis合作论文数1Chris Churas合作论文数1
 Doreen Ware合作论文数Cold Spring Harbor Laboratory1Shiran Pasternak合作论文数Human Genome Sequencing Center, Baylor College of Medicine1Shiguo Zhou (周诗国)合作论文数Department of Mathematics, Zhengzhou University1
 Kiran Kamath合作论文数Department of Civil Engineering, MIT1L Pape合作论文数1
 Caleb Finch合作论文数Leonard Davis School of Gerontology, University of Southern California1
 Gareth M. James合作论文数School of Business, Marshall;University of Southern California;Marshall School of Business, University of Southern California1Mike Bechner合作论文数1




