Predicting maritime incidents requires spatially aware techniques that account for complex geographic and operational dynamics. By applying Geographic Weighted Regression (GWR), Generalized Linear Regression (GLR), Forest-Based Classification and Regression (FBCR), and Empirical Bayesian Kriging (EBK), this research models the spatial distribution of vessel incidents across the Caribbean Sea. Key influencing variables include vessel traffic density, charted zone confidence, flag state, and vessel age. Results highlight regional hotspots such as the Panama Canal and Gulf of Paria. Comparative analysis demonstrates the strengths and limitations of each technique, informing the development of adaptive, location-specific maritime risk mitigation strategies.
Maritime accidents remain a critical concern despite advancements in navigation technology and safety regulations. This paper examines maritime events over a 20-year period (2002–2021) using geostatistical analysis and GIS-based methods to identify key risk factors, trends, and high-risk zones. Analysis of the IMO’s Global Integrated Shipping Information System (GISIS) database highlights the influence of vessel type, flag state performance, accident timing, and geographical hotspots on incident frequency. Collisions, groundings, and fires/explosions are the most prevalent events, with aged vessels, open registries and outdated or incomplete hydrographic survey data posing significant risks. Poor flag state oversight, economic constraints, and human factors exacerbate maritime hazards. Although accident rates have declined, high-risk zones persist, necessitating stricter regulatory enforcement, fleet modernization, and improved accident reporting. Strengthening international collaboration and proactive risk management is crucial for ensuring safer global shipping operations, particularly in high-risk regions like the Caribbean Sea.
The Caribbean Sea, a vital maritime corridor with high vessel traffic and strategic access to the Panama Canal, faces growing navigational risks. This study develops a probabilistic risk assessment model incorporating vessel and environmental conditions, enhanced by an Artificial Neural Network to estimate incident probability. By leveraging Automatic Identification System (AIS) data and machine learning, mitigation scenarios were evaluated, confirming their effectiveness in reducing risk. The methodology advances traditional models by integrating multiple cause-related factors, offering a more comprehensive understanding of maritime safety. This research highlights the value of AIS and AI-driven approaches in enhancing risk mitigation and navigational resilience in the Caribbean Sea.
Due to the needs of modern society, cadastral systems should be designed to support three dimensional (3D) spatial data. One of many possible approaches for implementing a 3D cadastre, in countries such as Croatia, is to establish a Building Register as a transitional register between 2D and 3D cadastres, where data about buildings and infrastructure would be collected, gradually adapted to the data model of 3D cadastre, and finally migrated to the 3D cadastre database. Sources for establishing the Building Register can be based on the records of state surveys, the register of administrative units, the land book, data managed by local and regional self-government units, data from construction documentation according to special regulations in the field of spatial planning, data managed by the building and infrastructure managers, as well as from other sources. A significant element of the 3D cadastre would be the inclusion of representations of buildings and units of use, as well as public utility infrastructure and complex spatial real-life entities (e.g., bridges, tunnels, overpasses, underpasses, overlapping of constructed objects with natural facilities, large shopping malls with more underground and overhead floors etc.). This paper presents a conceptual model of a 3D cadastre in Croatia by establishing the Building Register with focus on unit of use of real properties, namely apartments and office spaces. The paper also summarizes the current situation regarding the Croatian Land Administration System (LAS) and proposes a conceptual model for modelling unit of use of real properties. Additionally, a proposal is made herein to assign unique identifiers to buildings and their parts in a logical manner which would be intuitive and clear to citizens of Croatia, citizens of European Union and citizens of Croatia neighboring countries. The proposed methodology of determining unique identifiers could provide the means for easier navigation in 3D space and better understanding of spatial information by lay citizens, by institutions or emergency services.
Although previous studies have acknowledged the potential of geographic information systems (GIS) and social media data (SMD) in assessment of exposure to various environmental risks, none has presented a simple, effective and user-friendly tool. This study introduces a conceptual model that integrates individual mobility patterns extracted from social media, with the geographic footprints of infectious diseases and other environmental agents utilizing GIS. The efficacy of the model was independently evaluated for selected case studies involving lead in the ground; particulate matter in the air; and an infectious, viral disease (COVID- 19). A graphical user interface (GUI) was developed as the final output of this study. Overall, the evaluation of the model demonstrated feasibility in successfully extracting individual mobility patterns, identifying potential exposure sites and quantifying the frequency and magnitude of exposure. Importantly, the novelty of the developed model lies not merely in its efficiency in integrating GIS and SMD for exposure assessment, but also in considering the practical requirements of health practitioners. Although the conceptual model, developed together with its associated GUI, presents a promising and practical approach to assessment of the exposure to environmental risks discussed here, its applicability, versatility and efficacy extends beyond the case studies presented in this study.
The deep sea (below 200 m depth) is the largest carbon sink on Earth. It hosts abundant biodiversity that underpins the carbon cycle and provides provisioning, supporting, regulating and cultural ecosystem services. There is growing attention to climate-regulating ocean ecosystem services from the scientific, business and political sectors. In this essay we synthesize the unique biophysical, socioeconomic and governance characteristics of the deep sea to critically assess opportunities for deep-sea blue carbon to mitigate climate change. Deep-sea blue carbon consists of carbon fluxes and storage including carbon transferred from the atmosphere by the inorganic and organic carbon pumps to deep water, carbon sequestered in the skeletons and bodies of deep-sea organisms, carbon buried within sediments or captured in carbonate rock. However, mitigating climate change through deep-sea blue carbon enhancement suffers from lack of scientific knowledge and verification, technological limitations, potential environmental impacts, a lack of cooperation and collaboration, and underdeveloped governance. Together, these issues suggest that deep-sea climate change mitigation is limited. Thus, we suggest that a strong focus on blue carbon is too limited a framework for managing the deep sea to contribute to international goals, including the Sustainable Development Goals (SDGs), the Paris Agreement and the post-2020 Biodiversity Goals. Instead, the deep sea can be viewed as a more holistic nature-based solution, including many ecosystem services and biodiversity in addition to climate. Environmental impact assessments (EIAs), area-based management, pollution reduction, moratoria, carbon accounting and fisheries management are tools in international treaties that could help realize benefits from deep-sea, nature-based solutions.
Abstract Many countries have seen a significant increase in the number of high-rise and multi-story buildings with strata units with the shrinking availability of horizontal land space in urban areas. Most existing cadastres record tenure and associated information in a two-dimensional format, and therefore will need to be upgraded to 3D cadastres to facilitate the recording of title information for these strata units. The geospatial aspects of implementing a 3D cadastre require cost-effective, rapid, accessible, non-labor intensive, and accurate means by which complete data may be collected to model strata units. Existing data sources such as Building Information Models (BIMs) have been used to delineate these units. However, BIMs are not easily accessible in developing countries. There is no single spatial data source that can easily fulfill all the criteria of a 3D data source for mapping urban strata boundaries. However, leveraging multi-perspective and multi-sensor data can theoretically serve this purpose. In this paper, we report on research conducted to demonstrate the feasibility of using low cost and accessible cell phone data, integrated with higher accuracy terrestrial laser scan data, and drone aerial imagery to produce a multi-perspective 3D data source. It was found that the integration of these data sets as a 3D data source, resulted in absolute accuracies within centimetres and decimetres in the horizontal plane and within millimetres in the vertical plane. Overall, the integration of these three sources of data may be appropriate in meeting the needs for a low-cost source of 3D data.
The National Oceanic and Atmospheric Administration (NOAA) National Centers for Environmental Information (NCEI) generates digital elevation models (DEMs) that range from the local to global scale. Collectively, these DEMs are essential to determining the timing and extent of coastal inundation and improving community preparedness, event forecasting, and warning systems. We initiated a comprehensive framework at NCEI, the Continuously Updated DEM (CUDEM) Program, with seamless bare-earth, topographic-bathymetric and bathymetric DEMs for the entire United States (U.S.) Atlantic and Gulf of Mexico Coasts, Hawaii, American Territories, and portions of the U.S. Pacific Coast. The CUDEMs are currently the highest-resolution, seamless depiction of the entire U.S. Atlantic and Gulf Coasts in the public domain; coastal topographic-bathymetric DEMs have a spatial resolution of 1/9th arc-second (~3 m) and offshore bathymetric DEMs coarsen to 1/3rd arc-second (~10 m). We independently validate the land portions of the CUDEMs with NASA’s Advanced Topographic Laser Altimeter System (ATLAS) instrument on board the Ice, Cloud, and land Elevation Satellite-2 (ICESat-2) observatory and calculate a corresponding vertical mean bias error of 0.12 m ± 0.75 m at one standard deviation, with an overall RMSE of 0.76 m. We generate the CUDEMs through a standardized process using free and open-source software (FOSS) and provide open-access to our code repository. The CUDEM framework consists of systematic tiled geographic extents, spatial resolutions, and horizontal and vertical datums to facilitate rapid updates of targeted areas with new data collections, especially post-storm and tsunami events. The CUDEM framework also enables the rapid incorporation of high-resolution data collections ingested into local-scale DEMs into NOAA NCEI’s suite of regional and global DEMs. Future research efforts will focus on the generation of additional data products, such as spatially explicit vertical error estimations and morphologic change calculations, to enhance the utility and scientific benefits of the CUDEM Program.
Intense rainfall events characterise the humid tropical small island developing states (HuT-SIDS). Therefore, appropriate computation of rainfall erosivity is essential in predicting soil loss in the face of climate change. The rainfall erosivity index is calculated using kinetic energy and rainfall intensity of individual storm events requiring data that are often unavailable in HuT-SIDS. The objectives of our study were: (i) to investigate event-based rainfall erosivity using two erosive rainfall indices; and (ii) to create iso-erodent lines using Global Precipitation Measurement Integrated Multi-satellite Retrievals (GPM IMERG). We developed a Storm Event Tool (SE-TOOL) in the ArcGIS environment using Python scripts to automate the processing of sub-hourly precipitation data. The methodological approach integrated Python Scripts, Model Builder, geostatistical analytics and GPM IMERG data to calculate the erosivity indices, offering a novel approach to soil loss modelling. The results showed that the mean EI30 index, the product of total storm kinetic energy (E) and its maximum continuous 30-min intensity (I-30), was 5080 MJ-mm-/ha-h. The Kinetic Energy greater than 25 mm (KE >25) index, recorded a mean erosivity of 1928 MJ/ha. The difference between the GPM IMERG and the Automated Weather Station was not significant (t (30) = 2.07; p < 0.05, 0.67). EI30 was determined to be the more appropriate erosivity index for predicting soil loss in the HuT-SIDS. The integration of higher temporal and spatial resolution data and including all storm events above the 0 mm threshold, increased the model accuracy, providing baseline data for soil erosion risk assessment.
The present study assesses spatio-temporal rainfall variability of the most highlands to the coastal zones, comprising of eight provinces, of PNG. The variability investigation was carried out over for a period of 50 years starting from the year 1968 to 2018. After testing and checking for serial autocorrelation in the data series, Mann-Kendal non-parametric statistical evaluation was carried out to investigate rainfall trends and variability. Sen’s method was also used to investigate the magnitude of change in millimeters (mm) per year. Furthermore, the ArcGIS spatial analysis tools were used for the calculation of mean rainfall and to carry out spatial investigation. The assessments were carried out on an annual and seasonal basis within each designated study zone. CRU TS 4.03 gridded rainfall data on a 0.50 x 0.50 spatial resolution was used as an input data for trend as well as variability investigation. The CRU gridded station wise analysis was carried out to understand the variability at each specific location. From the assessments, it was found out that a higher rainfall is observed in the Eastern parts of Morobe, Southern Highlands region and central to northern part of Madang Province, while a low rainfall was observed in Goroka, the Western part of Morobe, Simbu, Western Highlands, Jiwaka and Enga province. From the trend investigation, it was observed that more grid stations show an increasing trend than a decreasing trend. On annual assessments, the significant decreasing trend is observed in the Enga and SH province, while significantly increasing trend is observed in the whole parts of Madang, and to the northern part of EH and Simbu Province. From overall assessments, it was found out that, there has been an increasing trend since 1968 up to the present.
The potential for Blue Carbon ecosystems to combat climate change and provide co-benefits was discussed in the recent and influential Intergovernmental Panel on Climate Change Special Report on the Ocean and Cryosphere in a Changing Climate. In terms of Blue Carbon, the report mainly focused on coastal wetlands and did not address the socio-economic considerations of using natural ocean systems to reduce the risks of climate disruption. In this paper, we discuss Blue Carbon resources in coastal, open-ocean and deep-sea ecosystems and highlight the benefits of measures such as restoration and creation as well as conservation and protection in helping to unleash their potential for mitigating climate change risks. We also highlight the challenges—such as valuation and governance—to marshaling their mitigation role and discuss the need for policy action for natural capital market development, and for global coordination. Efforts to identify and resolve these challenges could both maintain and harness the potential for these natural ocean systems to store carbon and help fight climate change. Conserving, protecting, and restoring Blue Carbon ecosystems should become an integral part of mitigation and carbon stock conservation plans at the local, national and global levels.
Much of 3D cadastre research and development targets high valued urban land, including condominiums, apartment buildings, and office complexes. The value of the land and the economic activity generated from transactions in this urban space potentially support the cost and time spent on establishing and maintaining a 3D cadastre. Methods for data acquisition and for construction and maintenance of the 3D cadastre are also simpler in the regular and formally planned and surveyed structures of the high value urban environment. Low-income, urban areas of informal tenure and informal development, however, also need and can benefit from a land administration system supported by a 3D cadastre but are neglected in the 3D cadastre research. Mechanisms are required for quick and cost effective construction of a 3D cadastre in this type of area to support land management and regularisation procedures, and to provide security of tenure. Light Detection and Ranging (LiDAR) is one technology that may be examined to differentiate structures in densely occupied environments where limited information and limited resources must be able to be used for managing the land and also protecting informal rights. This paper initially posits the need for 3D cadastres in low-income but densely structured urban settlements. It then tests the ability of an existing LiDAR dataset together with orthoimagery, derived to be low cost so therefore having limited specifications, for capturing sufficient definition of 3D occupation in the low-income, densely structured case study area of Laventille in Trinidad and Tobago. The difficulties of manually or automatically discriminating between close and overlapping structures and boundaries are highlighted and it is found that there is still a need for adjudication and verification of boundaries on the ground, even when physical features can be discerned from the software.
Soil erosion is a complex process involving multiple factors that contribute to the amount of soil loss. The amount of vegetation cover is one of the main factors used to estimate soil loss and is an important risk factor in informing land use management and soil conservation policies. Cover/crop management (C-factor) is a dynamic soil loss factor and analysing C-factor trends in the context of both space and time, to build a multi-dimensional data structure, increased the value of the trend analysis. The objectives of the study were to (1) utilise EVI dependent static and dynamic predictive equations to compute the C-factor, and (2) to investigate the spatio-temporal changes of the C-factor and hotspots in a tropical small island developing state (SIDS) from 2010 to 2019. ArcGIS Model Builder was utilised to automate the computation of the C-factor using Moderate Resolution Imaging Spectroradiometer (MODIS) Enhanced Vegetation Index (EVI) data and compute the ordinary least square regression. Spatio-temporal analysis was performed using the novel emerging hot spot analysis in ArcGIS to identify statistically significant hot and cold spot trends of cover management to locate new, intensifying, persistent, or sporadic hot spot patterns at different time-step intervals. The regression output for the C-factor and EVI values indicated a strong r 2 , explaining on average 90% of the models. There was no statistically significant ( P value > 0.05) increase in C-factor trend over a 10 year period (2010–2019, P - value = 0.92), a 5 year period (2015–2019; P - value = 0.59), or a 3 year period (2017–2019; P -Value = 0.31). Our results showed that intensifying hot spots (27%) were concentrated along the north–south corridor of the study area, highlighting areas with a statistically significant increase of the C-factor, thus a reduction in vegetation cover over the study period. Integrating spatio-temporal data and spatial technology provided vital cover management estimates for soil practitioners and farmers to guide conservation strategies.
Vertical separation models are valuable for coastal zone management and protection against the effects of climate change. To date, the development of such models has been undertaken in areas where long-term sea level measurements exist and there are resources for extensive offshore bathymetric and Global Navigation Satellite Systems surveys. Many small island developing states and other resource constrained territories host vulnerable coastal zones and would benefit from such models, however, financial constraints and data sparsity make it difficult. This article describes the establishment of a vertical separation model using an amalgamation of long- and short-term sea level measurements with hydrodynamic modeling. With existing vertical separations at only two coastal points for comparison, the model was designed to include a tidal prediction element which allowed for validation against sparse independently observed sea levels. Considering that unmodeled influences on sea levels in the study area can exceed 0.2 m at times, the method was tested against independently observed sea levels and can be considered successful with variances in the range of 1.3-4.5% of the average tidal range for the study area. This research provides the means of addressing a significant need in developing territories where long-term sea level records are unavailable and resource deficiencies exist.
In this paper, we use the concept of documentality to explore the role of documentation of land tenure in the livelihood resilience of farmers in Trinidad and Tobago. We studied small-scale farmers whose livelihoods occur on lands held under different tenure arrangements. We found that it is not the access to land but the formal documentation of access to land that enables livelihood resilience. Not having tenure documentation excludes farmers from loans and state incentives for agriculture. This weakens the buffer capacity of the affected farmers, which is a contributor to livelihood resilience.
Sea-level rise is one effect of both climate change and the subsidence of landmasses. Due to the economic importance of coastal activities in the region, the Caribbean would be greatly affected by ...
Load frequency control (LFC) continues to be a major problem in multi-area power systems, which is compounded by communication network issues and parametric uncertainties, that degrade controller performance. In this contribution, a fuzzy $H_\infty$-iterative learning controller (FILC) is designed for decentralized LFC with little knowledge of the local power area's model and no knowledge of the external power areas’ models. Further to this, time-varying communication delays, parametric variations, large disturbances, and non-identical power system area parameters are considered. The FILC strategy comprises a fuzzy strategy that quickly rejects large disturbances and drives the error to a designed tolerable band where an iterative learning control technique that is proven to be asymptotically stable with a prescribed $H_\infty$ performance achieves zero-error convergence. The proposed FILC is compared with that of the well-known PI algorithm for a three-area power system. Results indicate that the FILC performs significantly better than the PI controller under practical combinations of network problems, overlapping large disturbances in multiple areas and parameter variations.
From the ordinary high water to the edge of the continental shelf Canada’s marine territories are a mosaic of jurisdictional, administrative, and property boundaries. Most are defined only in law a...
Using two dimensional continuous wavelet transforms, a novel method for identification of mesoscale eddies is presented to facilitate extraction of characteristics for area, amplitude, type, and location from maps of sea level anomalies. In comparison with the previously established growing method for eddy identification, it is found that the wavelet method identifies more than twice the number of eddies and is particularly better at resolving small eddies down to the 0.25 degree resolution of the data. Such research into eddy identification and tracking is significant to the assessment of eddies with potential to impact on coastlines of small islands. The method is applied to the identification of eddies on tracks towards islands of the Eastern Caribbean over 23 years. Spatial and temporal variation in rate of occurrence and magnitude is established. For Barbados there is an average of 9 anticyclonic incidents a year with maximum amplitude of typically 0.22 m in the dry seasons and 0.16 m in the wet seasons. Seasonal variation is reversed for the other islands with twice the number of anticyclonic incidents having maximum amplitudes of about 0.20 m annually.
 Charisse Griffith-Charles合作论文数5
 Dexter Davis合作论文数Department of Zoology, South Parks Road, Oxford OX1 3PS, UK5
 Susan Nichols合作论文数4Sam Ng' Ang合作论文数4Sue Nichols合作论文数3
 B. Ramlal合作论文数The Centre for Caribbean Land and Environmental Appraisal Research (CLEAR),, The University of the West Indies3Sara Cockburn合作论文数3Yanlai Zhao合作论文数2
 Tricia Melville合作论文数2
 Lisa Levin合作论文数Integrative Oceanography Division, Scripps Institution of Oceanography, University of California, San Diego2
 Keith Miller合作论文数2
 Wojtek Michalowski合作论文数Telfer School of Management, University of Ottawa2
 Mark Wuddivira合作论文数2Nathalie Hilmi合作论文数2
 Dan Lane合作论文数1Kelly S. Carignan合作论文数1
 Erik van Doorn合作论文数1
 Lara Lebleu合作论文数1
 Elsai Mati Asefa合作论文数Dept Environm Hlth, Haramaya Univ1Laura G. Elsler合作论文数World Maritime University1
 Sujoy Kumar Jana合作论文数Department of Surveying and Land Studies, Papua New Guinea University of Technology1
 Tingneyuc Sekac合作论文数Department of Surveying and Land Studies, The PNG University of Technology1Christopher Amante合作论文数1
 Christos Kastrisios合作论文数Natl Tech Univ Athens, Athens 15780, Greece1
 Nikola Vučić合作论文数State Geodetic Administration1
 Isaac Boateng合作论文数Akenten Appiah‐Menka University of Skills and Entrepreneurial Development1J. Hannah合作论文数1Peter Dare合作论文数1
 Sasa Vranic合作论文数Faculty of Geodesy, Institute for Applied Geodesy1
 Arvind Singh合作论文数1
 Sean Rocke合作论文数Dept. of Electr. & Comput. Eng., Univ. of the West Indies;c;Dept. of Electr. & Comput. Eng., Univ. of the West Indies1
 Craig Ramlal合作论文数1
 Jason Hall Spencer合作论文数School of Biological and Marine Sciences, Faculty of Science and Engineering, University of Plymouth1
 David Peter Mitchell合作论文数Marine Harvest McConnell1
 Stig Enemark合作论文数Aalborg University1
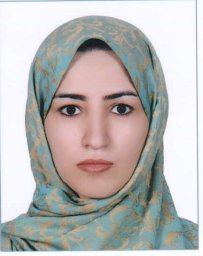 Shekoofeh Farahmand合作论文数1
 Paul Van Der Molen合作论文数School of Land Administration, International Institute for Geo-Information Science and Earth Observation (ITC),1
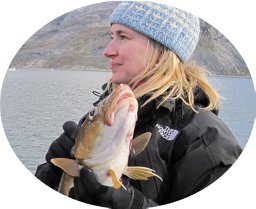 Mary S. Wisz合作论文数National Environmental Research Institute, University of Aarhus1Sandesh Jaggan合作论文数1Martinus Vranken合作论文数1Gunnar Haraldsson合作论文数1
 Lysandros Tsoulos合作论文数School of Rural and Surveying Engineering, National Technical University of Athens1Chinwe Ifejika Speranza合作论文数Institute of Geography, University of Bern1
 Efi Dimopoulou合作论文数Laboratory of Photogrammetry;Faculty of Surveying Engineering;National Technical University of Athens1
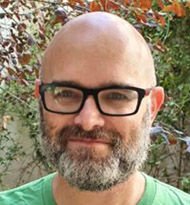 Sagi Dalyot合作论文数Environmental Crowdsourcing Lab, Transportation and Geo-Information Engineering, Faculty of Civil and Environmental Engineering, Technion – Israel Institute of Technology1
 Ralph Chami合作论文数International Monetary Fund Institute1
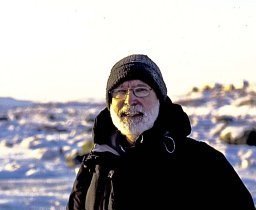 Donald L Forbes合作论文数Geological Survey of Canada, Bedford Institute of Oceanography1
 Raid Al-Tahir合作论文数Department of Surveying and Land Information;University of the West Indies;Working Group;Department of Surveying and Land Information, University of the West Indies1
 Michael (Mike) MacFerrin合作论文数Department of Geology, University of Colorado Boulder;Cooperative Institute for Research in Environmental Science1




