The NOAA/NASA Fire Influence on Regional to Global Environments and Air Quality (FIREX-AQ) experiment was a multi-agency, inter-disciplinary research effort to: (a) obtain detailed measurements of trace gas and aerosol emissions from wildfires and prescribed fires using aircraft, satellites and ground-based instruments, (b) make extensive suborbital remote sensing measurements of fire dynamics, (c) assess local, regional, and global modeling of fires, and (d) strengthen connections to observables on the ground such as fuels and fuel consumption and satellite products such as burned area and fire radiative power. From Boise, ID western wildfires were studied with the NASA DC-8 and two NOAA Twin Otter aircraft. The high-altitude NASA ER-2 was deployed from Palmdale, CA to observe some of these fires in conjunction with satellite overpasses and the other aircraft. Further research was conducted on three mobile laboratories and ground sites, and 17 different modeling forecast and analyses products for fire, fuels and air quality and climate implications. From Salina, KS the DC-8 investigated 87 smaller fires in the Southeast with remote and in-situ data collection. Sampling by all platforms was designed to measure emissions of trace gases and aerosols with multiple transects to capture the chemical transformation of these emissions and perform remote sensing observations of fire and smoke plumes under day and night conditions. The emissions were linked to fuels consumed and fire radiative power using orbital and suborbital remote sensing observations collected during overflights of the fires and smoke plumes and ground sampling of fuels. Plain Language Summary The NOAA/NASA Fire Influence on Regional to Global Environments and Air Quality (FIREX-AQ) experiment was aimed at understanding how fuel and fire conditions at the point of emission influence the chemistry of smoke, what conditions and processes control the rise of smoke plumes, what happens to smoke as it is distributed in the atmosphere, and how chemical transformation of smoke impacts air quality, weather, and climate downwind. Lessons learned from FIREX-AQ will also be used to assess and improve the effectiveness of satellites for estimating the emissions from wildfires and prescribed burns and to reduce uncertainties associated with modeling and forecasting of smoke. Here we present an overview of the FIREX-AQ effort, its motivation and design, with detailed descriptions of the measurements and analyses carried out, their connections to FIREX-AQ science goals, and the early findings of this exceptionally broad effort to understand fire and its many impacts on the atmosphere.
Ozone in the urban atmosphere can accumulate from photochemistry involving nitrogen oxides, carbon monoxide, and volatile organic compounds mainly emitted from fossil fuel combustions and volatile chemical products. Concentrated ozone near the earth's surface has a detrimental impact on the ecosystem and our health. The Los Angeles Basin is a classic example of an urban region with long‐standing ozone pollution, frequently in violation of its standard, designated by the US Environmental Protection Agency (EPA). Studies have reported substantial declines of ozone and their precursor concentrations over the past half century in this area due to extensive pollution controls. Since 2000, however, the ozone design value has remained the same and has not been able to fully reach the air quality standard set by the EPA despite decreases in its precursor concentrations. To understand this phenomenon, we utilize a chemical transport modeling approach to reproduce historical ozone trends and to conduct sensitivity runs relative to a 2010 baseline. Based on our analysis of the model simulations comparing the weekends and weekdays, rather than focusing only on the weekly averages, we diagnose that the Los Angeles Basin is actually going under a significant transition in photochemistry toward a lower ozone concentration. This reveals how air quality management strategies are slowly moving towards a pathway of reducing ozone concentrations in the future. Our study, however, suggests that further reductions of NOx emissions can lead to continued improvement of ozone pollution in this area.
Significance Recent work in Los Angeles has shown that urban volatile organic compound (VOC) emissions from consumer and industrial products—termed volatile chemical products (VCPs)—are now an important source of ozone precursors. Using advancements in VOC instrumentation, we show that VCP emissions are ubiquitous in urban regions and can be identified via unique VOC fingerprints. Through detailed modeling, we show that VCPs are as important to ozone production as fossil fuel VOCs and that the chemistry of VCPs can have significant impacts on model simulations of key atmospheric processes. Consequently, air quality models must be updated to account for both the emissions and atmospheric chemistry of VCPs in order to capture their full impact on urban air quality.
We present an updated fuel-based oil and gas (FOG) inventory with estimates of nitrogen oxide (NOx) emissions from oil and natural gas production in the contiguous US (CONUS). We compare the FOG inventory with aircraft-derived ("top-down") emissions for NOx over footprints that account for ∼25% of US oil and natural gas production. Across CONUS, we find that the bottom-up FOG inventory combined with other anthropogenic emissions is on average within ∼10% of top-down aircraft-derived NOx emissions. We also find good agreement in the trends of NOx from drilling- and production-phase activities, as inferred by satellites and in the bottom-up inventory. Leveraging tracer-tracer relationships derived from aircraft observations, methane (CH4) and non-methane volatile organic compound (NMVOC) emissions have been added to the inventory. Our total CONUS emission estimates for 2015 of oil and natural gas are 0.45 ± 0.14 Tg NOx/yr, 15.2 ± 3.0 Tg CH4/yr, and 5.7 ± 1.7 Tg NMVOC/yr. Compared to the US National Emissions Inventory and Greenhouse Gas Inventory, FOG NOx emissions are ∼40% lower, while inferred CH4 and NMVOC emissions are up to a factor of ∼2 higher. This suggests that NMVOC/NOx emissions from oil and gas basins are ∼3 times higher than current estimates and will likely affect how air quality models represent ozone formation downwind of oil and gas fields.
Nitrogen oxides (NO x ) are air pollutants critical to ozone and fine particle production in the troposphere. Here, we present fuel‐based emission inventories updated to 2018, including for mobile source engines using the Fuel‐based Inventory of Vehicle Emissions (FIVEs) and oil and gas production using the Fuel‐based Oil and Gas (FOG) inventory. The updated FIVE emissions are now consistent with the NEI17 estimates differing within 2% across the contiguous US (CONUS). Tropospheric NO 2 columns modeled by the Weather Research and Forecasting with Chemistry model (WRF‐Chem) are compared with those observed by TROPOspheric Monitoring Instrument (TROPOMI) and Ozone Monitoring Instrument (OMI) during the summer of 2018. Modeled NO 2 columns show strong temporal and spatial correlations with TROPOMI (OMI), identified with biases of −3% (−21%) over CONUS, and +8% (−6%) over point sources plus urban regions. Taking account of the negative bias (∼20%) in early version of TROPOMI over polluted regions, WRF‐Chem shows good performance with updated FIVE and FOG emissions. Our model tends to under‐predict the tropospheric NO 2 columns over background and rural regions (bias of −21% to −3%). Through model sensitivity analyses, we demonstrate the important roles of emissions from soils (11.7% average over CONUS), oil and gas production (4.1%), wildfires (10.6%), and lightning (2.3%) with greater contributions at regional scales. This work provides a roadmap for satellite‐based evaluations for emission updates from various sources.
The emissions of volatile organic compounds (VOCs) from volatile chemical products (VCPs) – specifically personal care products, cleaning agents, coatings, adhesives, and pesticides – are emerging as the largest source of petroleum-derived organic carbon in US cities. Previous work has shown that the ambient concentration of markers for most VCP categories correlates strongly with population density, except for VOCs predominantly originating from solvent- and water-borne coatings (e.g., parachlorobenzotrifluoride (PCBTF) and Texanol®, respectively). Instead, these enhancements were dominated by distinct emission events likely driven by industrial usage patterns, such as construction activity. In this work, the headspace of a variety of coating products was analyzed using a proton-transfer-reaction time-of-flight mass spectrometer (PTR-ToF-MS) and a gas chromatography (GC) preseparation front end to identify composition differences for various coating types (e.g., paints, primers, sealers, and stains). Evaporation experiments of several products showed high initial VOC emission rates, and for the length of these experiments, the majority of the VOC mass was emitted during the first few hours following application. The percentage of mass emitted as measured VOCs (<1 % to 83 %) mirrored the VOC content reported by the manufacturer (<5 to 550 g L−1). Ambient and laboratory measurements, usage trends, and ingredients compiled from architectural coatings surveys show that both PCBTF and Texanol account for ∼10 % of the total VOC ingredient sales and, therefore, can be useful tracers for solvent- and water-borne coatings.
Wildland fires involve complicated processes that are challenging to represent in chemical transport models. Recent airborne measurements reveal remarkable chemical tomography in fresh wildland fire plumes, which remain yet to be fully explored using models. Here, we present a high‐resolution large eddy simulation model coupled to chemistry to study the chemical evolution in fresh wildland fire plume. The model is configured for a large fire heavily sampled during the Fire Influence on Regional to Global Environments and Air Quality field campaign, and a variety of airborne measurements are used to evaluate the chemical heterogeneity revealed by the model. We show that the model captures the observed cross‐transect variations of a number of compounds quite well, including ozone (O3), nitrous acid (HONO), and peroxyacetyl nitrate. The combined observational and modeling results suggest that the top and edges of fresh plume drive the photochemistry, while dark chemistry is also present but in the lower part of the plume. The model spatial resolution is shown to be very important as it may shift the chemical regime, leading to biases in O3 and NOx chemistry. Based on findings in this work, we speculate that the impact of small fires on air quality may be largely underestimated in models with coarse spatial resolutions.
Despite decades of declining air pollution, urban U.S. areas are still affected by summertime ozone and wintertime particulate matter exceedance events. Volatile organic compounds (VOCs) are known precursors of secondary organic aerosol (SOA) and photochemically produced ozone. Urban VOC emission sources, including on-road transportation emissions, have decreased significantly over the past few decades through successful regulatory measures. These drastic reductions in VOC emissions have led to a change in the distribution of urban emissions and noncombustion sources of VOCs such as those from volatile chemical products (VCPs), which now account for a higher fraction of the urban VOC burden. Given this shift in emission sources, it is essential to quantify the relative contribution of VCP and mobile source emissions to urban pollution. Herein, ground site and mobile laboratory measurements of VOCs were performed. Two ground site locations with different population densities, Boulder, CO, and New York City (NYC), NY, were chosen in order to evaluate the influence of VCPs in cities with varying mixtures of VCPs and mobile source emissions. Positive matrix factorization was used to attribute hundreds of compounds to mobile- and VCP-dominated sources. VCP-dominated emissions contributed to 42 and 78% of anthropogenic VOC emissions for Boulder and NYC, respectively, while mobile source emissions contributed 58 and 22%. Apportioned VOC emissions were compared to those estimated from the Fuel-based Inventory of Vehicle Emissions and VCPs and agreed to within 25% for the bulk comparison and within 30% for more than half of individual compounds. The evaluated inventory was extended to other U.S. cities and it suggests that 50 to 80% of emissions, reactivity, and the SOA-forming potential of urban anthropogenic VOCs are associated with VCP-dominated sources, demonstrating their important role in urban U.S. air quality.
With traffic emissions of volatile organic compounds (VOCs) decreasing rapidly over the last decades, the contributions of the emissions from other source categories, such as volatile chemical products (VCPs), have become more apparent in urban air. In this work, in situ measurements of various VOCs are reported for New York City, Pittsburgh, Chicago, and Denver. The magnitude of different emission sources relative to traffic is determined by measuring the urban enhancement of individual compounds relative to the enhancement of benzene, a known tracer of fossil fuel in the United States. The enhancement ratios of several VCP compounds to benzene correlate well with population density (R2 ∼ 0.6-0.8). These observations are consistent with the expectation that some human activity should correlate better with the population density than transportation emissions, due to the lower per capita rate of driving in denser cities. Using these data, together with a bottom-up fuel-based inventory of vehicle emissions and volatile chemical products (FIVE-VCP) inventory, we identify tracer compounds for different VCP categories: decamethylcyclopentasiloxane (D5-siloxane) for personal care products, monoterpenes for fragrances, p-dichlorobenzene for insecticides, D4-siloxane for adhesives, para-chlorobenzotrifluoride (PCBTF) for solvent-based coatings, and Texanol for water-based coatings. Furthermore, several other compounds are identified (e.g., ethanol) that correlate with population density and originate from multiple VCP sources. Ethanol and fragrances are among the most abundant and reactive VOCs associated with VCP emissions.
The atmospheric mixing ratio of the greenhouse gas methane (CH4) has tripled in the last 200 years, having been nearly constant for the previous 1⁄ 2 million (Hansen et al. 2006, IPCC 2007). Reducing emissions of methane may be an important component of an initial strategy for avoiding the most severe impacts of global warming (Wennberg et al. 2012, Brandt et al. 2014). Recently, many studies found there were clear discrepancies in CH4 emissions inventories derived between the “bottom-up” and the “topdown” methods, which is strangling government regulations and further greenhouse gases studies in air quality, energy, ecosystem and climate. Current “top-down” atmospheric studies have shown that CH4 were underestimated in the United States by official inventories (Kort et al. 2008, Miller et al. 2013, Brandt et al. 2014), especially for south-central US and California. The Inventory of greenhouse gases in California has been enforced by the legislature to update every five years in term of Assembly Bill 32 of 2006, which enacted into law as the California Global Warming Solutions Act and required statewide greenhouse gas emissions not to exceed 1990 levels by the year 2020. Therefore, studies have focused on the updates in CH4 emission inventories in California, such as the South Coast Air Basin (SoCAB) and the California’s Central Valley. The SoCAB is a primary coastal urban region (Los Angeles metropolitan region) contributing CH4 emissions to
 T. B. Ryerson合作论文数229
 David D. Parrish合作论文数Air Quality Research Center, University of California, Davis;David.D.Parrish, LLC163
 Carsten Warneke合作论文数Chemical Sciences Laboratory, National Oceanic and Atmospheric Administration;Earth System Research Laboratory, National Oceanic and Atmospheric Administration145
 Joost de Gouw合作论文数Cooperative Institute for Research in Environmental Sciences, University of Colorado Boulder;Department of Chemistry, University of Colorado Boulder133
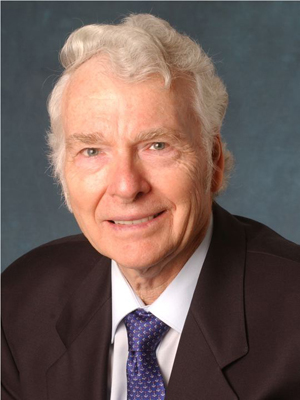 Fred C. Fehsenfeld (Fred Fehsenfeld)合作论文数David Skaggs Research Center, Cooperative Institute for Research in Environmental Sciences, University of Colorado Boulder131
 Jeff Peischl合作论文数Chemical Sciences Laboratory, National Oceanic and Atmospheric Administration;Institute for Research in Environmental Sciences, University of Colorado Boulder111
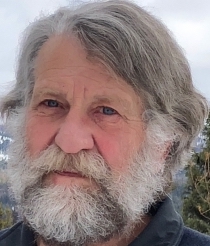 Stuart Mckeen合作论文数Cooperative Institute for Research in Environmental Sciences, University of Colorado;Chemical Sciences Laboratory, National Oceanic and Atmospheric Administration108Gregory J. Frost合作论文数98J. A. Neuman合作论文数86
 C. A. Brock合作论文数University of Denver73John S Holloway合作论文数Cooperative Institute for Research in Environmental Sciences, University of Colorado, Boulder;Earth System Research Laboratory, National Oceanic and Atmospheric Administration73
 Elliot Atlas合作论文数Department of Atmospheric Sciences, Rosenstiel School, University of Miami72
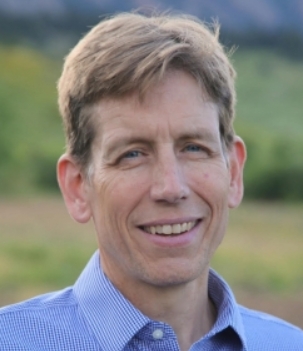 Steven Brown合作论文数Chemical Sciences Laboratory, National Oceanic and Atmospheric Administration;College of Arts and Sciences, University of Colorado Boulder62
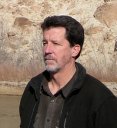 James MacKenzie Roberts (James M. Roberts)合作论文数Chemical Sciences Division, National Oceanic and Atmospheric Administration59
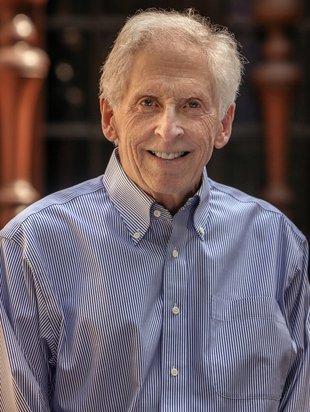 John H. Seinfeld合作论文数Division of Chemistry and Chemical Engineering, California Institute of Technology53
 John Nowak合作论文数Langley Research Center, National Aeronautics and Space Administration53
 Owen R. Cooper合作论文数Aeronomy Laboratory, NOAA52Ann M. Middlebrook合作论文数52Ilana B. Pollack合作论文数52
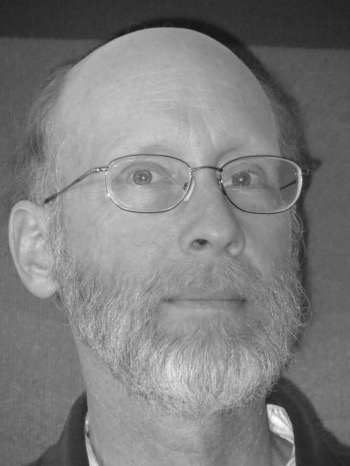 Wayne Angevine合作论文数Chemical Sciences Laboratory, Office of Oceanic and Atmospheric Research, National Oceanic and Atmospheric Administration, U.S. Department of Commerce;Cooperative Institute for Research in Environmental Sciences, University of Colorado Boulder48
 Gilman J B合作论文数Cooperative Institute for Research in Environmental Sciences, University of Colorado46
 William (Bill) Kuster合作论文数NOAA Chemical Sciences Laboratory46
 Gerhard Hubler合作论文数45Brian M. Lerner合作论文数44
 F. Flocke合作论文数Atmospheric Chemistry Division, National Center for Atmospheric Research43William P. Dubé合作论文数Cooperative Institute for Research in Environmental Sciences40
 Jérôme Brioude合作论文数Département Physique, Université de La Réunion38Christoph J. Senff合作论文数U.S.A Boulder CO U.S.A, NOAA Environmental Technology Laboratory37
 Dennis K. Nicks合作论文数Aeronomy Laboratory, National Oceanic and Atmospheric Administration36
 Brian C. Mcdonald合作论文数Cooperat Inst Res Environm Sci, Univ Colorado33R. Ahmadov合作论文数32Donna Sueper合作论文数Cooperative Institute for Research in Environmental Sciences, University of Colorado29
 Roya Bahreini合作论文数Environmental Sciences Department, University of California Riverside29
 Andreas Stohl合作论文数Department of Meteorology and Geophysics, Faculty of Earth Sciences, Geography and Astronomy, University of Vienna29E.-Y. Hsie合作论文数28
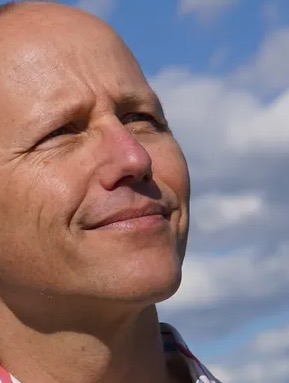 Martin Graus合作论文数IONICON, Analytik GmbH27
 A. R. (Ravi) Ravishankara合作论文数Department of Chemistry, Colorado State University;Department of Atmospheric Science, Colorado State University26Sue M Schauffler合作论文数26
 Stephen Donnelly合作论文数26
 Robert Banta合作论文数NOAA Chemical Sciences Laboratory25S.-W. Kim合作论文数24Kenneth C. Aikin合作论文数24
 Gabrielle Petron合作论文数24Paul D Goldan合作论文数24
 Pete Edwards合作论文数Department of Chemistry, University of York23
 Rodney Weber合作论文数School of Earth and Atmospheric Sciences, College of Sciences, Georgia Institute of Technology22Eric J. Williams合作论文数22
 Patrick R. Veres合作论文数Earth Observing Laboratory, National Center for Atmospheric Research22




