The caloric expenditure of 44 healthy, lean and obese women, 8 of whom were trained athletes, was measured by indirect calorimetry. Body composition was determined. Ages ranged from 18-65 yr and body weights from 43-143 kg. Stepwise, multiple-regression analysis was used to determine whether one or several variables best predicted the resting metabolic rate (RMR) of the women. The RMR and the thermic effect of food (TEF) were measured before and after the women consumed a mixed breakfast meal. The results showed that the currently available tables and regression equations overestimate the RMR of healthy women by 7-14%. Body weight was highly related to the RMR, and stepwise inclusions of various variables did not improve predictions of RMR. The slopes of the regression lines for nonathletes and athletes were significantly different. Regression equations for predicting RMR of women were developed: Nonathletes RMR = 795 + 7.18 kg WT; Athletes RMR = 50.4 + 21.1 kg WT. The range of RMR per kilogram body weight was wide for nonathletic, but narrow for athletic women. The metabolism of some lean and obese, nonathletic women was highly efficient, predisposing these women for developing and maintaining body fat. The TEFs were indistinguishable between nonathletic and athletic women, and formed a continuum from the lightest to the heaviest woman. AmJClinNutr l986;44:l-l9.
Biochemistry and Molecular Biology Education is an international journal aimed to enhance teacher preparation and student learning in Biochemistry, Molecular Biology, and related sciences such as Biophysics and Cell Biology, by promoting the world-wide dissemination of educational materials.
Ketone body metabolism involves the synthesis, transport, oxidation, and urinary excretion of acetoacetate, β-hydroxybutyrate, and acetone. These substrates are water-soluble, 3- or 4-carbon compounds, derived from fatty acids, that serve as alternate fuels for tissues with mitochondria when carbohydrate availability is limited, such as during starvation. Ketone bodies are synthesized in the liver and kidney cortex and are used by most other tissues as an important source of energy.
cycle is thecentral process in energy metabolism. However, the TCA cyclealso functions in biosynthetic pathways in which intermediatesleave the cycle to be converted primarily to glucose, fatty acids,or non-essential amino acids. If TCA cycle anions are removedfrom the cycle they must be replaced to permit its continuedfunction. This process is termed
The purpose of this work was to clarify the essentiality of glucose production from amino acids in obese subjects undergoing prolonged starvation and to provide an explanation for death after the depletion of lean body mass when some body fat is still available to meet body energy requirements. Five obese subjects fasted for 21 d. Nitrogen balance studies were combined with measurements of blood metabolite and hormone concentrations, indirect calorimetry, determination of body-composition changes, and catheterization techniques. Phenylacetate was administered from day 19 to day 21 to remove glutamine from the body and to assess this perturbation on energy requirements, ammoniagenesis, ureagenesis, gluconeogenesis, and ketogenesis. The obese subjects lost body fat and fat-free mass in parallel and resting metabolic energy requirements per mass remained constant during starvation. Urinary nitrogen excretion reflected continuous demands for amino acid oxidation. Phenylacetate administration decreased blood glutamine concentrations, increased plasma epinephrine concentrations, and increased urinary nitrogen loss through phenylacetylglutamine excretion; urinary excretion rates of urea, ammonium, urate, creatinine, and ketone bodies remained unchanged. The essentiality of amino acid oxidation was therefore shown. Late in prolonged starvation, aminogenic oxidation amounted to 7% and fat provided the remaining energy requirements. Hepatic and renal gluconeogenesis were not curtailed. Blood glutamate served as a vehicle for carbon and nitrogen transport; the contribution of glycerol to gluconeogenesis equaled that of all amino acids combined. The minimal quantities of amino acid (0.27 +/- 0.08 and 0.52 +/- 0.10 g) and fat (1.53 +/- 0.21 and 2.98 +/- 0.15 g) oxidized per kg body wt or fat-free mass/d, respectively, were determined. Included within amino acid and fat oxidation were the minimal amounts of precursors needed for synthesizing the essential quantity of glucose (0.34 +/- 0.14 and 0.66 +/- 0.20 g) oxidized per kg body wt or fat-free mass, respectively.
Oxidative and nonoxidative macronutrient disposal rates were measured in lean and obese males randomly fed mixed meals containing 0, 33, 67, 100, and 134 kJ/kg fat-free mass (0, 8, 16, 24, and 32 kcal/kg). Body composition, preprandial and postprandial energy expenditure, and macronutrient concentrations in the extracellular space were measured. Relationships among carbohydrate, fat, and protein disposal rates; body weight; and body composition were examined. Oxidative and nonoxidative disposals of macronutrients were not different between the lean and obese groups. Glucose was preferentially oxidized and fat was preferentially stored after nutrient ingestion. Macronutrient storage increased linearly with caloric intake. Oxidative and nonoxidative macronutrient disposals were completed within 8 h after ingesting the meals. Serum insulin concentrations rose to 3000-6000 pmol/L in two obese men after their two largest meals. Eight hours after nutrient ingestion, concentrations of macronutrient substrates, metabolic products, and insulin were indistinguishable from preprandial values.
There has been an exponential rise in interest, publications, and knowledge of nutrition during the last 25-30 years. Recently, many of the classic axioms on body composition and energy requirements are undergoing reappraisal. We studied body compositional variables and energy requirements in a large number of men and women, 8 of whom were world class athletes and 32 of whom were dwarfs. These adults from a large metropolitan area were young to old, short to tall, lean to obese, and had broad socioeconomic, educational, and employment backgrounds. Their body weights varied from 32 to 171 kg. These divergent humans provided unique data from one species studied by standardized techniques. In 395 individuals, height and weight were used to calculate body mass indices, widely used to indicate obesity in humans. Densitometry was employed to measure fat and fat-free masses. Body mass index was compared to body fat estimated from densitometry. In 143 lean and obese adults, indirect calorimetry was used to measure the resting metabolic rates under standardized conditions, and their results were related to body weight, body fat and fat-free masses, and body surface area. Initially, we found that all body mass indices were poor predictors of body fat for the 32 dwarfs. Subsequently, we extended our study to include 363 adults of average stature and found that all body mass indices were of limited value, if not worthless, in distinguishing lean from obese humans. The results from measuring the energy requirements of humans with body sizes varying over a 6-fold range revealed some fundamental principles of bioenergetics for adults. They showed that resting metabolic rate increases as weight or body size increases. However, the energy requirements per unit mass decrease as body weight or size increases.
Indirect calorimetry was used to measure resting metabolic rates (RMR), and densitometry and anthropometry were used to measure body fat and fat-free masses of 32 adults with very short stature. Twenty-seven of them were achondroplastic dwarfs. Their results were compared to those obtained from 103 lean and obese adults with normal heights. All 32 dwarfs had distinctly greater RMR per kg fat-free mass by densitometry than adults with average stature. However, there was a wide variation in the RMR among dwarfs, which was independent of leanness or obesity. In spite of increased RMR, obesity among dysplastic adult dwarfs was twice as prevalent as among average-height adults. Increased abdominal:hip ratios were prevalent among dwarfs, but these ratios do not reflect body fat. Body mass indices were worthless, and skinfold thicknesses and other anthropometric measurements were of very limited value in predicting the body fat of dwarfs. Although our new and specific equations for estimating RMR and body composition give reasonable values, we recommend that the caloric requirements and body compositional variables be measured if nutritional therapy is needed to induce weight loss or gain in Little People.
The response of peripheral tissues to insulin is reduced in fasting and diabetes mellitus. The experiments described herein were designed to determine whether insulin-stimulated glucose oxidation is affected by the free–fatty acid–derived plasma metabolites acetone, acetol, and propylene glycol (1,2-propanediol [1,2-PD]), concentrations of which are elevated in both starvation and diabetic ketosis. In epididymal adipose tissue from fed and 48-h–fasted rats given 3% acetone drinking water for 7 days, insulin-stimulated glucose oxidation was reduced by ∼30–40%. After ingestion of 2% acetol for 7 days, basal and insulin-stimulated glucose oxidation was lowered ∼30%, whereas the consumption of 1,2-PD had no influence on either basal or insulin-stimulated glucose oxidation. Similar effects on glucose oxidation were observed in isolated adipocytes from fed rats after ingestion of 3% acetone and 2% acetol for 7 days. The reduction in insulin-stimulated glucose oxidation in adipose tissue in vitro required the consumption of 3% acetone water for >3 days. In 48-h–fasted rats that ingested 3% acetone for 5 days, insulin-stimulated glucose oxidation remained depressed 4 days after withdrawal of acetone from the drinking water. These studies imply that at least part of the insulin resistance indigenous to fasting and diabetic ketosis may be attributed to the metabolic influence of acetone and/or acetol in body fluids. In rats consuming drinking water containing 0.5–5.0% (vol/vol) acetone for 7 days, both acetol and 1,2-PD were found in plasma at concentrations related to the acetone content of the drinking water and to the degree of acetonemia, which ranged from 0.520 ± 0.076 to 15.90 ± 1.43 mM. The concentrations of acetol and 1,2-PD but not acetone were elevated in the plasma of rats given acetol in the drinking water, and only the concentration of 1,2-PD was elevated in the plasma of rats that consumed 1,2-PD. These results indicate that acetone is converted sequentially and irreversibly to acetol and 1,2-PD.
The accuracy of body mass indices (BMIs), such as Quetelet’s index, for the definition of obesity was investigated in a large sample of healthy humans. Two hundred thirteen women and 150 men with a wide spectrum of weights, heights, and ages underwent densitometric analysis for the determination of percent body fat (%BF). %BF was then contrasted with various well-established BMIs. Although %BF was correlated with all the BMIs (r = 0.60–0.82), applying objective definitions of obesity based on BMIs or %BF by densitometry often produced conflicting results. It was also found that the 95% confidence intervals for predicting %BF by using Quetelet’s index were very wide. Because of the wide variation for individuals between densitometrically determined body fat and body fat as estimated by BMIs, we conclude that BMIs should be used with caution as indicators of obesity.
Amino acids stimulate the release of glucagon and insulin. To assess the role of aminogenic hyperglucagonemia, we have studied, in healthy young males, the effects of basal (less than 100 pg/ml) and high (200-400 pg/ml) plasma glucagon concentrations on amino acid metabolism during intravenous infusion (0.5 g.h-1.4 h) of a mixture of 15 amino acids. Basal plasma glucagon concentrations were obtained by infusion of somatostatin (0.5 mg/h) plus glucagon (0.25 ng.kg-1.min-1) and high plasma glucagon concentrations by infusion of somatostatin plus glucagon (3.0 ng.kg-1.min-1) or by infusion of amino acids alone. All studies were performed under conditions of euglycemic (83-91 mg/dl) hyperinsulinemia (50-80 microU/ml). Hyperglucagonemia significantly increased 1) net amino acid transport from the extracellular into the intracellular space (by approximately 4%), 2) net degradation of amino acids entering the intracellular space (by approximately 40%), and 3) conversion of degraded amino acids into glucose from 0-10% (basal glucagon) to 70-100% (high glucagon). Hyperglucagonemia did not affect the amount of amino acids excreted in the urine (approximately 4%). We conclude that glucagon plays an important role in the disposition of amino acids by increasing their inward transport, their degradation, and their conversion into glucose.
Significantly increased blood ketone body levels can be occasionally observed in the forensic setting in situations other than exposure to cold, diabetic or alcoholic ketoacidosis. Though infrequent, these cases do occur and deserve thorough evaluation in order to establish appropriate differential diagnoses and quantify the role that hyperketonemia may play in the death process. Starvation ketoacidosis is a rare cause of metabolic acidosis and is a phenomenon that occurs normally during fasting, as the body switches from carbohydrate to lipid energy sources. The levels of ketonemia in starvation ketoacidosis is usually mild in comparison to those seen in diabetic or alcoholic ketoacidosis. In the clinical setting, several cases of starvation-induced ketoacidosis mainly associated with gastric banding, pregnancy, malnutrition and low-carbohydrate diets have been reported. However, starvation ketosis causing severe metabolic acidosis has been rarely described in the medical literature. In the realm of forensic pathology, starvation-induced hyperketonemia has been rarely described. In this paper we present the postmortem biochemical results observed in situations of suspected starvation-induced hyperketonemia that underwent medico-legal examination. In all these cases, the diagnosis of starvation induced-hyperketonemia and the subsequent ketoacidosis was established per exclusionem based on all postmortem investigation findings. A review of the literature pertaining to the clinical diagnosis of starvation ketoacidosis is also provided.
Sera and their IgG from 10/104 diabetic patients (five with insulin-dependent and five with noninsulin-dependent diabetes, NIDDM), contained antibodies that bound 125I-labeled purified human insulin receptors. 9 of these 10 sera failed to inhibit insulin binding (to rat hepatocytes and human placental membranes), did not stimulate glucose oxidation (by isolated rat adipocytes), and did not bind human placental IGF-1 receptors. Only one serum (and its IgG) modestly inhibited insulin binding and stimulated glucose oxidation. We conclude (a) that sera from 9/104 diabetics (five insulin-dependent and four noninsulin-dependent) contained a newly identified species of IgG antiinsulin receptor autoantibodies (AIRA), which bound to the insulin receptor at a locus different from the insulin binding site and did not inhibit insulin binding; and (b) that only 1/104 diabetic sera contained low-titer "conventional" antiinsulin receptor autoantibodies that bound to the insulin receptor at or near the insulin binding site, inhibited insulin binding and caused a clinical condition, which was difficult to distinguish from typical NIDDM.
A systemic reappraisal of the thermic effect of food was done in lean and obese males randomly fed mixed meals containing 0, 8, 16, 24, and 32 kcal/kg fat-free mass. Densitometric analysis was used to measure body composition. Preprandial and postprandial energy expenditures were measured by indirect calorimetry. The data show that the thermic effect of food was linearly correlated with caloric intake, and that the magnitude and duration of augmented postprandial thermogenesis increased linearly with caloric consumption. Postprandial energy expenditures over resting metabolic requirements were indistinguishable when comparing lean and obese men for a given caloric intake. Individuals, however, had distinct and consistent thermic responses to progressively greater caloric challenges. These unique thermic profiles to food ingestion were also independent of leanness or obesity. We conclude that the thermic effect of food increases linearly with caloric intake, and is independent of leanness and obesity.
Recently, indirect calorimetry has frequently been used together with hyperinsulinemic clamps. With few exceptions, however, no attention was paid in these studies to the possible effects of hyperinsulinemia on urea nitrogen (N) pool size and the consequences of such changes on the calculated rates of protein, lipid, and carbohydrate (CHO) oxidation. We have determined the effects of euglycemic-hyperinsulinemic clamps on urea N pool size, urinary N excretion, and rates of protein, lipid, and CHO oxidation (measured by indirect calorimetry) in six normal men. Insulin infusion (1 mU.kg-1.min-1) increased peripheral venous insulin concentration from 7 +/- 1.2 (mean +/- SE) to 51 +/- 4 microU/ml. Glucose concentration was clamped at 84 +/- 1.1 mg/dl. Between 0 (preclamp) and 360 min (end of clamp), blood urea N concentration decreased from 17.2 +/- 1.1 to 11 +/- 0.8 mg/dl (P less than .001), and the urea N pool decreased from 604 +/- 41 to 388 +/- 30 mmol (P less than .001). The urea N production rate decreased from 461 +/- 91 (preclamp) to 91 +/- 63 mumol/min during the last 4 h of the clamp (P less than .05). Urinary N excretion remained unchanged (705 +/- 113 vs. 905 +/- 125 mumol/min, NS). Correction of urinary N excretion for insulin-induced reductions in the urea N pool resulted in the following changes in substrate oxidation rates (calculated for the last 4 h of the clamp).(ABSTRACT TRUNCATED AT 250 WORDS)
The resting metabolic rates (RMRs) of 44 lean and obese women, 8 of whom were trained athletes, and of 60 lean and obese men were measured by indirect calorimetry. These healthy humans, ranging from 18 to 82 years old and from 43 to 171 kg in weight, were mentally and physically active. Body composition was determined by densitometry and skinfold thickness. Stepwise multiple regression analysis was used to determine whether one or several variables best predicted RMR. Body compositional variables reflecting active protoplasmic tissue were all highly interrelated. Body weight alone yielded prediction values for RMR comparable to those of other variables of active protoplasmic tissue mass. Among these mentally and physically active women and men, the influence of age on RMR was trivial, and regional distribution of fat had no influence on the RMR. The 95% confidence limits for RMR in both lean and obese subjects were broad. Thus, metabolic efficiency is not necessarily or exclusively related to obesity. In fact, the caloric requirements of humans, based on body weight or active protoplasmic tissue mass, may vary twofold. With the exception of the elderly men, the classic prediction equations and tables developed during the first half of this century greatly overestimated the RMR of healthy lean and obese humans. Therefore, new regression equations for predicting the RMR based on weight and fat-free mass were developed.
 Guenther H. Boden合作论文数Temple University Hospital46
 M A Mozzoli合作论文数16GA REICHARD合作论文数13
 Mulchand S. Patel合作论文数Department of Biochemistry, Jacobs School of Medicine & Biomedical Sciences, University at Buffalo12Philip Felig合作论文数7
 Karl J Smalley合作论文数7
 Zebulon V Kendrick合作论文数7
 Iraj Rezvani合作论文数7Robert D. Hoeldtke合作论文数7VE TRAPP合作论文数6Tk Ray合作论文数6RW MASTER合作论文数6Cr Shuman合作论文数5Marcia Polansky合作论文数5G Boden合作论文数5George A. Reichard合作论文数5DA DALESSIO合作论文数4Cl Skutches合作论文数4
 Sonia Caprio合作论文数Department of Pediatrics, Yale School of Medicine, Yale University4Luc Tappy合作论文数4R. Shimoyama合作论文数4F George Cahill合作论文数4Fa Reichle合作论文数3R.H. Smith合作论文数3M Mozzoli合作论文数3Cary R Savage合作论文数3JJ SHELMET合作论文数2Gf Cahill合作论文数2george f cahill合作论文数2DG SAPIR合作论文数2RS Owen合作论文数2Mc Sivitz合作论文数2KM CILMI合作论文数2Bushman Mc合作论文数2Alli Morgan合作论文数Icahn Sch Med Mt Sinai, New York, NY 10029 USA2Hg Kemp合作论文数2P Paul合作论文数2
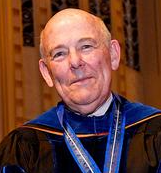 Richard W. Hanson合作论文数Case Western Reserve University2
 Errol Basil Marliss合作论文数2A.C. Haff合作论文数2N. Essa-Koumar合作论文数2Rodney S. Owen合作论文数2Michael R. Rudnick合作论文数Health Sciences Center, Temple University2T. Kreulen合作论文数2R Arky合作论文数1V DINOSO合作论文数1C Raefsky合作论文数1Ke Quickel合作论文数1




