Organic farming is a key element in achieving more sustainable agriculture. For a better understanding of the development and impact of organic farming, comprehensive, spatially explicit information is needed. This study presents an approach for the discrimination of organic and conventional farming systems using intra-annual Sentinel-2 time series. In addition, it examines two factors influencing this discrimination: the joint learning of crop type information in a concurrent task and the role of spatial context. A Vision Transformer model based on the Temporo-Spatial Vision Transformer (TSViT) architecture was used to construct a classification model for the two farming systems. The model was extended for simultaneous learning of the crop type, creating a multitask learning setting. By varying the patch size presented to the model, we tested the influence of spatial context on the classification accuracy of both tasks. We show that discrimination between organic and conventional farming systems using multispectral remote sensing data is feasible. However, classification performance varies substantially across crop types. For several crops, such as winter rye, winter wheat, and winter oat, F1 scores of 0.8 or higher can be achieved. In contrast, other agricultural land use classes, such as permanent grassland, orchards, grapevines, and hops, cannot be reliably distinguished, with F1 scores for the organic management class of 0.4 or lower. Joint learning of farming system and crop type provides only limited additional benefits over single-task learning. In contrast, incorporating wider spatial context improves the performance of both farming system and crop type classification. Overall, we demonstrate that a classification of agricultural farming systems is possible in a diverse agricultural region using multispectral remote sensing data.
Deep learning is increasingly applied in spectral imaging and remote-sensing research, yet accessible interface-based software remains limited. We therefore developed the Spectral Imaging Deep Learning Mapper (SpecDeepMap), a free and open-source application embedded into the EnMAP-Box QGIS plugin that enables deep-learning–based spectral analysis and mapping. SpecDeepMap implements a comprehensive semantic segmentation workflow through a user-friendly graphical interface, requiring no programming expertise. The software is designed for multispectral and hyperspectral data and addresses geographical data challenges, such as spatial class distribution, and continuous largescale mapping tasks. SpecDeepMap offers various deep-learning architectures, such as U-Net, U-Net++, DeeplabV3+, and SegFormer, paired with diverse backbones such as ResNet-18, ConvNeXt, Swin-Transformers and Segment Anything Model 2. This software is the first QGIS plugin that enables fine-tuning multispectral foundation models for Sentinel-2 Top of Atmosphere Reflectance imagery. These weights stem from pretraining by Wang et al. (2022) on the Self-Supervised Learning for Earth Observation Sentinel-1/2 dataset.
Agriculture in the tropics is often challenged by low productivity, climate change and growing food demands. In the mostly rainfed systems of the semi-arid tropics, floodplain croplands enable year-round crop production and allow the cultivation of marketable crops, but the extent and spatial distribution of floodplain croplands remain largely unknown. We tested combinations of Sentinel-2, Sentinel-1, and PlanetScope time series to distinguish floodplain and rainfed cropland across Nampula Province (~80,000 km²) in Mozambique. We used a Random Forest classifier paired with post-processing based on class probabilities, elevation, and hydrological data, to reduce map errors. Time series data from multi-sensor constellations with post-processing delivered more accurate results compared to a single- or double-sensor approach, with overall accuracies of up to 88.4% ± 0.8% and class-specific user and producer accuracies of up to 53.4% ± 4.4% and 71.5% ± 7.8%, respectively, for floodplain cropland and 73.4% ± 2.2% and 92.7% ± 1.2% for rainfed cropland. While S2 features yielded the highest single-sensor accuracy, integrating S1 and PS data improved results for both classes, underlining the value of multi-sensor approaches. Our study revealed that 92.6% of the cropland in the region is rainfed (2,105,000 ha ± 64,000 ha), while 7.4% is floodplain cropland (about 167,000 ha ± 22,000 ha), concentrated in suburban regions. The final map revealed a fragmented cropland pattern between rainfed and floodplain fields, which is driven by socio-environmental dynamics. Our proposed multi-sensor mapping workflow contributes to a more nuanced understanding of the tropical dryland agriculture system.
The effective translation of Earth observation (EO) measurements into actionable information for agriculture and land monitoring is critical to support policy implementation on climate, environment, and sustainable development. However, this translation remains challenging, as EO evolves from an awareness-raising instrument into an operational tool for evidence-based policymaking. To address this gap, we systematically link, for the first time, European Union (EU) land-related agricultural and environmental policies to EO-derived variables that can be generated from enhanced optical satellites expected in the next decade. We present a comprehensive framework for assessing the technology readiness levels (TRLs) of EO variables used to map, monitor, and manage crop, forest, soil, mineral, and water resources, thereby facilitating policy implementation and compliance. Upcoming Copernicus Hyperspectral Imaging Mission for the Environment (CHIME), and the Sentinel-2 Next Generation (S2NG) missions, both developed by the European Space Agency (ESA), will deliver substantial technological advancements for high-level EO-based products, enabling applications such as plant nitrogen and soil organic carbon content (SOC) estimation, species identification, and water quality characterization. Realizing the full potential of CHIME and S2NG for agricultural and environmental policy implementation will require advancing current products from prototype stages (TRL 4–6) to full operational readiness (TRL 9) through robust science-policy interfaces. Within such interfaces, we recommend exploiting existing (hyperspectral) EO data and time series, strengthening in-situ observations for robust model development and validation, and testing synergies between systems. Co-design of tailored products with policymakers is then essential to refine algorithms and align EO outputs with regulatory needs and scales. Upcoming spaceborne imaging spectroscopy and enhanced multispectral data streams thus have the potential to become game-changers and indispensable tools for EU policy implementation, providing greater traceability of key environmental and agricultural processes.
For over fifty years, the Landsat satellite series has provided continuous and comprehensive data for monitoring changes on the Earth's terrestrial surface. Eight successive missions, carrying progressively more sophisticated sensors, with improved radiometric, geometric, and spatial characteristics, have provided an unbroken series of optical and thermal imagery, unparalleled globally. With limited lifetimes for each Landsat satellite, planning of each mission typically overlaps to ensure continuity. Commencing in 2021, planning of a Landsat-9 successor gathered user needs from across the Earth Observation (EO) community, resulting in the Landsat Next (LNext) mission design of three sun-synchronous satellites to acquire reflective and thermal wavelength observations with two to three times the temporal, spatial, and spectral resolution of previous missions. Proposed 2026 U.S. budgets have significantly reduced NASA Earth Science funding. Alternate architectures are now being investigated for Landsat Next that would only meet Landsat-9 design requirements. While this would provide observation continuity, this implies a revised Landsat Next program launched in the early 2030s with nearly 30 year old capabilities, that may acquire data with lower radiometric quality than the current on-orbit Landsat-8 and 9 missions, and that will not support the new capabilities advocated for by the EO user community. This correspondence serves to raise community awareness that the decision is pending, and outlines the observation requirements originally envisioned for LNext and how they were derived to provide context for evaluating the restructured and descoped capability now being considered.
Temperate forests are experiencing widespread crown dieback and increasing mortality from combined biotic and abiotic stressors. While satellite-based remote sensing is increasingly used to monitor forest health, most studies rely on spectral greenness indices, rather than directly quantifying dieback. Fractional cover of nonphotosynthetic vegetation (NPV) provides a more direct measurement of disturbance impact but has not been applied for broad-scale dieback mapping. We present an approach to map sub-pixel tree dieback using Sentinel-2 imagery and regression-based unmixing, without requiring extensive training data. We combined triangular feature space concepts, aerial imagery, and tree species maps to compile a multi-temporal spectral library for Germany and generate synthetic training data. We trained ensembles of Support Vector Regression models to predict NPV, photosynthetic vegetation, and soil fractions for every Sentinel-2 image, and evaluated model scalability across broad-scale forest gradients (species, topography, time). Finally, we mapped annual dieback from the intra-annual NPV time series and compared dieback rates between dominant tree species. Our models generalized well across forest types and environmental gradients at national scale (Mean Absolute Errors <= 13.6%). NPV-based dieback rates were consistent with the German Forest Crown Condition Survey (r = 0.8) and revealed species-specific patterns from 2019 to 2022: spruce exhibited the highest dieback (2.7%), followed by pine (1.5%), oak (0.7%), and beech (0.5%). Our study shows that tree dieback mapping is possible at national scale using spectral unmixing, without requiring extensive training data. The approach emphasizes the value of intra-annual NPV fraction time series and advances national- and regional-scale monitoring of forest health by directly quantifying disturbance impacts beyond greenness indices.
Complex smallholder agriculture, characterized by overlapping sowing windows and crop mixtures, poses a challenge to crop type mapping using remote sensing. While previous studies have addressed smallholder crop type classification, few have examined intercropping, necessitating a nuanced understanding of the temporal characteristics of cropping practices (e.g., crop combinations and crop sequencing). We integrated Sentinel-1 and Sentinel-2 for mapping mono- and intercropping systems across multiple growing cycles, which has been overlooked by studies treating the rainy season with multiple growing cycles as a single temporal block. Fieldbased crop inventories were incorporated to identify eight farming system classes in the southern Guinea Savannah of southwest Nigeria (SGS). These include early maize, late maize, early cassava, late cassava, yam, rice, maize-cassava intercropping, and Others, comprising sweet potato, cocoyam, and cowpea, as well as other minority crops. Random Forest models were trained using monthly and bimonthly composites in seven experiments which were validated through 30-fold cross-validation. Models with only Sentinel-1 had low overall accuracy (0.50). Accuracy improved to over 0.75 for all classes in the best-performing model combining monthly Sentinel-1 and bimonthly Sentinel-2 data. Class-wise accuracy for rice was highest (UA = 0.90, PA = 0.81), whereas maize-cassava intercropping had PA = 0.85, UA = 0.79. Early maize was higher (UA = 0.81, PA = 0.89) than late maize (UA = 0.74, PA = 0.58). Regional distribution across the SGS reveals that yam concentrates in the north, while early cassava and early maize are mainly found in the central areas, and intercropping dominates fragmented southern landscapes. The scalable approach to mapping similar crop types across multiple growing cycles accounted for inter-growing cycle crop dynamics and demonstrated how integrating local cropping practices and crop calendars with satellite data can advance the remote sensing of smallholder agriculture.
European grasslands provide biodiversity, carbon storage, and agricultural services, but face increasing pressure from intensification and climate change. We review remote sensing indices used to monitor conservation-relevant grassland environmental indicators in Europe, covering biochemical, structural, spatial, and temporal indices from satellite, airborne, uncrewed aerial vehicle (UAV) and ground-based sensors. We synthesize best-practice applications for landscape/habitat/species identification, biomass and LAI, biodiversity, management, fluxes, and temporal dynamics, and summarize key limitations (e.g., saturation and background effects, mixed pixels, and limited model transferability). Finally, we outline how data fusion and emerging hyperspectral/thermal missions can improve operational, policy-ready monitoring.
Grasslands are biodiversity hotspots and provide a wide range of ecosystem services in the agricultural landscape. One important factor that drives ecosystem services is grassland age, as it influences the carbon sequestration potential but also supports biodiversity and the resilience of grassland to disturbances. Satellite image time series enable grassland age estimates, given the long-term coverage of virtual constellations and methodologies able to deal with variable satellite data availability. We present an approach to estimate grassland age in temperate regions of intensive agriculture using multidecadal time series of Landsat and Sentinel-2 data and bare soil occurrence to indicate agricultural land use periods. Every clear-sky satellite observation from 1986 to 2023 in grassland is classified as bare soil or non-bare soil and normalized to seasonal bare soil occurrence frequency. We then calibrate a rule set to derive grassland age based on the temporal bare soil frequency patterns. We demonstrate our approach at national scale for Germany. Grassland establishment was detected with an F-score of 78.92 +/- 0.64, and differentiated from grassland persistent throughout all analyzed years with 99.21 +/- 0.02% overall accuracy. The mean absolute error for grassland age is 1.3 years, and estimates remain reliable throughout low observation densities. Regional and temporal patterns align with political changes due to the collapse of the German Democratic Republic and adaptations in European agricultural policies since the 1990s. Our study demonstrates the potential of long-term image time series from satellite constellations to generate reliable data on grassland age for e.g., biodiversity or ecosystem service modelling.
Grasslands deliver a variety of ecosystem services, such as the provision of biomass, carbon sequestration or water retention and with that play a key role for climate change mitigation and preservation of biological diversity. The intensity of grassland management directly impacts these ecosystem services and functions. However, spatial information on grassland use intensity is scarce. Remote sensing time series from optical and/or SAR sensors help to overcome this data scarcity, as they enable to derive dates and frequency of mowing events as a proxy of grassland use intensity. A growing number of published algorithms relate abrupt changes in remote sensing time series to grassland management activities either by defining threshold-based rules or by making use of machine/deep learning techniques. So far, the different algorithms have not been compared and, due to a lack of suitable reference data, have usually not been tested for spatial and temporal transferability. We present the results of a comparison exercise based on an unprecedented set of independent reference data, containing information on more than 5000 grassland mowing dates that were compiled from eight European countries over a five-year period. We analyzed the performance of ten mowing detection algorithms across different geographic regions, years, mowing intensity, levels of reference data quality, and method and satellite sensor domains. The overall results show that when using all available reference data, F1 scores ranged from 0.55 to 0.74, and from 0.56 to 0.71 when only the highest quality reference data were considered. This decision, however, reduced the number of reference events to around 1500 with a regional bias to Austria, Germany, and Switzerland. We found that algorithm performance varies across space and time and that overall, the highest accuracies were achieved by machine learning based algorithms, although not substantially outperforming rule-based algorithms. The results did not confirm a consistently positive influence of the combined use of optical and SAR data in the prediction of mowing events, but we observed variations in algorithm performance, towards the lower and higher ends of grassland use intensity. Despite testing a variety of algorithms from different method and sensor domains, we observed a general upper limit of model performance and could not identify one single algorithm that performed best in all cases. The results of this comparison exercise can guide practitioners to choose approaches and input data that are most suitable for their specific use-case. The comparison exercise also highlights the importance of consistent, representative, and reliable reference data. We therefore recommend maintaining and extending this baseline dataset for the evaluation of upcoming algorithms, Earth Observation missions, and derived products for comprehensive monitoring of grassland use intensity.
The design of science-based policies to improve the sustainability of smallholder agriculture is challenged by a limited understanding of fundamental system properties, such as the spatial distribution of active cropland and field size. We integrate 1.5 m resolution satellite imagery, satellite embeddings, and deep learning to map individual fields in complex smallholder systems at policy-relevant scale. We identify 17 million fields across Mozambique for the target year 2023, reflecting the cropland distribution but also pointing to previously uncaptured agricultural regions located in agricultural frontier regions which host 5%-9% of the Mozambican population. Field size in Mozambique is low overall, with half of the fields being smaller than 0.2 ha, and 78% smaller than 0.5 ha. Field size varies with accessibility, population density, and forest cover change, suggesting the presence of diverse actors, including semi-subsistence smallholder farms, medium-scale commercial farms, and large-scale farming operations. Our results suggest that field size is a key indicator relating to the socio-economic and environmental outcomes of agriculture and their trade-offs.
The design of science-based policies to improve the sustainability of smallholder agriculture is challenged by a limited understanding of fundamental system properties, such as the spatial distribution of active cropland and field size. We integrate very high spatial resolution (1.5 m) Earth observation data and deep transfer learning to derive crop field delineations in complex agricultural systems at the national scale, while maintaining minimum reference data requirements and enhancing transferability. We provide the first national-level dataset of 21 million individual fields for Mozambique (covering 800,000 km2) for 2023. Our maps separate active cropland from non-agricultural land use with an overall accuracy of 93
Croplands are essential for food security but also impact the environment, biodiversity, and climate. Understanding, monitoring, modeling, and managing these impacts require accurate, comprehensive information on cropland vegetation cover. This study aimed to continuously monitor the state and vegetative processes of cropland, focusing on the assessment of bare soil and its cover with photosynthetic vegetation (PV) and non-photosynthetic vegetation (NPV) at the national level. We employed regression-based unmixing techniques using time series of Sentinel-2 and Landsat imagery to quantify cover fractions of NPV, PV, and soil during the agricultural growing season. Our approach extends existing spectral unmixing methods by incorporating a novel soil-specific unmixing process based on a soil reflectance composite. The extension accounts for variations in the spectral characteristics of soils which is particularly relevant for large-scale monitoring of annually cultivated croplands, as the spectral soil properties can vary considerably at national level and periods of bare soil are frequent. All cover fractions were predicted with mean absolute errors between 0.13 and 0.19. Introducing soil-specific unmixing reduced the mean absolute error of the predictions for soil by 11.3 % and NPV by 15.1 % without compromising PV predictions, particularly benefiting areas with bright soils. These findings demonstrate the efficacy of our method in accurately predicting crop cover throughout the cultivation period and underline the added value of incorporating the soil adjustment into the unmixing workflow. The contributions of this research are twofold: first, it provides essential data for the continuous monitoring of cropland cover, supporting agricultural carbon cycle and soil erosion modeling. Second, it enables further investigation into cropland management practices, such as cover cropping and tillage, through time series analysis techniques. This work underscores the potential of advanced spectral unmixing methods for enhancing agricultural monitoring and management strategies.
Long-term monitoring of grasslands is pivotal for ensuring continuity of many environmental services and for supporting food security and environmental modelling. Remote sensing provides an irreplaceable source of information for studying changes in grasslands. Specifically, Spectral Mixture Analysis (SMA) allows for quantification of physically meaningful ground cover fractions of grassland ecosystems (i.e., green vegetation, non-photosynthetic vegetation, and soil), which is crucial for our understanding of change processes and their drivers. However, although popular due to straightforward implementation and low computational cost, ‘classical’ SMA relies on a single endmember definition for each targeted ground cover component, thus offering limited suitability and generalization capability for heterogeneous landscapes. Furthermore, the impact of irregular data density on SMA-based long-term trends in grassland ground cover has also not yet been critically addressed. We conducted a systematic assessment of i) the impact of data density on long term trends in ground cover fractions in grasslands; and ii) the effect of endmember definition used in ‘classical’ SMA on pixel- and map-level trends of grassland ground cover fractions. We performed our study for 13 sites across European grasslands and derived the trends based on the Cumulative Endmember Fractions calculated from monthly composites. We compared three different data density scenarios, i.e., complete Landsat data record as is, Landsat data record with the monthly probability of data after 2014 adjusted to the pre 2014 levels, and the combined Landsat and Sentinel-2 datasets. For each site we ran SMA using a selection of site specific and generalized endmembers, and compared the pixel- and map-level trends. Our results indicated no significant impact of varying data density on the long-term trends from Cumulative Endmember Fractions in European grasslands. Conversely, the use of different endmember definitions led in some regions to significantly different pixel- and map-level long term trends confirming questionable suitability of the ‘classical’ SMA for complex landscapes and big areas. Therefore, we caution against using the ‘classical’ SMA for remote sensing based applications across broader scales or in heterogenous landscapes, particularly for trend analyses, as the results may lead to erroneous conclusions.
Earth observation (EO) provides a powerful tool for evidence-based policy-making in the European Union (EU) and globally. We are entering a golden age of EO science, in which the availability of high-quality, everincreasing data converges with the growing demand for monitoring land-use changes and evaluating the impact of policies. This comes at a crucial time, as the EU has recently adopted ambitious environmental and agricultural policies, including the Common Agricultural Policy (CAP), the Regulation on Land Use, Land Use Change and Forestry (EU LULUCF), and the Regulation on Deforestation-free Products (EUDR), whose implementation and effectiveness will rely on robust EO-based monitoring tools. Encouragingly, existing EO capacities, particularly through the Copernicus Programme, already provide a strong foundation for policy support. However, our synthesis reveals that current information products only partially meet the monitoring and compliance needs of these policies. Fully unlocking the potential of EO will require advancements in temporal resolution (approaching near-real-time), spatial resolution (<= 5 m), and rigorous uncertainty quantification. The forthcoming Copernicus Expansion and Next Generation missions can help close these gaps, particularly if new products are co-designed with stakeholders and end-users. By strategically aligning technical innovations with policy priorities, EO stands to become a transformative enabler of the EU's sustainability ambitions.
Biodiversity science requires effective tools to predict patterns of species diversity at multiple temporal and spatial scales. The Dynamic Habitat Indices (DHIs) are remotely sensed indices that summarize aboveground vegetation productivity in a way that is ecologically relevant for biodiversity assessments. Existing global DHIs, derived from MODIS at 1-km resolution, predict species richness at broad scales well, but that resolution is coarse relative to the grain at which many species perceive their habitat. With the much finer spatial resolution of Sentinel-2 and Landsat data, plus Landsat's longer data record, it is possible to track potential changes of vegetation and its impacts on biodiversity at a finer grain over longer periods. Here, our main goals were to derive the DHIs from 10-m Sentinel-2, 30-m Landsat, and 250-m MODIS data for the conterminous US and compare all DHIs at two spatial extents, and to evaluate the ability of these DHIs to predict bird species richness in 25 National Ecological Observatory Network terrestrial sites. In addition, we derived the Landsat DHIs for 1991-2000 and investigated how they changed by 2011-2020. We found that the Sentinel-2, Landsat, and MODIS DHIs were highly correlated when summarized by ecoregion (Spearman correlation ranging from 0.89 to 0.99), indicating good agreement between them and that we were able to overcome the lower temporal resolution of Sentinel-2 and Landsat. Sentinel-2 and Landsat DHIs outperformed MODIS in modeling species richness for all bird guilds, explaining up to 49% of variance of grassland affiliates in linear regression models. Furthermore medium-resolution DHIs (10-30 m resolution) captured spatial heterogeneity much better than MODIS DHIs. We observed considerable changes in Landsat DHIs from 1991-2000 to 2011-2020, such as increased cumulative DHI along the West Coast, in mountain ranges, and in the South, but lower cumulative DHI in the Midwest. Our newly derived DHIs for the conterminous US have great potential for use in biodiversity science and conservation.
Intermediate crops are grown between main crops to protect soils and nutrients when fields would otherwise be bare. Despite being an essential constituent of cropping systems, spatial information on intermediate crops is scarce. Here, we propose a classification algorithm that combines field data, satellite imagery from multiple optical sensors and synthetic-aperture radar (SAR) data to map intermediate crops across Brandenburg, Germany. We trained random forest models using different sets of input features, including spectral-temporal metrics from optical data, metrics derived from SAR data and information on the scheduled main crop. The best classification was based on a combination of all input features and achieved an overall accuracy of 92.9%. Intermediate crops were overestimated, which can be partly attributed to misclassification of volunteers and weeds as intermediate crops. The overestimation was mitigated by aggregating results to the field level. Our results highlight the need for good optical data coverage during autumn and winter to accurately map intermediate crops while demonstrating the ability of SAR data to enhance classification accuracy. Overall, our study shows the potential of remote sensing methods to capture the characteristics of intermediate crops and derive spatially explicit data for monitoring sustainable agricultural practices.
Continuous winter cover on croplands reduces soil erosion and enhances soil organic carbon, making it essential for climate-smart agriculture and greenhouse gas mitigation. However, spatially and temporally explicit data on winter cropland cover remain limited across Europe. We present a national-scale assessment of winter cropland cover in Germany from 2017 to 2023 using spectral unmixing-derived fractional cover time series from Sentinel-2 and Landsat imagery. Four winter cover types were distinguished: winter crops, green cover (including cover crops and spontaneous vegetation), residue cover, and no cover (bare soil). Phenological metrics were derived for green cover to assess vegetation duration, biomass accumulation, and termination type.Our results reveal an increasing share of green cover, rising from 17 % in 2017/18 to 21 % in 2022/23, and a decline in bare soil from 20 % to 12 %, indicating a shift toward more protective winter management. Green cover was most frequent in northwestern and southern Germany, while bare soil remained prevalent in central and eastern regions. Classification results showed good agreement with Integrated Administration and Control System (IACS) parcel-level records of winter cover crops (F1-Score = 0.68) and agricultural census data at the federal state level (R2 = 0.82, MAE = 5 percentage points). Remote sensing estimates consistently exceeded reported cover crop shares, reflecting the presence of non-subsidized or spontaneous vegetation. Our approach provides valuable input for enhanced erosion and carbon modeling and establishes a basis for monitoring and future evaluation of Common Agricultural Policy (CAP) instruments, including Good Agricultural and Environmental Conditions (GAEC) standards.
This study introduces a novel approach for mapping annual fractional vegetation cover in Sub-Saharan rangelands. We used Sentinel-2 time series data from October 2022 to October 2023 to derive phenological metrics, including the dry season integral and rate of greenness decline after peak season. Phenological metrics effectively separate woody vegetation from herbaceous plants based on their distinct seasonal patterns, enabling knowledge-based identification of woody, herbaceous and bare surface endmembers by extending the traditional spectral feature space to a phenological feature space (PFS). Our method was robust across precipitation gradients, consistently producing a triangular-shaped PFS. The regression-based unmixing model, trained using simulated mixtures generated from pure endmember time series signals, showed promising predictive performance at 10-m resolution. Validation using unmanned aerial vehicle imagery revealed mean absolute errors of 11.87 %, 13.57 %, and 14.47 % for woody, herbaceous, and bare surface cover respectively, with the model explaining 68 %, 58 %, and 62 % of the variance in these respective cover types. The 10-m resolution maps provide a detailed representation of continuous transitions between vegetation types in semiarid rangelands, and detect distinct spatial patterns associated with rangeland management practices, such as woody vegetation removal. The complementary use of phenometrics for knowledge-based endmember selection and full spectraltemporal information as model input yielded better results than using phenometrics alone. Future applications of this method can potentially enable assessment of temporal trends in cover fractions across multiple years. This study represents a substantial advancement in monitoring capabilities for vegetation composition in African semi-arid environments, offering a foundation for more comprehensive understanding of human-environmental interactions in these ecosystems.
The convergence of artificial intelligence (AI) and Earth observation (EO) technologies has brought geoscience and remote sensing into an era of unparalleled capabilities. AI's transformative impact on data analysis, particularly derived from EO platforms, holds great promise in addressing global challenges, such as environmental monitoring, disaster response, and climate change analysis. However, the rapid integration of AI necessitates a careful examination of the dimensions of responsibility inherent in its application within these domains. In this article, we represent a pioneering effort to systematically review the intersection of AI and EO, with a central focus on responsible AI practices. Specifically, we identify several critical components guiding this exploration from both academia and industry perspectives within the EO field: AI and EO for social good, mitigating unfair biases, AI security in EO, geoprivacy and privacy-preserving measures, and also maintaining scientific excellence, open data, and guiding AI usage based on ethical principles. Furthermore, the article explores potential opportunities and emerging trends, providing valuable insights for future research endeavors.
 Sebastian van der Linden合作论文数Geomatics Lab, Humboldt-Universität zu Berlin68
 Tobias Kuemmerle合作论文数Conservation Biogeography Lab, Humboldt-Universität zu Berlin;Geography Department, Humboldt University Berlin44
 Dirk Pflugmacher合作论文数Department of Forest Science, Oregon State University42
 Akpona Okujeni合作论文数Geomatics Lab, Humboldt-Universität zu Berlin40
 Volker Radeloff合作论文数Russell Labs, Department of Forest and Wildlife Ecology, College of Agricultural & Life Sciences, University of Wisconsin-Madison33
 Patrick Griffiths合作论文数Humboldt-Universität zu Berlin;Geomatics Lab - Department of Geography;Geomatics Lab, Humboldt-Universität zu Berlin32
 Philippe Rufin合作论文数Humboldt Univ, Geog Dept, Unter Linden 6, D-10099 Berlin, Germany29
 Marcel Schwieder合作论文数Geography Department, Humboldt-Universität zu Berlin29
 David Frantz合作论文数25
 Andreas Rabe合作论文数23
 Pedro J. Leitao合作论文数Centro de Ecologia Aplicada Prof. Baeta Neves, Instituto Superior de Agronomia21
 Franz Schug合作论文数Geog Dept, Humboldt Univ18
 Cornelius Senf合作论文数17
 Daniel Müller合作论文数Department of Structural Development of Farms and Rural Areas, Leibniz Institute of Agricultural Development in Transition Economies;Department of Geography, Humboldt-Universität zu Berlin16
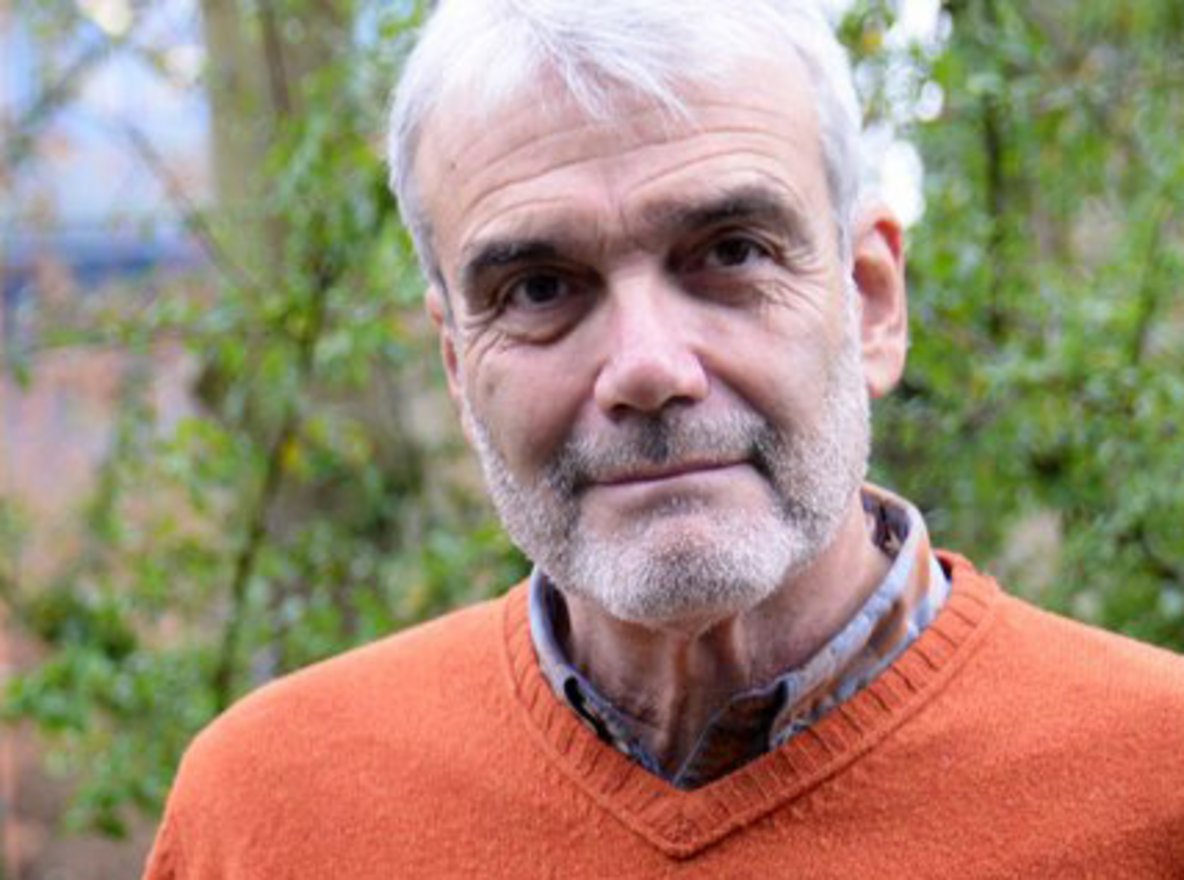 Joachim Hill合作论文数Fachbereich VI - Raum- und Umweltwissenschaften
Umweltfernerkundung und Geoinformatik, Universität Trier16
Joachim Hill合作论文数Fachbereich VI - Raum- und Umweltwissenschaften
Umweltfernerkundung und Geoinformatik, Universität Trier16 Matthias Baumann合作论文数Klinikum Kassel GmbH16
 Thomas Udelhoven合作论文数Department of Hydrology;University of Trier;Department of Hydrology, University of Trier15
 Alexander Damm合作论文数Geomatics Department, Humboldt-Universität zu Berlin15
 Helmut Haberl合作论文数Institute of Social Ecology, Department of Economics and Social Sciences, BOKU University12
 Katja Kowalski合作论文数Geog Dept, Humboldt Univ11
 Benjamin Jakimow合作论文数Geomatics Lab, Humboldt-Universität zu Berlin11
 Karl Segl合作论文数11
 Sam Cooper合作论文数Geog Dept, Humboldt Univ10
 Jan Knorn合作论文数Geomatics Lab, Humboldt-Universität zu Berlin10
 Mike Wulder合作论文数Canadian Forest Service, Natural Resources Canada9
 Claas Nendel合作论文数Institute of Landscape Systems Analysis, Leibniz Centre for Agricultural Landscape Research9
 Oliver Gruebner合作论文数Humboldt-Universität zu Berlin;Geomatics Lab - Department of Geography;Geomatics Lab, Humboldt-Universität zu Berlin9
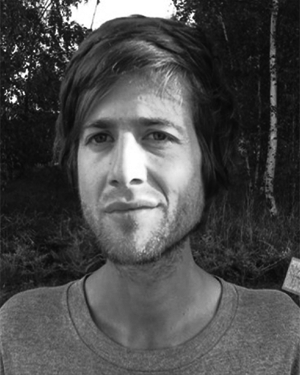 Stefan Suess合作论文数9
 Doris Virag合作论文数Inst Social Ecol, Schottenfeldgasse 29, A-1070 Vienna, Austria8
 hermann kaufmann合作论文数8
 Dominik Wiedenhofer合作论文数Institute of Social Ecology, Department of Economics and Social Sciences, University of Natural Resources and Life Sciences, Vienna8
 Rasmus Fensholt合作论文数Department of Geosciences and Natural Resource Management, University of Copenhagen8
 Björn Waske合作论文数Faculty of Electrical and Computer Engineering, University of Iceland8
 Tobia Lakes合作论文数Department of Geography, Humboldt-Universität zu Berlin8Stefan Erasmi合作论文数8
 Achim Röder合作论文数Remote Sensing Department, Universität Trier8
 Sabine Chabrillat合作论文数Sensing Section, Remote8
 Alexander Prishchepov合作论文数Department of Geosciences and Natural Resource Management, Faculty of Science, University of Copenhagen7
 Katarzyna Ewa Lewińska合作论文数SILVIS Lab, University of Wisconsin‐Madison7
 Patrick Meyfroidt合作论文数Land Systems for Sustainability Lab, Universite Catholique de Louvain7
 Curtis E. Woodcock合作论文数Department of Earth and Environment, College of Arts & Sciences, Boston University7
 Hannes Mueller合作论文数6
 Daniel Scheffler合作论文数Geog Dept, Humboldt Univ6
 He Yin合作论文数6
 Christian Levers合作论文数Geography Department, Humboldt-Universität zu Berlin6
 Ole Mertz合作论文数Department of Geosciences and Natural Resource Management, University of Copenhagen6
 Eric Lambin合作论文数Department of Earth System Science, Doerr School of Sustainability, Stanford University;Woods Institute for the Environment, Stanford University;Université Catholique de Louvain6
 Zhe Zhu合作论文数Department of Natural Resources and the Environment, College of Agriculture, Health and Natural Resources, University of Connecticut6
 Uta Heiden合作论文数German Remote Sensing Data Center (DLR-DFD), Dept. of Environment and Geoinformation Oberpfaffenhofen6




