The aim of this study was to assess the frequency and metabolic characteristics of post-OGTT hypoglycaemia during an OGTT in individuals newly diagnosed with type 2 diabetes. We analysed 97 extended (180 min) 75 g OGTTs from individuals newly diagnosed with type 2 diabetes. Glucose, insulin and C-peptide were measured at fasting and post-challenge time points. Insulin sensitivity was assessed using the oral glucose insulin sensitivity (OGIS) index and beta cell function was measured using the insulinogenic index (IGI) and Stumvoll’s second-phase index. All participants were assigned to the Ahlqvist diabetes clusters. Post-OGTT hypoglycaemia (glucose ≤3.9 mmol/l at 180 min) occurred in 8.2
Abstract Background and aims Despite its clinical benefits, DOAC is associated with 1–2% annual incidence of ischemic stroke, while major bleeding and intracranial hemorrhage occur at rates up to 3.6% and 0.5%, respectively. Consequently, DOAC have become highly relevant during acute ischemic and hemorrhagic stroke where rapid assessment of anticoagulation status is crucial to guide decision-making regarding thrombolysis and anticoagulation reversal. Point-of-care testing have consistently shown weak correlations for apixaban across all platforms. This study aims to evaluate the diagnostic performance of the novel MedicQuant platform for quantitative assessment of apixaban plasma concentrations in blood samples from real-life patients. Methods Plasma obtained by centrifugation from patients receiving apixaban was analyzed using the MedicQuant platform. Liquid chromatography–tandem mass spectrometry (LC-MS/MS) was used for device calibration. Method comparison of laboratory-based calibrated factor-Xa activity (fXa) and MedicQuant platform was performed against LC-MS/MS measurements. Results Conclusions Our study supports the feasibility of quantitative assessment of apixaban plasma concentrations up to 200 ng/mL using the MedicQuant platform. This is the first study to demonstrate a point-of-care test yielding results comparable to those obtained using laboratory-based calibrated factor-Xa activity. Validation studies in emergency settings are required. Conflict of interest JM, AP and SH: Nothing to disclose IB: acted as paid speaker in the past for CSL Behring, Siemens Healthcare Diagnostics Products, AstraZeneca, Octapharma. Performed contract research for Siemens Healthcare Diagnostics Products and Behnk Elektronik and is a member of the advisory board of Alexion and of the expert group of CSL Behring and Siemens Healthcare Diagnostics Products. JD, L.D.F.N and M.H.-B are employed in MedicQuant, an in vitro diagnostic company, specializes in the quantification of DOACs. L.D.F.N and M.H.-B are co-founders of MedicQuant. SP: research support from BMS/Pfizer, Boehringer Ingelheim, Daiichi Sankyo, Helena Laboratories, and Werfen, as well as speakers’ honoraria and consulting fees from Alexion, AstraZeneca, Bayer, Boehringer Ingelheim, BMS/Pfizer, Daiichi Sankyo, Portola, and Werfen, all outside of the submitted work Table 1 - belongs to Results Figure 1 - belongs to Results Figure 2 - belongs to Results
BACKGROUND AND PURPOSE:Metabolic dysfunction-associated steatohepatitis (MASH) is linked to activation of hepatic stellate cells (HSCs) to α-smooth muscle actin-positive myofibroblasts that produce collagen and proinflammatory cytokines. Quiescent HSCs express the NO-cGMP signalling axis. Modulating this pathway could alter HSC activation and fibrosis during MASH progression. EXPERIMENTAL APPROACH:Using transgenic cGMP sensor mice, we monitored NO-induced cGMP in living HSCs. The relevance of this pathway was analyzed using HSC-specific mouse models, ApoE-deficient mice on high-fat diet as a MASH model, human liver sections, and published scRNA-seq datasets. For pharmacological activation of NO-cGMP signalling, BAY-543, an activator of NO-sensitive guanylyl cyclase (NO-GC) was used. KEY RESULTS:HSCs in primary culture and liver tissue generated NO-induced cGMP and expressed NO-GC and cGMP-dependent protein kinase type I (cGKI). Compared to controls, HSC-specific cGKI knockout livers showed enhanced myofibroblast marker expression, indicating increased HSC activation and MASH susceptibility. MASH mice developed steatosis, fibrosis, and inflammation, and showed a high number of HSCs expressing NO-GC and cGKI. cGKI expression was also increased in human fibrotic livers as compared to healthy tissue. In MASH livers, oxidative stress could lead to reduced sensitivity of NO-GC to NO. Treatment of MASH mice with BAY-543, which targets oxidized/NO-insensitive NO-GC, significantly attenuated HSC activation, inflammation, collagen deposition, macro-steatosis, fibrosis, and serum liver enzymes. CONCLUSION AND IMPLICATIONS:The NO-cGMP-cGKI axis serves as both a functional pathway marker and regulator of HSCs. Pharmacological elevation of cGMP with an NO-GC activator represents a promising therapeutic strategy for MASH.
Objectives: The anti-TPO assays are known for the method variability. The new aTPOII assay (Siemens Healthineers) has a different TPO antigen and detecting antibody source and it is also traceable to another international standard compared to the old aTPO assay (Siemens Healthineers). The aims of this study were to verify the new assay through a method comparison (n=860) with the old aTPO assay from the same manufacturer and to verify the reference range (n=60) on Atellica Immunoanalyzer (Atellica IM). Methods: A total of 860 patient serum samples were measured using the Atellica IM aTPO and Atellica IM aTPOII assays and the positive percent agreement, negative percent agreement, and overall percent agreement (OPA) were calculated along with their corresponding 95 % confidence interval (CI). The reference interval verification on 60 euthyroid patient samples was done. Results: In view of the substandard quantitative agreement between methods, a qualitative assay comparison was performed and demonstrated that there was good sensitivity (81.5 %; 95 % CI: 77.1-85.3 %), specificity (99.6 %; 95 % CI: 98.6-99.9 %) and OPA (92.6 %; 95 % CI: 90.6-94.1 %). The computed Cohen kappa was 0.84 (95 % CI: 0.80-0.88) which reflects a very good strength of qualitative agreement. The manufacturer's reference interval (cut-off <= 13.8 U/mL) was verified and confirmed. Conclusions: Using the new aTPOII assay more patients will have negative results. Even though assays claim to be referenced to the corresponding WHO International reference preparation, this standardization does not ensure cut-offs and/ or results that are identical and does not guarantee method agreement and assays could not be used interchangeably.
Abstract Personalized medicine has advanced in diabetology over the past decade. Diabetes is diagnosed based on measures of glycaemia, i.e. glycated hemoglobin (HbA 1c ) and glucose, and the classification distinguishes type 1, type 2, gestational diabetes, and specific forms. Especially type 2 diabetes has clinically long been recognized as a heterogeneous metabolic disorder driven by diverse pathophysiological mechanisms. Data-driven approaches have identified distinct sub-phenotypes, offering a more nuanced understanding of diabetes and prediabetes heterogeneity. Identified subgroups differ in clinical characteristics, the risk of disease progression and developing long term complications. Implementing pathophysiology-based classification and emerging therapeutic decision tools requires additional laboratory biomarkers to estimate beta-cell function and insulin resistance. Fasting C-peptide has emerged as the most informative and broadly applicable biomarker and analytical comparability between laboratories has become a prerequisite for translating research findings into guidelines and clinical practice. Efforts to standardize C-peptide measurement have shown that results from different laboratories and assay manufacturers vary widely, even when using the same WHO reference material. Studies consistently demonstrate that recalibrating assays with serum-based, matrix-appropriate reference samples – rather than pure reference reagents – greatly improves agreement across methods. Although a full reference measurement system is now available, significant variability persists and broad implementation remains incomplete despite compelling evidence supporting its effectiveness. The remaining challenge is therefore no longer the development of appropriate reference materials or analytical procedures, but their consistent implementation across manufacturers. Addressing this final step is essential for enabling personalized diabetes care and will ultimately benefit both patients and manufacturers by improving clinical decision-making.
Human skeletal muscle is the principal site of insulin-stimulated glucose disposal and a major mediator of exercise-induced metabolic benefits, yet human models that preserve metabolic and exercise responsiveness remain limited. We generated primary human skeletal muscle organoids from donor-derived CD56+ myoblasts using a collagen-based extracellular matrix and serum-free IGF1-guided differentiation. The organoids formed aligned contractile tissues containing oxidative and glycolytic fiber type-like myotubes, displayed enhanced mitochondrial respiration, insulin-stimulated glucose uptake, and reproducible force generation. Electrical pulse stimulation induced AMPK activation, increased glucose utilization and lactate production, and upregulated canonical exercise-responsive genes including NR4A3 and PPARGC1A. Notably, transcriptional responses to in vitro exercise overlapped with acute exercise responses observed in skeletal muscle biopsies from the same donors. The organoids further detected functional impairments of skeletal muscle performance induced by TGF-β1 and metformin and increased speed generation by testosterone treatment. These findings establish a donor-specific human skeletal muscle platform that recapitulates key features of insulin action and exercise adaptation and may enable mechanistic studies of skeletal muscle metabolism, exercise responsiveness, and therapeutic interventions relevant to diabetes.
Introduction and Objective: The natural history of type 2 diabetes (T2D) is characterized by a gradual decrease of insulin sensitivity and characteristically a steep decline of beta cell function short before diagnosis. However, recent data-driven sub-phenotyping has unveiled high-risk clusters of individuals with increased T2D risk, that differ profoundly in body fat distribution, insulin resistance and beta cell function. We here provide first data on their respective phenotypic trajectories before T2D diagnosis. Methods: We included individuals at risk for T2D from the TUEF/TULIP cohort in Tübingen (Germany), who developed T2D during their participation in the study. Each visit included a 75 g oral glucose tolerance test (OGTT) and assessments of body fat distribution were accomplished by whole body MRI and liver fat by H1 spectroscopy. Indexes of insulin sensitivity and beta cell function were calculated from the OGTTs. According to clinical sub-phenotyping we distinguished the high-risk clusters 3 (C3: reduced beta cell function), 5 (C5: high visceral and liver fat, high insulin resistance) and 6 (C6: high visceral fat, high insulin secretion). Results: We included data from n=162 in C3, n=148 in C5 and n=48 in C6 with a mean observation time of 3.5±3.7 years before T2D diagnosis. C3 and C6 showed a significant reduction of insulin sensitivity (ISI Matsuda) but not C5 (C3: pslope=0.048, C6: pslope=0.012, C5: pslope=0.299). However, C5 showed the strongest decline in beta cell function (Adaptation Index, pslope=<0.001), which also declined in C3 (pslope=0.004) but not in C6 (pslope=0.501). Neither visceral nor liver fat slopes indicated significant changes over time, however there was a between-cluster trajectory difference for visceral fat in C5 vs C3, with a slightly steeper slope in C5 (0.058 vs. 0.039, p=0.031). Conclusion: Before the onset of T2D, phenotypic trajectories vary according to clinical sub-phenotypes, opening new avenues for targeted prevention paradigms. Disclosure V. Minelli Faiao: None. D.S. Kulkarni: None. M. Ganslmeier: None. P. Hubert: None. F. Schick: None. A. Peter: None. A. Fritsche: None. N. Stefan: Speaker's Bureau; Current; AstraZeneca. Advisory Panel; Ended; Boehringer Ingelheim International GmbH. Speaker's Bureau; Ended; Boehringer Ingelheim International GmbH. Advisory Panel; Ended; Lilly. Speaker's Bureau; Current; Lilly. Advisory Panel; Ended; Pfizer Inc., Madrigal Pharmaceuticals, Inc. Speaker's Bureau; Ended; Madrigal Pharmaceuticals, Inc. Research Support; Ended; Sanofi. Speaker's Bureau; Current; Sanofi. A.L. Birkenfeld: None. R.J. von Schwartzenberg: None.
AIMS:Elevated fasting glucagon is linked to hyperglycemia, but postprandial glucagon effects are less understood. Recent evidence suggests metabolic benefits of rising glucagon after oral glucose intake, potentially impacting brain-mediated whole-body metabolism. To elucidate the translational relevance of these findings, we studied postprandial effects of glucagon on the human brain. MATERIALS AND METHODS:We performed oral glucose tolerance tests (OGTT) combined with functional magnetic resonance imaging to quantify brain activity and connectivity at fasting, 30 and 120 min post glucose load in 30 volunteers. In 14 participants with suppressed glucagon, low-dose glucagon infusion mimicked non-suppressed glucagon after OGTT. This was compared to 7 participants with endogenous rising glucagon during OGTT. RESULTS:Low-dose glucagon infusion did not elevate plasma glucose levels during OGTT. Also, no changes in insulin sensitivity and insulin secretion were observed. However, experimentally elevating glucagon during OGTT in individuals with physiological suppression of glucagon significantly increased postprandial brain responsivity in the hippocampal gyrus and in brain regions important for the homeostatic and hedonic regulation of food intake as well as systemic metabolism (i.e., hypothalamus and ventral striatum). Most postprandial brain responsiveness during glucagon infusion was directionally consistent with the findings in persons with endogenously rising glucagon. Moreover, the postprandial brain response correlated with the rise in glucagon, regardless of exogenous or endogenous source of glucagon. Although the overall glucagon trajectory during OGTT was not significantly different over the full 0-150 min period, the groups differed at key post-challenge timepoints and in integrated glucagon exposure. Together with the infusion and correlation analyses, this supports a relationship between postprandial glucagon and brain responsivity, while more subtle differences in glucagon kinetics will require larger studies. CONCLUSIONS:Our findings demonstrate postprandial effects of glucagon in metabolically relevant human brain areas. This may underlie the promising effects on body weight achieved with pharmacological multi-agonists that activate the glucagon receptor.
We previously identified six clusters of people at different risks of type 2 diabetes and/or comorbidities, of which cluster 3 (β-cell deficient) and 5 (older age, higher BMI, severe insulin resistance) had a high risk of progression to diabetes. We have now investigated whether cluster 3 and 5 individuals differed from those of the other clusters in changes in insulin sensitivity, insulin secretion, and the development of type 2 diabetes during a long-term reduction of body weight. A total of 190 participants completed a 24-month lifestyle intervention in the Tübingen Lifestyle Intervention Program (TULIP) and were followed up for 8.7 ± 1.6 years. Sixty participants had a weight loss ≥3% (mean reduction of 8%) at the long-term follow-up. Of them, cluster 5 participants (n = 17) had a larger increase of adjusted fasting glycemia compared with the cluster group 1,2,4,6 (n = 33) and cluster 3 (n = 10) and a larger increase of adjusted 2-h glucose levels compared with cluster 3 (all P < 0.05). In cluster 5, a larger decrease of adjusted insulin secretion compared with cluster 3 (P = 0.01) and cluster group 1,2,4,6 (P = 0.05) was observed. Forty-one percent of cluster 5 participants (0% in cluster group 1,2,4,6 and 10% in cluster 3) developed type 2 diabetes. In conclusion, despite a sustained and large amount of weight loss, diabetes risk cluster 5 participants had deterioration of glycemia and insulin secretion and a high risk of type 2 diabetes. If this result can be replicated in a prospective study, people of this cluster would need targeted prevention strategies. ARTICLE HIGHLIGHTS:There may be heterogeneity in the response to a lifestyle intervention to prevent type 2 diabetes. This study investigated whether participants of Tübingen Lifestyle Intervention Program (TULIP) type 2 diabetes risk clusters 3 and 5, who have a very high risk of diabetes, benefit from long-term weight loss following a 2-year lifestyle intervention. Diabetes risk cluster 5 participants had an impaired response regarding improvement of glycemia and insulin secretion and a high risk of developing type 2 diabetes, despite a long-term (9-year) mean weight loss of 8%. Alternative or intensified interventions should be considered for people in Tübingen type 2 diabetes risk cluster 5.
BackgroundResting Energy Expenditure (REE) represents the largest component of total daily energy expenditure. While fat-free mass (FFM) is its primary predictor, substantial interindividual variability remains unexplained. The sympathetic nervous system has been implicated in the regulation of energy expenditure, but its contribution to REE under fasting conditions in humans is not yet determined.MethodsWe investigated the relative contributions of body composition, circulating catecholamines, and cardiac autonomic modulation to REE in 38 healthy young participants following an overnight fast. REE was assessed by indirect calorimetry and FFM by bioelectrical impedance analysis. Cardiac autonomic activity was quantified through heart rate variability (HRV) analysis (time- and frequency-domain). Plasma epinephrine and norepinephrine were determined in a subsample (n = 19).ResultsIn a multivariable model including FFM, sex, and age, FFM was the dominant determinant of REE (R2 = 0.90, p < 0.001). Sex contributed independently, whereas age showed no significant association. Circulating epinephrine was positively associated with REE (p = 0.024), while norepinephrine was not. None of the HRV-derived parameters was significantly associated with REE.ConclusionUnder basal fasting conditions, REE is primarily associated with FFM, with an additional association with circulating epinephrine. Given the absence of associations with norepinephrine and HRV-derived parameters, the findings suggest a potential role of circulating catecholamines in interindividual variability in REE. However, direct conclusions regarding the physiological mechanisms involved cannot be drawn from the present observational study. HRV-derived cardiac autonomic markers were not associated with REE under standardized fasting conditions.
BACKGROUND:The Sysmex CN-6000 is a fully automated high-throughput coagulation analyzer. The objective of this study was to evaluate the analytical performance of the analyzer for routine and special coagulation testing in a high-throughput central laboratory of a university hospital. METHODS:The within- and between-day precision and accuracy of 29 coagulation parameters were evaluated on the Sysmex CN-6000 using commercially available quality control materials. Patient plasma samples were used to compare results of coagulation measurements between the Sysmex CN-6000 and the Atellica COAG 360, including plasma samples with visual interference. The sample throughputs of both analyzers were compared using plasma samples from healthy volunteers. RESULTS:Within- and between-day coefficients of variation were acceptable for all assays tested on the Sysmex CN-6000. High correlation and good agreement were observed when comparing coagulation results from the Sysmex CN-6000 and the Atellica COAG 360. Samples with visual interference showed comparable coagulation results between the two analyzers, with slightly better detection by the Sysmex CN-6000. The sample throughput per hour for analysis of a panel of five coagulation parameters was higher with the Sysmex CN-6000 compared to the Atellica COAG 360 (247 vs. 193 tests). CONCLUSIONS:The Sysmex CN-6000 demonstrated excellent analytical performance for a large number of coagulation parameters and has a high throughput capacity, ideal for the needs of a central laboratory with a high volume of routine and specialized coagulation testing.
Clinical practice guidelines recommend defined weight loss goals for the prevention of type 2 diabetes (T2D) in those individuals with increased risk, such as prediabetes. However, achieving prediabetes remission, that is, reaching normal glucose regulation according to American Diabetes Association criteria, is more efficient in preventing T2D than solely reaching weight loss goals. Here we present a post hoc analysis of the large, multicenter, randomized, controlled Prediabetes Lifestyle Intervention Study (PLIS), demonstrating that prediabetes remission is achievable without weight loss or even weight gain, and that it also protects against incident T2D. The underlying mechanisms include improved insulin sensitivity, β-cell function and increments in β-cell-GLP-1 sensitivity. Weight gain was similar in those achieving prediabetes remission (responders) compared with nonresponders; however, adipose tissue was differentially redistributed in responders and nonresponders when compared against each other-while nonresponders increased visceral adipose tissue mass, responders increased adipose tissue in subcutaneous depots. The findings were reproduced in the US Diabetes Prevention Program. These data uncover essential pathways for prediabetes remission without weight loss and emphasize the need to include glycemic targets in current clinical practice guidelines to improve T2D prevention.
Introduction and Objective: Prediabetes remission has beneficial effects for type 2 diabetes (T2D) prevention. However, it is unknown whether early remission is superior to late remission. Thus, we investigated if reaching prediabetes remission early during a lifestyle intervention is associated with lower T2D risk compared to reaching remission later on. Methods: We studied 865 individuals with prediabetes from the German multi-center Prediabetes Lifestyle Intervention Study (PLIS) who could be classified into early remission at 6 months of a lifestyle intervention (ER, n = 217), late remission at 12 months (LR, n = 110), or no remission (NR, n = 538). Prediabetes remission was defined as return to normal glucose regulation and normalized HbA1c according to ADA criteria. Cox regression models were fit with age, sex, intervention intensity, T2D risk and weight loss as covariates. Results: The ER group (n=217) was comparable in age (p=0.24), sex distribution (p = 0.07), BMI (p > 0.99), insulin sensitivity (p = 0.2) and insulin secretion (p = 0.48) vs the LR group (n=110). Fasting glucose (5.70 ±0.43 mmol/L vs 5.83 ±0.44, p = 0.016) and HbA1c (5.53 ±0.29 % vs 5.68 ±0.31, p < 0.001) was slightly lower in ER compared to LR, while 2h glucose was similar (p = 0.77). Overall, T2D risk was lower in both ER and LR compared to NR (n=538; RR 0.15 [95% CI: 0.07-0.31], p < 0.001 and 0.44 [0.23-0.82], p = 0.009, respectively). However, ER provided a more pronounced T2D risk reduction than LR (0.31 [0.12-0.79], p = 0.01). Conclusion: Achieving early remission of prediabetes to NGR during lifestyle intervention may provide additional benefits for T2D prevention compared with late remission. A. Sandforth: None. L. Sandforth: None. S. Katzenstein: None. J. Seissler: None. N. Perakakis: Other Relationship; Novo Nordisk, Lilly Diabetes. Advisory Panel; Bayer Pharmaceuticals, Inc. Other Relationship; APOGEPHA, Transmedac Innovations AG, GWT-TUD, Elbe-Gesundsheintszentrum GmbH, Open Exploration. R. Wagner: Speaker's Bureau; Boehringer-Ingelheim, Novo Nordisk. Advisory Panel; Sanofi. Speaker's Bureau; Sanofi. Advisory Panel; Lilly Diabetes. A. Peter: None. R. Lehmann: None. H. Preissl: None. I. Yurchenko: None. J. Szendroedi: Advisory Panel; Novo Nordisk, Lilly Diabetes, Novartis AG, Boehringer-Ingelheim. M. Blüher: Advisory Panel; AstraZeneca. Speaker's Bureau; Amgen Inc. Advisory Panel; Bayer Pharmaceuticals, Inc, Boehringer-Ingelheim. Speaker's Bureau; Daiichi Sankyo. Advisory Panel; Eli Lilly and Company, Novo Nordisk, Nestlé Health Science, Sanofi-Aventis Deutschland GmbH. A. Schürmann: None. S. Kabisch: Research Support; Almond Board California, California Walnut Commission. Other Relationship; JuZo-Akademie, Boehringer-Ingelheim. Research Support; J. Rettenmaier & Söhne. Other Relationship; Lilly Diabetes. Research Support; Wilhelm-Doerenkamp-Foundation. K. Mai: None. P.E. Schwarz: None. M. Heni: Advisory Panel; Amryt Pharma. Speaker's Bureau; Amryt Pharma, AstraZeneca, Boehringer-Ingelheim. Advisory Panel; Boehringer-Ingelheim. Speaker's Bureau; Lilly Diabetes, Novartis AG, Novo Nordisk, Sanofi. M. Roden: Research Support; Boehringer-Ingelheim. Advisory Panel; Echosens. Speaker's Bureau; Madrigal Pharmaceuticals, Inc. Advisory Panel; MSD Life Science Foundation. Board Member; Novo Nordisk. Advisory Panel; TARGET PharmaSolutions, Inc. N. Stefan: Speaker's Bureau; AstraZeneca, Boehringer-Ingelheim. Consultant; Lilly Diabetes. Speaker's Bureau; Lilly Diabetes. Consultant; Pfizer Inc. Speaker's Bureau; Sanofi. Research Support; Sanofi. Speaker's Bureau; Novo Nordisk, GlaxoSmithKline plc. Consultant; GlaxoSmithKline plc. A. Fritsche: Advisory Panel; Abbott. Speaker's Bureau; AstraZeneca. A.L. Birkenfeld: None. R. Jumpertz von Schwartzenberg: None.
OBJECTIVE:Individuals at increased risk of type 2 diabetes have recently been classified into six prediabetes clusters, which stratify the risk of progression to diabetes and diabetes complications. Clusters 1, 2 and 4 are low-risk clusters while clusters 3, 5 and 6 are high-risk clusters; individuals in cluster 6 have an elevated risk of nephropathy and all-cause mortality despite delayed onset of diabetes. The urinary peptidome classifiers CKD273 (chronic kidney disease, CKD), HF2 (heart failure, HF) and CAD238 (coronary artery disease, CAD) are based on unique urinary peptide patterns and have shown potential for identifying individuals at risk for CKD and cardiovascular pathologies. This observational study investigates whether peptidome classifiers can differentiate complication risks across the prediabetes clusters and if a novel combination of peptides can distinguish high-risk from low-risk prediabetes clusters. METHODS:Urine peptidome analysis was performed on spot urine samples from individuals across 6 prediabetes clusters (n = 249) and 19 individuals with screen-detected diabetes (study cohorts at University Hospital Tübingen, Germany from 11/2004 to 11/2012). Predefined urinary classifiers were calculated for each participant. Lasso regression analysis was used to identify an optimal combination of peptides distinguishing low- Schlesinger et al. (2022), Wagner et al. (2021) [1,2,4] and high-risk (Rooney et al., 2021; Wagner, 2023; Latosinska et al., 2021 [3,5,6]) clusters. RESULTS:The predefined urinary peptidome classifiers CKD273, HF2 and CAD238 differed significantly across prediabetes clusters, particularly with elevated values in cluster 6 compared to the healthiest cluster 2. CKD273, HF2 and CAD238 were inversely associated with insulin sensitivity indexes. Machine Learning identified a combination of 112 urinary peptides that differentiated low-risk from high-risk prediabetes clusters (AUC-ROC 0.868 (95 % CI 0.755-0.981)). CONCLUSIONS:Urinary peptidome classifiers support the increased risk of CKD and suggest an elevated risk of heart failure and coronary artery disease in the high-risk prediabetes cluster 6. Urine peptidomics show promising potential as a tool for identifying high-risk prediabetes individuals and guiding early preventive interventions.
BACKGROUND:An impaired β-cell function is a key contributor to the pathophysiology of diabetes mellitus that can be estimated by the biomarker C-peptide. Measurement of C-peptide can therefore be used for prediction, diagnosis, and subclassification of diabetes. Furthermore, C-peptide assists in the prediction of therapeutic response and guiding therapeutic decisions. To support diabetes classification, the American Diabetes Association (ADA) and the European Association for the Study of Diabetes (EASD) have recently introduced serum C-peptide cut-off values in their guidelines: <0.2 nmol/L C-peptide levels suggest the presence of type 1 DM while C-peptide levels >0.6 nmol/L indicate type 2 DM. However, analytical aspects limit the clinical utility of these defined cut-off values since standardization of C-peptide measurements has not been achieved. Results from different assay manufacturers still show significant variability. RESULTS:This discrepancy can have significant consequences, as reliance on C-peptide testing for diabetes classification and therapeutic decisions has steadily increased in recent years. Although there have been growing calls to standardize C-peptide testing and a process for standardization has been established, standardization has unfortunately yet to be implemented in practice. CONCLUSION:It therefore seems appropriate for health care providers to advocate for standardized C-peptide measurements, which is more or less in the hands of the manufacturer of the C-peptide assays, to improve diagnostic accuracy and patient safety.
Identification of previous SARS-CoV-2 infection typically relies on serology, yet T-cells play a key role in the adaptive immune response against SARS-CoV-2. Here, we investigated in parallel the SARS-CoV-2-specific as well as endemic human coronavirus-specific humoral and cross-reactive cellular responses in children and adults. We analyzed clinical data and blood samples from a family cohort of 96 children and 144 adults at 3-4 and 11-12 months after their first contact with SARS-CoV-2. Humoral response was assessed by a multiplex immunoassay with high sensitivity and specificity (MULTICOV-AB). Cellular responses were analyzed by IFN-γ ELISPOT using four different established epitope compositions (ECs) to discriminate between SARS-CoV-2 specific and HCoV cross-reactive T-cell responses. While the majority of adults had a combined serological and T-cell response, relatively more children had a T-cell response alone rather than a combined response. The magnitude of the T-cell response correlated with symptoms and the humoral response. In addition, SARS-CoV-2 infection significantly boosted the endemic coronavirus-specific cellular response. Overall, our data suggest discordant humoral and cellular responses, reflecting either abortive infection, cellular sensitization with rapid viral clearance or rapid antibody waning or a combination of these phenomena. Restricting epidemiologic analysis to SARS-CoV-2 serological data may underestimate rates of infection with or at least exposure to SARS-CoV-2 in children.
Introduction and Objective: Current guidelines recommend weight loss targets for individuals at risk for type 2 diabetes (T2D). Prediabetes is a high-risk state for T2D, and remission of prediabetes during weight loss has additional benefits for T2D prevention. Thus, we hypothesized that reaching glycemic targets is a more effective strategy for T2D prevention than weight loss targets. Methods: We studied 903 individuals with prediabetes from the German Prediabetes Lifestyle Intervention Study for whom data for weight loss and glycemic category classification was available. Glucose regulation was assessed by a 75 g oral glucose tolerance test. Prediabetes remission was defined as return to normal glucose regulation and normalized HbA1c according to ADA criteria. T2D risk was compared between responders and non-responders (R and NR) who lost weight (WL, n=298; < -5% of initial body weight), remained weight stable (WS, n=371; -5-0%) and gained weight (WG, n=234; >0%). Cox regression models were fit with age, sex and intervention intensity as covariates. Results: At baseline, age (p=0.11), fasting glucose (p=0.09), 2-hour glucose (p=0.98) and beta cell function were comparable between all three responder groups. WL-, WS- and WG-response was similarly protective from developing future T2D (HR for WL R vs. WL NR 0.11 [95 CI: 0.03-0.36], p = 0.00026, HR for WS R vs. WS NR 0.40 [95 CI: 0.17-0.93], p = 0.033, HR for WG R vs. WG NR 0.25 [95 CI: 0.09 -0.69], p = 0.0072,). T2D risk did not differ between weight loss strata (HR 0.82 [95 CI: 0.54-1.25], p = 0.36 for WS-R vs WG-R; and HR 0.91 [0.64-1.30], p = 0.61 for WL-R vs WG-R). Conclusion: Prediabetes remission, i.e. glycemic targets rather than weight loss targets, should be the primary treatment goal for T2D prevention. A. Sandforth: None. L. Sandforth: None. S. Katzenstein: None. J. Seissler: None. N. Perakakis: Other Relationship; Novo Nordisk, Lilly Diabetes. Advisory Panel; Bayer Pharmaceuticals, Inc. Other Relationship; APOGEPHA, Transmedac Innovations AG, GWT-TUD, Elbe-Gesundsheintszentrum GmbH, Open Exploration. R. Wagner: Speaker's Bureau; Boehringer-Ingelheim, Novo Nordisk. Advisory Panel; Sanofi. Speaker's Bureau; Sanofi. Advisory Panel; Lilly Diabetes. A. Peter: None. R. Lehmann: None. H. Preissl: None. I. Yurchenko: None. J. Szendroedi: Advisory Panel; Novo Nordisk, Lilly Diabetes, Novartis AG, Boehringer-Ingelheim. M. Blüher: Advisory Panel; AstraZeneca. Speaker's Bureau; Amgen Inc. Advisory Panel; Bayer Pharmaceuticals, Inc, Boehringer-Ingelheim. Speaker's Bureau; Daiichi Sankyo. Advisory Panel; Eli Lilly and Company, Novo Nordisk, Nestlé Health Science, Sanofi-Aventis Deutschland GmbH. A. Schürmann: None. S. Kabisch: Research Support; Almond Board California, California Walnut Commission. Other Relationship; JuZo-Akademie, Boehringer-Ingelheim. Research Support; J. Rettenmaier & Söhne. Other Relationship; Lilly Diabetes. Research Support; Wilhelm-Doerenkamp-Foundation. K. Mai: None. P.E. Schwarz: None. M. Heni: Advisory Panel; Amryt Pharma. Speaker's Bureau; Amryt Pharma, AstraZeneca, Boehringer-Ingelheim. Advisory Panel; Boehringer-Ingelheim. Speaker's Bureau; Lilly Diabetes, Novartis AG, Novo Nordisk, Sanofi. M. Roden: Research Support; Boehringer-Ingelheim. Advisory Panel; Echosens. Speaker's Bureau; Madrigal Pharmaceuticals, Inc. Advisory Panel; MSD Life Science Foundation. Board Member; Novo Nordisk. Advisory Panel; TARGET PharmaSolutions, Inc. N. Stefan: Speaker's Bureau; AstraZeneca, Boehringer-Ingelheim. Consultant; Lilly Diabetes. Speaker's Bureau; Lilly Diabetes. Consultant; Pfizer Inc. Speaker's Bureau; Sanofi. Research Support; Sanofi. Speaker's Bureau; Novo Nordisk, GlaxoSmithKline plc. Consultant; GlaxoSmithKline plc. A. Fritsche: Advisory Panel; Abbott. Speaker's Bureau; AstraZeneca. R. Jumpertz von Schwartzenberg: None. A.L. Birkenfeld: None.
 Andreas Fritsche合作论文数Abteilung Prävention und Therapie des Diabetes Mellitus, Universitätsklinikum und Medizinische Fakultät Tübingen;Instituts für Diabetesforschung und Metabolische Erkrankungen, Helmholtzzentrums München, Universität Tübingen163
 Norbert Stefan合作论文数Department of Internal Medicine IV, University of Tubingen;Department of Pathophysiology of Prediabetes, Institute of Diabetes Research and Metabolic Diseases, Helmholtz Centre Munich109
 Robert Wagner合作论文数Member of the German Center for Diabetes Research (DZD),, Eberhard Karls University Tübingen109
 Martin Heni合作论文数Medizinische Fakultät, Universität Ulm108
 Andreas Birkenfeld合作论文数Klinik für Diabetologie, Endokrinologie und Nephrologie, Universitätsklinikum Tübingen, University of Tübingen;Department of Diabetology, King’s College London;Helmholtz Munich93
 Hans-Ulrich Haering合作论文数85
 Jürgen Machann合作论文数Univ Tubingen, Helmholtz Ctr Munich, Inst Diabet Res & Metab Dis, Tubingen, Germany85Fritz Schick合作论文数62
 Louise Fritsche合作论文数60
 Hans-Ulrich Häring合作论文数Department of Internal Medicine IV, University of Tübingen;Medical Clinic and Polyclinic, University of Tübingen;III. Medical Department, Hospital München-Schwabing54
 Hörber Sebastian合作论文数53
 Rainer Lehmann合作论文数Department of Internal Medicine IV, University Hospital Tuebingen47
 Konstantinos Kantartzis合作论文数Medizinische Fakultät(),, Universitätsklinikum Tübingen42
 Cora Weigert合作论文数40
 Hubert Preissl合作论文数39Harald Staiger合作论文数35Erwin Schleicher合作论文数33
 Martin Hrabě de Angelis合作论文数Helmholtz Zentrum München GmbH;Technical University München Germany31Hu Häring合作论文数27Miriam Hoene合作论文数27
 Annette Schürmann合作论文数Department of Experimental Diabetology, German Institute of Human Nutrition27
 Stephanie Kullmann合作论文数27M. Heni合作论文数26Alfred Königsrainer合作论文数24
 Michael Roden合作论文数German Diabetes Centre, Heinrich-Heine-Universität Düsseldorf;Clinic for Endocrinology & Diabetology, University Hospital Düsseldorf24
 Reiner Jumpertz-von Schwartzenberg合作论文数NIDDK, Phoenix Epidemiol & Clin Res Branch, NIH, Phoenix, AZ USA23Perakakis Nikolaos合作论文数Department of Internal Medicine II, University Hospital of Freiburg21
 Guowang Xu (许国旺)合作论文数Key Laboratory of Separation Science for Analytical Chemistry, Dalian Institute of Chemical Physics, Chinese Academy of Sciences21Jochen Seißler合作论文数19Julia Hummel合作论文数18Hennige Anita M合作论文数18Stefan Lutz合作论文数18Fausto Machicao合作论文数18
 Andreas Vosseler合作论文数17Kabisch Stefan合作论文数17
 Matthias Bluher合作论文数Department of Medicine, University of Leipzig17
 Axel Franz合作论文数16A. Nelde合作论文数15
 Arvid Sandforth合作论文数15H-U. Haering合作论文数15
 Katsiaryna Prystupa合作论文数14Kovarova Marketa合作论文数14
 Kilian Rittig合作论文数Department of Endocrinology, Diabetes, Vascular Medicine, Nephrology and Clinical Chemistry, University of Tübingen14Johannes Beckers合作论文数13
 Ingvild Birschmann合作论文数13
 Ferruh Artunc合作论文数13
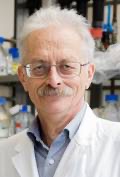 Hans-Georg Rammensee合作论文数Interfaculty Institute for Cell Biology, University of Tübingen;Department of Immunology, University of Tübingen13
 Julia Szendroedi合作论文数12
 Corinna Dannecker合作论文数12




