Abstract. Mixtures of volcanic ash and stratospheric sulfate aerosol (SSA) have been observed by the Atmospheric Chemistry Experiment (ACE), a remote sensing satellite mission in operation since 2004. The migration of the volcanic plumes from the Puyehue-Cordón Caulle eruption in June of 2011 and the Calbuco eruption of April 2015 aligned well with ACE’s sampling pattern, providing extended sampling of volcanic aerosol from these two eruptions. Weak volcanic ash spectral signatures are observed in the presence of SSA in the Southern Hemisphere up to 165 days following the Calbuco eruption and 125 days following the Puyehue-Cordón Caulle eruption. ACE residual spectra of ash-sulfate mixtures were simultaneously modelled to retrieve the line-of-sight column densities and the median particle radii for both ash and SSA. Pure volcanic ash from the Puyehue-Cordón Caulle eruption was modelled with a bimodal lognormal distribution.
Abstract Stratospheric sulfate aerosol (SSA) is an important part of the Earth's climate system. SSA climate impact is determined in part by particle composition, which has been measured from orbit. The weight percent of sulfuric acid in SSA has been determined from atmospheric infrared transmittance spectra recorded with the Atmospheric Chemistry Experiment Fourier Transform Spectrometer (ACE‐FTS) in limb geometry using the Sun as a light source (solar occultation). The global average SSA composition varies from about 50 to 80 percent with lowest values during the Antarctic winter. Atmospheric extinction at a wavelength of 1 μm was included in the analysis to improve the determination of the median radius of the aerosol particles and the slant column particle density. An introduction and overview of the new ACE SSA data product is provided here. The composition and size of SSA particles are key parameters for reliable calculation of radiative transfer needed in climate research.
We present fluorine inventories calculated for twenty years (2004–2023) and five latitude bands (82°–60°N, 60°–30°N, 30°N–30°S, 30°–60°S, and 60°–82°S) at altitudes from the surface up to 55 km. The inventories were calculated using the Atmospheric Chemistry Experiment Fourier transform spectrometer (ACE‐FTS) version 5.2 retrievals of the volume mixing ratios (VMRs) of 15 fluorine‐containing species. Of these 15 species, 3 are product gases: , , , and 12 are source gases: , PFC‐14 (), CFC‐11 (), CFC‐12 (), CFC‐113 (), HCFC‐22 (), HCFC‐141b (), HCFC‐142b (), HFC‐23 (), HFC‐32 (), HFC‐125 (), and HFC‐134a (). As necessary, ACE‐FTS data were supplemented with data from the TOMCAT 3‐D chemical transport model and ground‐based measurements from the National Oceanic and Atmospheric Administration (NOAA) and the Advanced Global Atmospheric Gases Experiment (AGAGE). The total fluorine () profiles are dominated by source gas contributions in the troposphere and lower stratosphere up to 35 km in the tropics (30°N–30°S), 30 km in midlatitudes (60°–30°N/30°–60°S) and 24 km near the poles (82°–60°N/60°–82°S). In this atmospheric region, the primary contributions come from CFCs, HCFCs, carbon tetrafluoride (), and increasingly in recent years HFCs. Above these altitudes increasingly dominates the profile reaching as much as 79% of at 55 km. The 2004–2023 time series of the mean inventories shows a global increase of 48.9 0.7 ppt/year or 1.68 0.02%/year resulting in a mean approaching 3.5 ppb in 2023.
We present a comprehensive data analysis of coincident solar occultation data captured by the ACE satellite, alongside the atmospheric river database derived from MERRA-2 reanalysis through the ARTMIP (Atmospheric River Tracking Method Intercomparison Project) initiative. Our investigation, comparing an atmospheric river catalogue by Guan and Waliser (2015) with experimental ACE data, reveals significant differences in altitude-dependent volume-mixing ratios (VMRs) of several molecules (particularly H2O, HNO3, and O3). These differences are observed in pairs of ACE observations that are closely matched in time and location, with one point falling within an identified atmospheric river and the other outside.Additionally, we demonstrate that these differences in VMR profiles are not attributable to random atmospheric turbulence. This is achieved by contrasting our findings with a randomized set of paired ACE observations, where both data points are situated outside of atmospheric rivers.The obtained results corroborate atmospheric mixing between the troposphere and stratosphere during the passage of an atmospheric river through a specific location. Our findings demonstrate the utility of ACE satellite data in observing atmospheric phenomena associated with atmospheric rivers.
Abstract Spectra of Atoms and Molecules provides advanced undergraduates and graduate students with a working knowledge of the field of spectroscopy. The book illuminates fundamental principles of spectroscopy for chemists, physicists, astronomers, atmospheric scientists, and engineers, with the primary goal of teaching the interpretation of spectra. Highlights include an entirely new chapter on the spectroscopy of clouds and aerosols, as well as the presentation of group theory as needed to understand spectroscopy. Each chapter includes detailed worked examples, plus numerous problems allowing the reader to work with actual experimental data and spectra. Topics include molecular symmetry, matrix representation of groups, quantum mechanics, and group theory. Atomic, rotational, vibrational, electronic and Raman spectra are analyzed as well. This edition clears up the confusing topic of line strengths as needed for quantitative applications.
Version 5.2 SO2 data from the Atmospheric Chemistry Experiment Fourier transform spectrometer (ACE-FTS) in low Earth orbit are used to determine global altitude-latitude abundance distributions. This new data set has SO2 volume mixing ratios (VMRs) from 11.5 to 39.5 km in altitude from February 2004 to July 2023. The average background SO2 abundance is plotted along with the abundance for four different seasons. These distributions show that there is a stratospheric source of SO2 that comes from the decline in sulfate aerosol abundance with increasing altitude. The visible and near-infrared photolysis of sulfuric acid (H2SO4) is the primary source of SO2 in the middle stratosphere. There is also a source of SO2 in the upper stratosphere and mesosphere. The Brewer-Dobson circulation enhances SO2 at higher altitudes, particularly by descent near the winter pole. The elevated abundance of SO2 near the poles originates from meteoric sources as well as UV photolysis of H2SO4 in the mesosphere. Large volcanic eruptions release sulfur dioxide (SO2) into the lower stratosphere, where it persists for several months.
Collision-induced spectra are essential for radiative transfer modeling of Titan's atmosphere. We present experimental spectra of nitrogen–methane mixtures with an accompanying fit of N _2 -CH _4 collision-induced absorption in the 30–400 cm ^−1 region at about 130 K. We found a peak absorption of 2.30 × 10 ^−5 cm ^−1 amagat ^−2 at 75 cm ^−1 and a secondary peak of 1.35 × 10 ^−5 cm ^−1 amagat ^−2 at 206.5 cm ^−1 , which agrees with previous studies. Our work does not support the suggestion that N _2 -CH _4 CIA in the far-infrared should be increased by about 50%, as suggested by spectroscopic modeling of Titan using data from A. Borysow & C. Tang.
ZrO has many low-lying states, and its spectra are essential for the characterization of S-type stars. A high-resolution emission spectrum recorded with a Fourier transform spectrometer at the National Solar Observatory is used for the analysis. The 0–0 and 1–0 bands of the f ^3 Δ–a ^3 Δ system ( α system) and the 0–0 band of the e ^3 Π–a ^3 Δ system ( β system) have been rotationally analyzed using the modern spectral fitting program PGOPHER. New ab initio calculations of transition dipole moments have been performed to determine the band strengths. These band strengths are used to produce line lists that are suitable for the simulation of stellar spectra.
HFC-125 (CF3CHF2, pentafluoroethane) volume mixing ratios (VMRs) have been determined for the first time using infrared absorption spectra from the Atmospheric Chemistry Experiment Fourier transform spectrometer (ACE-FTS) from 2004 to 2024. These VMRs provide global altitude-latitude VMR distributions. A VMR time series for HFC-125 has also been calculated and compared to values from in situ discrete flask measurements conducted by the National Oceanic and Atmospheric Administration Earth System Research Laboratory. The abundance of HFC-125 is currently experiencing exponential growth. ACE data shows a growth rate of 3.47 +/- 0.05 ppt/year in the past six years.
Abstract A classical picture of light scattering and the Raman effect is presented, followed by the quantum mechanical version of Raman scattering. Rotational and vibration-rotation Raman spectra are discussed, along with selection rules. Rayleigh and Raman line strengths are derived.
The spectral analysis of molecule-rich asymptotic giant branch (AGB) stars is challenging. Although other calcium and fluorine bearing molecules are observed in the microwave and in the visible spectrum of AGB stars, CaF has never been detected, despite favorable chemical equilibrium predictions. Yet, measuring the CaF abundance could give more insight into the fluorine budget of AGB stars and allow better simulation of stellar spectra. In this work, we present an analysis of the visible spectrum of CaF obtained with a Fourier transform spectrometer. CaF A ^2 Π− X ^2 Σ ^+ and B ^2 Σ ^+ − X ^2 Σ ^+ band systems were excited with a hollow cathode discharge. Using previous fluorescence spectroscopy measurements, highly accurate ground state constants, and reasonable extrapolation schemes, the strongest features of CaF in the visible spectrum can be accurately modeled for both band systems. Spectroscopic constants are determined for A ^2 Π with v ≤ 16 and for B ^2 Σ ^+ with v ≤ 20. Ab initio transition dipole moment curves of both transitions were calculated and scaled, and we provide a line list with Einstein A coefficients and oscillator strengths. This line list can be used to simulate spectra of CaF at temperatures and pressures relevant to astrophysical environments.
Indonesia's Ruang volcano erupted on April 16, 2024, with subsequent eruptions on April 17 and 30. The resulting plume was observed rising to altitudes of up to 12 km. 10 days after the eruption of the Ruang volcano in April 2024, the Atmospheric Chemistry Experiment (ACE) observed notable increases in SO2 volume mixing ratios and aerosol extinction at an altitude of approximately 20 km. It was confirmed that the aerosols present were sulfate aerosols from their infrared spectra. The composition and size of the stratospheric sulfate aerosol particles were determined by fitting the infrared transmission spectra. The sulfate aerosols observed in the plume were about 64% (by weight) sulfuric acid, and the droplets had an average median radius of 0.127 mu m.
M-type stars are the most abundant stars in our Galaxy. Their visible spectra are characterized by strong TiO and VO absorption bands with occasional ScO bands near 6000-6100 & Aring;. This region corresponds to the A2 Pi-X2 Sigma+ band system and can be used to measure the abundance of ScO. In this work, a new Doppler-limited resolution spectrum of ScO obtained in a hollow-cathode experiment is presented. The A2 Pi-X2 Sigma+ electronic transition is analyzed with special care dedicated to fitting the A ' 2 Delta(v+2) similar to A2 Pi(v) perturbation. Spectroscopic constants of the A2 Pi(v) states are reported for v <= 9, and a partial fit of spectroscopic constants is made for the A ' 2 Delta(v) states 2 <= v <= 6. The modeled interaction of the two states reproduces the experimental data remarkably well. New equilibrium constants are extracted from the fit. Band strengths are calculated with the help of a scaled transition dipole moment function, previously calculated with ab initio methods. Finally, a line list of the A2 Pi-X2 Sigma+ band system is provided, including Einstein A coefficients and oscillator strengths. Using this line list, the spectrum of ScO can be simulated for different temperature and pressure conditions in stellar atmospheres.
YO bands are conspicuous in the spectra of S stars. The laboratory spectrum of the A(2)Pi-X-2 Sigma(+) electronic transition has been recorded with a Fourier transform spectrometer using a composite-wall hollow cathode lamp source. The A(2)Pi-X-2 Sigma(+) transition with v '<= 4 and v '' <= 4 has been rotationally analyzed using the modern spectral fitting program PGOPHER. Vibronic band strengths were calculated using an ab initio transition dipole moment function. A line list for the A(2)Pi-X-2 Sigma(+) transition is provided and can be utilized in the modeling of S stars.
The Atmospheric Chemistry Experiment (ACE) is a satellite mission that has been in orbit since 2003. The primary instrument on ACE is a Fourier transform spectrometer (FTS) that records infrared atmospheric transmittance spectra in the limb geometry using the Sun as a light source. Version 5 of ACE-FTS data processing contains improved volume mixing ratio (VMR) profiles for 46 molecules and 24 isotopologues, including HFC-32 (CH2F2) and HOCl as new routine data products. VMR trends for each of the 46 molecules are reported for regions of atmospheric interest. Specifically, the longevity of the ACE mission has provided an opportunity to monitor the effectiveness of the Montreal Protocol on Substances that Deplete the Ozone Layer. It is observed that chlorofluorocarbons (CFCs) are declining, hydrochlorofluorocarbons (HCFCs) are no longer increasing, but hydrofluorocarbons (HFCs) are still increasing rapidly. Greenhouse gases such as carbon dioxide are also monitored and comparisons with National Oceanic and Atmospheric Administration (NOAA) and Advanced Global Atmospheric Gases Experiment (AGAGE) measurements are made.
Combining infrared aerosol transmittance spectra from the Atmospheric Chemistry Experiment Fourier trans -form spectrometer (ACE-FTS) and visible/near infrared extinction information from coincident SAGE III/ISS measurements, the properties of stratospheric sulfate aerosols are derived under various conditions. Assuming a bimodal size log-normal distribution (rather than a monomodal one) is required to properly characterize the spectra. Analysis is performed for enhanced sulfate conditions following two recent volcanic eruptions, the Raikoke eruption in 2019 and the Hunga Tonga-Hunga Ha'apai eruption in 2022, as well as for measurements under background sulfate conditions. The traditional analysis approach of assuming a monomodal distribution likely contributes to the large uncertainties for the impact of sulfate aerosols on climate.
ZrO is a well-studied metal monoxide because of its astrophysical importance in characterizing S stars. The bands of the d 3 Phi-a3 Delta system (gamma system) with v '<= 4 and v '' <= 5 are rotationally analyzed using the PGOPHER program to provide spectroscopic constants. The high-resolution ZrO emission spectrum was recorded with a Fourier transform spectrometer using a high-temperature carbon furnace source. New ab initio calculations of the transition dipole moment were carried out in order to determine the vibronic band strengths. The spectroscopic constants, along with the band strengths, are used to calculate a line list for the gamma system. This line list can be used to determine Zr abundances in S stars. We also correct the line strengths for the B 1 Pi-A 1 Delta transition calculated in our previous work.
We present an analysis of Antarctic polar winters from 2005 to 2023 as observed by the Atmospheric Chemistry Experiment (ACE). The unique broad band infrared spectral features in ACE “residual” spectra are used to classify the spectra of polar aerosols by composition into polar stratospheric clouds (PSCs) and sulfate aerosols. The spectra of PSCs are further classified into nitric acid trihydrate, supercooled ternary solutions, supercooled nitric acid, ice‐mix, and mixtures of PSCs. A breakdown of PSC composition is presented for each year. Antarctic winter seasons with unusual compositions are: 2011, in which volcanic ash mixed with PSCs was observed from July to August; 2019, which experienced a stratospheric warming event; 2020, the PSC season following the Australian Black Summer pyrocumulonimbus event; and 2023, which had unusually large sulfate aerosols following the Honga‐Tonga Honga Ha'apai eruption of 2022.
The depletion of stratospheric ozone is catalyzed by polar stratospheric clouds (PSCs) that form in the cold polar winter. The space-based lidar onboard CALIPSO (Cloud-Aerosol Lidar and Infrared Pathfinder Satellite Observations) has been the reference instrument for measuring PSCs. Recently, the infrared transmission spectra recorded by the Fourier transform instrument on the ACE (Atmospheric Chemistry Experiment) satellite has provided measurements of PSC composition. We report on coincident observations made by the CALIPSO and the ACE satellites for three late winter periods (2016, 2018 and 2019) and evaluate CALIPSO's determination of PSC composition relative to ACE's findings. We found that CALIPSO and ACE generally agree well for the detection of nitric acid trihydrate (NAT) clouds. However, CALIPSO detects some NAT clouds where ACE detects supercooled ternary solutions of nitric and sulfuric acid (STS). Similarly, CALIPSO only partially detects ice in ACE's ice clouds. Overall, these results seem to show that CALIPSO's NAT classification might be too inclusive. We also found that supercooled nitric acid (SNA) clouds, a new classification, are labelled as STS by CALIPSO.
 Chris Boone合作论文数Department of Chemistry, University of Waterloo375
 Kaley Walker合作论文数Department of Physics, University of Toronto284R.S. Ram合作论文数135Emmanuel Mahieu合作论文数76
 Gloria Manney合作论文数NorthWest Research Associates;Department of Physics, New Mexico Institute of Mining and Technology71
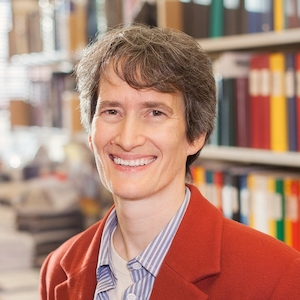 Kimberly Strong合作论文数Department of Physics, Faculty of Arts and Science, University of Toronto64
 Iouli E. Gordon合作论文数Department of Astronomy, Harvard University57Cr Brazier合作论文数56Curtis P. Rinsland合作论文数46
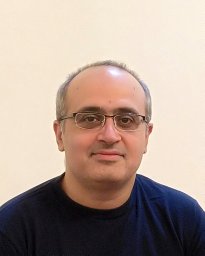 Alireza Shayesteh合作论文数Department of Chemistry, University of Waterloo45
 Jonathan Tennyson合作论文数Department of Physics and Astronomy, Faculty of Maths & Physical Sciences, University College London;Quantemol Ltd;Blue Skies Space Ltd44Pierre-François Coheur合作论文数43
 Lucien Froidevaux合作论文数Jet Propulsion Laboratory, National Aeronautics and Space Administration41Sean D. Mcleod合作论文数Department of Chemistry, University of Waterloo41
 Robert J. Hargreaves合作论文数41
 Cathy Clerbaux合作论文数40
 Jeremy J. Harrison合作论文数40
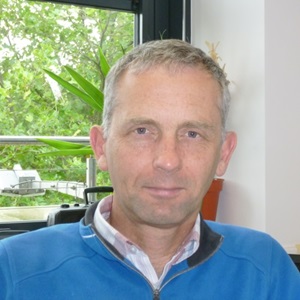 Martyn Chipperfield合作论文数School of Earth and Environment,University of Leeds39
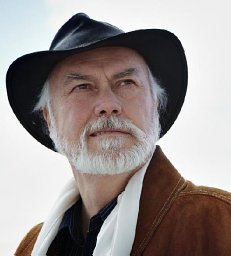 C. T. Mcelroy合作论文数Environment Canada39
 James Drummond合作论文数Department of Physics & Atmospheric Science, Faculty of Science, Dalhousie University38T. Hirao合作论文数37
 Ray Nassar合作论文数Department of Physics, Faculty of Arts and Science, University of Toronto35
 Oleg Polyansky合作论文数Department of Physics and Astronomy, Faculty of Mathematical & Physical Sciences, University College London35
 Keith Tereszchuk合作论文数Dept Chem, Univ York34Geoffrey C. Toon合作论文数32Pierre Duchatelet合作论文数32Bernard Pinchemel合作论文数32William H. Daffer合作论文数30
 Robert J. Le Roy合作论文数Department of Chemistry, University of Waterloo30Michael Dulick合作论文数30p m sheridan合作论文数Department of Chemistry and Biochemistry, Canisius College29
 Donal P. Murtagh合作论文数Department of Radio and Space Science, Chalmers University of Technology29jc mcconnell合作论文数28
 Cora Randall合作论文数Laboratory for Atmospheric and Space Physics, University of Colorado Boulder;Department of Atmospheric and Oceanic Sciences, University of Colorado Boulder28
 Chris McLinden合作论文数Environment and Climate Change Canada, Gouvernement du Canada;Department of Physics and Engineering Physics, University of Saskatchewan28
 Bernd Rainer Funke合作论文数Instituto de Astrofísica de Andalucía, Consejo Superior de Investigaciones Científicas27m j dick合作论文数26Michelle L. Santee合作论文数Jet Propulsion Laboratory, California Institute of Technology26Daniel Hurtmans合作论文数26Gabriele P. Stiller合作论文数Karlsruhe Institute of Technology26
 J. Urban合作论文数24Takayoshi Amano合作论文数Faculty of Science, The University of Tokyo24k q zhang合作论文数23c n jarman合作论文数23
 Dominique Appadoo合作论文数Australian Synchrotron Company Ltd.22Gaëlle Dufour合作论文数Laboratoire Inter-universitaire des Syst `22E. Dupuy合作论文数Department of Chemistry;University of Waterloo21Rodolphe Zander合作论文数21
 Christian Servais合作论文数21




