Properties and seasonal evolution of North Pacific Ocean subtropical mode water (STMW) within and south of the Kuroshio Extension recirculation gyre are analyzed from profiling float data and additional hydrographic and shipboard ADCP measurements taken during 2004. The presence of an enhanced recirculation gyre and relatively low mesoscale eddy variability rendered this year favorable for the formation of STMW. Within the recirculation gyre, STMW formed from late-winter convection that reached depths greater than 450 in near the center of the gyre. The lower boundary of STMW, corresponding to sigma(theta) similar or equal to 25.5 kg m(-3), Was set by the maximum depth of the late-winter mixed layer. Properties within the deep portions of the STMW layer remained largely unchanged as the season progressed. In contrast, the upper boundary of the STMW layer eroded steadily as the seasonal thermocline deepened from late April to August. Vertical eddy diffusivity responsible for this erosion was estimated front a budget analysis of potential vorticity to be in the range of similar to 2-5 X 10(-4) m(2) s(-1). The latitudinal extent of the STMW formation was narrow, extending from 30 degrees N to the Kuroshio Extension jet near 35 degrees N. South of 30 degrees N, STMW did not form locally but was transported from the recirculation gyre by lateral induction.
Surface meteorology, upper ocean current, and hydrographic measurements, collected along a repeated survey pattern and from a central mooring in the western equatorial Pacific during late 1992 to early 1993, were used to analyse upper ocean momentum balances on the intraseasonal time scale. Wind stresses derived from meteorological measurements were compared with numerical weather prediction products. Advection terms in the momentum equations were estimated by planar fits to the current and hydrographic data. Pressure gradient terms were derived from planar fits to the dynamic heights calculated from the hydrographic data, referenced by balancing the momentum equation in a selected layer below the mixed layer. Under prevailing westerly winds, westward pressure gradient forcings of 2×10⁻⁷ms-2 were set up in the western equatorial Pacific, countering the surface wind, while the total advection tended to accelerate the eastward momentum in the surface layer. During both calm wind and westerly wind burst periods, zonal turbulent momentum fluxes estimated from the ocean budgets were comparable with those estimated from microstructure dissipation rate measurements and with zonal wind stresses, so that the zonal momentum could be balanced within error bars. The meridional momentum balances were noisier, which might be due to the fact that the short meridional length scale of the equatorial inertial-gravity waves could contaminate the dynamic signals in the mixed temporal/spatial sampling data, so that the meridional gradient estimates from the planar fits could be biased.
Two cruises of the JAMSTEC ship Kaiyo, during October 1999 and September 2000, included lowered acoustic Doppler current profiler (ADCP) measurements to 2000m depth on zonal sections extending east from the Mindanao coast. On the second cruise, the lowered ADCP profiles were augmented by profiles to 1000m from a 38-kHz shipboard ADCP. All zonal LADCP sections (7°N, 8°, 10°) showed southward flow along the coast extending to at least 2000m depth. Although the Mindanao current in the upper 500m forms a continuous narrow stream along the coast, the deeper southward flow appears to be part of a set of subthermocline eddies within 300km of the coast; northward flow was found 100–200km offshore during both cruises. Currents mapped by the shipboard ADCP on the second cruise indicate that cyclonic eddies were centered near 7.5°N, 128°E and 10.2°N, 127°E. Maximum speeds of 0.6ms−1 were observed at 800m depth on the 10°N section, and speeds of 0.2–0.3ms−1 were found below 1500m on all sections.
Decade-long surface meteorological measurements from a Japan Meteorological Agency buoy at 29degreesN, 135degreesE are analyzed to elucidate the surface air-sea flux forcing in the western North Pacific Ocean. Besides the well-defined annual cycles, the observed heat and momentum fluxes are dominated by signals related to synoptic-scale weather disturbances. The synoptic-scale heat flux signals have a dominant time scale of 3-14 days, whereas the wind stress signals have a scale of 2-8 days. A comparison between the heat fluxes estimated using the buoy measurements and those from the NCEP reanalysis reveals that the daily NCEP product overestimates both the incoming solar radiation at sea surface and the turbulent heat flux amplitude associated with the individual weather events. The rms amplitude of the synoptic-scale net heat flux of the NCEP product is found to be positively biased by 23%. Despite this amplitude bias, the NCEP product captures the timing and relative strength of the synoptic-scale net heat flux forcing very well. A favorable comparison is also found between the daily surface wind stress forcing from the buoy and that from the NCEP product on the synoptic time scales. Using a bulk surface mixed layer model, we find that the synoptic-scale forcing can significantly change the SSTs in spring-summer seasons. The synoptic-scale heat flux-induced SST anomalies have a typical amplitude of +/-1degreesC, whereas the wind-induced SST anomalies depend on the accumulation of large-amplitude wind events. Excessive accumulation, which occurred, for example, in 1997, can result in unseasonally cold summertime SST anomalies. From both the observations and the model, the frequency spectra for the synoptic-scale SST signals show a clear omega(-2) dependency. While this dependency is consistent with the "white'' surface heat flux forcing in the frequency band of 1/100-1/16 days, short-term mixed layer depth changes induced by the synoptic-scale atmospheric forcing are argued to be important in determining the SST spectral shape in the higher-frequency band.
The full-depth current structure in the Japan/East Sea was investigated using direct velocity measurements performed with lowered and shipboard acoustic current Doppler profilers. Rotary spectral analysis was used to investigate the three-dimensional energy distribution as well as wave polarization with respect to vertical wavenumbers, yielding information about the net energy propagation direction. Highly energetic near-inertial downward-propagating waves were found in localized patches along the southern edge of the subpolar front. Between 500- and 2500-m depth, the basin average energy propagation was found to be upward, with the maximum of relative difference between upward- and downward-propagating energy lying at about 1500-m depth. This difference was most pronounced in the southeastern part of the basin.
1 Frontier Observational Research System for Global Change, Yokosuka, Kanagawa, Japan 2 National Institute of Oceanography, Dona Paula, Goa, India 3 University of Zululand, KwaDlangezwa, South Africa 4 NOAA/Pacific Marine Environmental Laboratory, Seattle, Washington, U.S.A. 5 University of Hawaii, Honolulu, Hawaii, U.S.A. 6 LODYC, Paris, France 7 CSIRO Marine Research, Hobart, Tasmania, Australia
We summarize previous estimates of volume transport and property distributions through the Mozambique Channel and offer additional estimates and measurements based on recently acquired hydrographic and float data. Previously published property distributions are consistent with southward spreading through the Channel. Waters of the Mozambique Channel are characterized by shallow and intermediate oxygen minima separated by a relative maximum. Based on hydrographic sections, the intermediate maximum in dissolved oxygen is seen to decrease in value as it spreads southward. The highest values are found in the westward flow of the South Equatorial Current just north of Madagascar and within the western 200km of the Channel. Similarly, oxygen concentrations at the intermediate oxygen minimum, which derives from the Arabian Sea, increase southwards, while its depth increases from 900 to 1100m, supporting previous studies and indicating southward spreading and mixing along the Mozambique Channel. Historical transports based on hydrographic data in the Channel vary from 5Sv northward to 26Sv southward depending on reference level and time of the year. Balancing transport below 2500m (the sill depth in the Channel), we estimate the net southward transports above this depth to be 29.1 and 5.9Sv for the northern and southern sections, respectively—the difference is presumably related to seasonality and eddy variability superimposed on the mean flow. Individual deep float trajectories show the presence of many eddies, but the overall flow in the channel is southward, and broadly consistent with hydrography. Model outputs also show mean southward transport with considerable seasonal variability. Satellite data show high variability in sea surface height anomalies and high eddy kinetic energy associated with eddy activity. Although the geostrophic transport values are consistent with the historical limits, the lowered ADCP measurements suggest a substantial barotropic component to the flow. Direct long-term measurements of the current are needed to quantify its magnitude and variability.
The methods and initial results of an extensive pilot study, the Joint Air–Sea Monsoon Interaction Experiment (JASMINE) held in the Indian Ocean during the summer of 1999, are described. The experimental design was based on the precept that the monsoon sways back and forth from active to inactive (or break) phases and that these intraseasonal oscillations are coupled ocean–atmosphere phenomena that are important components of the monsoon system. JASMINE is the first comprehensive study of the coupled ocean–atmosphere system in the eastern Indian Ocean and the southern Bay of Bengal. Two research vessels, the NOAA ship Ronald H. Brown and the Australian research vessel Franklin, totaled 52 days of surveillance in April–June and September, with 388 conductivity–temperature–depth (CTD) casts and 272 radiosonde ascents. In addition, both ships carried identical flux systems to measure the ocean–atmosphere interaction. The Brown had five radar systems and profilers, including a cloud radar and a Doppler C-band...
During the TOGA COARE Intensive Observing Period, an energetic, surface-intensified, submesoscale cyclonic eddy was observed in the near-equatorial western Pacific warm pool. The eddy appeared to have been generated as part of the spindown of a strong eastward surface jet forced by the December 1992 westerly wind burst. Because of its potential impacts on the long-term heat, salt, and momentum budgets of the warm pool, the authors provide a thorough description of the evolution of the surface jet and the development of the eddy in the present study. Both the isopycnal surface fit and the zeroth-order dynamic balance confirm the existence of the eddy. Surface layer convergence and northward inertial motion are suggested to be the main causes of the negative eddy vorticity, and it is likely that the eddy drew its energy from the decaying surface jet. This study indicates that in the near-equatorial region the inertial motion has a decreasing meridional spatial scale with time, (betat)(-1), due to the beta effect, which increases the Rossby number of the decaying jet and generates the nonlinearity.
Upper ocean currents in the Celebes Sea, the northern Maluku Sea, and the adjacent region to the east were measured during February 1999 using a shipboard acoustic Doppler current profiler (ADCP) on R/V Kaiyo. The new data provide the first quasisynoptic observations of the circulation within the central Celebes Sea. South of Mindanao, the Mindanao Current split into three branches. Only the westernmost branch entered the Celebes Sea, where part retroflected around a cyclonic eddy in the western Celebes Sea and part took a shorter route through the eastern basin before the two paths joined and returned to the Pacific. The remainder of the Celebes Sea branch of the Mindanao Current continued toward Makassar Strait. In the central and eastern Celebes Sea, the circulation pattern below 150 m differed substantially from that at the surface. The strongest feature was a northward flow that exceeded 60 cm s−1 near 230 m in the center of the basin, where shallower currents were weak. A northward transport of 6 Sv in the top 300 m was measured across 1.75°N in the Maluku Sea, carrying Indonesian Seas waters northeast toward the Pacific. Water properties and other current sections in the northern Maluku Sea confirm shallow northeastward flow.
Wavenumber spectra of velocity and density fields in the western equatorial Pacific warm pool on scales 6-120 km are estimated using the shipboard survey data collected during the TOGA Coupled Ocean-Atmosphere Response Experiment (COARE). The spectra are averaged over three depth intervals: 20-60, 60-110, and 110-250 m (corresponding to the Yoshida jet, the South Equatorial Current, and the southern edge of Equatorial Undercurrent). The velocity spectra are corrected for the mean flow shear advection, which is important under conditions of low gradient Richardson number (Ri). After that, both velocity and density spectra are consistent with an internal wave spectral model including a random component (equatorial version of the Garrett and Munk spectrum) and a tidal component (the Feng et al. tidal model). Tidal peaks, previously found by other COARE investigators as being prominent on the "moored" spectra (i.e., on the spectra derived from mooring data), appear to be much less significant on the "towed" spectra (i.e., on the spectra derived from shipboard surveys). The model and observations reveal some directional anisotropy of the towed velocity spectra depending on Ri.
During the TOGA COARE Intensive Observing Period (IOP) from November 1992 through February 1993, temperature, salinity, and velocity profiles were repeatedly obtained within a 130 km x 130 km region near the center of the Intensive Flux Array (IFA) in the western equatorial Pacific warm pool. Together with high quality measurements of air-sea heat flux, rain rate, upper-ocean microstructure. and penetrating solar radiation, they make up a unique dataset for upper ocean heat and freshwater budget studies. Three survey cruises sampled different phases of the Intraseasonal Oscillation (ISO) during the IOP. Temporal evolution and advective terms in the heat and salt balance equations, on timescales of 3 days and longer, are estimated using the survey data. The upper-ocean (0-50 m) heat and salt budgets at the center of the IFA were estimated and are closed to within 10 W m(-2) of observed air-spa heat fluxes and to within approximately 20% of observed rain rates during each of the three cruises. Generally, advection in the upper ocean cannot be neglected during the IOP. Zonal advection alternates sign but had a net warming and freshening tendency. Meridional advection decreased temperature and increased salinity in the surface layer, while vertical advection warmed and freshened the surface layer because of the general downwelling trend, Heat advection is as important as the net air-sea flux during the westerly wind burst time periods. The sub-ISO timescale upper-ocean dynamics. such as the strong meridional advection caused by inertial motions, are found to have important contributions to the upper-ocean heat and freshwater balances.
Recent sections crossing the equator at nine longitudes from 146°E to 86°W show zonal currents below 400 m similar to those found in a 16‐month mean section on 159°W from the Pacific Equatorial Ocean Dynamics (PEQUOD) program in 1982–1983. Most of the new measurements were made with a lowered acoustic Doppler current profiler. Eastward current extrema (North and South Intermediate Countercurrents) are found in all sections about 2° from the equator in the depth range 500–1500 m, with the possible exceptions of 146°E, where topography complicates the picture south of the equator, and 150°E, where the sections extend only from 1°S to 2°N. Poleward of the intermediate countercurrents, westward flow is found near 3° from the equator in most of the sections. On the equator, from 250–500 m depth, a westward Equatorial Intermediate Current is found in many but not all of the sections. Similarly, it is present in the PEQUOD mean but not in all synoptic sections. Below the intermediate currents and countercurrents, an eastward current near 3000 m was found at and south of the equator in the PEQUOD mean and in the new sections from 150°E to 110°W. Near 4000 m there is westward flow south of the equator in the PEQUOD mean and near the equator in the new sections from 179°E to 135°W. Geostrophic currents calculated from an 8‐year mean hydrographic section at 165°E also resemble the PEQUOD mean. Although not conclusive, the evidence presented here indicates that these currents are basin‐scale components of the general circulation, perhaps involving vigorous horizontal recirculation in a set of basin‐wide elongated gyres within a few degrees of the equator.
The semidiurnal tide within a 100 km square region of the western equatorial Pacific centered at 1.8° S, 156.1° E is examined using shipboard survey and mooring data collected during the Tropical Ocean Global Atmosphere Coupled Ocean‐Atmosphere Response Experiment (TOGA COARE). Baroclinic and barotropic tidal amplitudes and phases are estimated from the survey and mooring observations in the upper 300 m of the 1800 m deep ocean by specifying their horizontal and vertical structures. The barotropic tide is assumed to have zero horizontal wavenumber over the domain, while a component of the baroclinic tide that is phase‐locked to the barotropic tide is determined by a searching method using plane wave fits to the data. The estimated barotropic tidal current is in good agreement with tide models derived from TOPEX/POSEIDON observations. The plane wave analysis indicates a dominant mode one baroclinic wave propagating toward the northeast. The second vertical mode can also be detected. Given the phase differences between the M2 and S2 constituents in the barotropic and baroclinic tides, the source of the baroclinic tidal signal is determined to be about 320 km southwest of the observing region, at a series of islands and shallow ridges. The combined estimates of the barotropic and baroclinic tides typically account for only 40–60% of the observed semidiurnal band current variance in the mooring data, indicating the high degree of temporal and spatial variability of the baroclinic tide in this region. The results of this study suggest, however, that coherent barotropic and baroclinic tidal signals can be successfully distinguished in the deep ocean using shipboard survey data, even when the data are limited to the upper 300 m.
The top to bottom large‐scale ocean circulation in the northwest Pacific is described using a World Ocean Circulation Experiment (WOCE) onetime hydrographic section along 149°E between Papua New Guinea and Japan. The circulation is quantified using a combination of geostrophic and lowered acoustic Doppler current profiler velocity estimates. At the northern end of the section the flow regime is distinct in that the deep flow largely reflects that at the surface: the Kuroshio jet and its northern and southern recirculations have deep expressions. South of 25°N, the deep and bottom water flows do not mirror the surface flows, and the circulation assumes a highly baroclinic structure. Below the depth of local North Pacific ventilation the flow in the upper deep waters (800–2500 m) alternates in sign roughly every 10° of latitude revealing a set of deep clockwise gyres with significant transports of 40 Sv (1 Sv = 106m3s−1) for a tropical gyre (south of 6°N) and 20 Sv in a subtropical gyre (6°–24°N). These gyres provide a pathway for South Pacific influences to reach 22°N (the location of a strong water mass front) through exchange along the western boundary. Maps of properties on density surfaces suggest that the zonal extent of the upper deep water gyres found along 149°E is basin wide. Below 2500 m, flow across the section is isolated from the Philippine Sea by the Izu‐Ogasawara‐Mariana Ridge and the flow regime and property distribution reflect this: Lower Circumpolar Water flows west in a deep western boundary current near 10°N and coalesces at the Izu‐Ogasawara‐Mariana Ridge with a tongue of North Pacific Deep Water also flowing west near 15°N. About 4 Sv of a mixture of these waters flows east again near 25°N, associated with an abyssal water mass front. North of the front, the water properties are laterally homogeneous on density surfaces in the strongly recirculating gyres associated with the deep Kuroshio system.
Two volume control methods are used to analyze the upper ocean heat and salt balances in response to a westerly wind burst event in the western equatorial Pacific during the Tropical Ocean Global Atmosphere Coupled Ocean‐Atmosphere Response Experiment. One method uses a fixed‐thickness surface layer, and the other uses an isopycnal depth as the lower boundary. Horizontal advection terms in the budget calculations are estimated using the R/V Wecoma repeat hydrographic survey data within a 133 km × 133 km region. In both methods, the upper ocean heat budget is balanced within 10 W m−2 of the surface air‐sea flux observations during a 19‐day time period, which covers the December 1992 westerly wind burst and a low‐wind recovery period in early January 1993. The standard error in the estimation of heat advection is 11 W m−2. The salt budget yields a rain rate estimate of 15.4 mmd−1 with an error bar of 4 mmd−1. This estimate is within 20% of the optical rain gauge measurements. The advection terms are important in both the heat and salt balances. Meridional advection dominates over zonal and vertical advection, acting to decrease temperature and increase salinity in the surface layer. From the isopycnal boundary method, the diapycnal turbulent flux transports a mean heat flux of 17 W m−2 into the thermocline. Diapycnal advection is almost equally important, so that the total heat flux into the thermocline is estimated to be more than 30 W m−2 during the study time period. Both terms are also important in the salt budget.
Velocity and property observations were made during February and March 1995 as part of the World Ocean Circulation Experiment (WOCE) Hydrographic Program (WHP) expedition in the Indian Ocean. The observed circulation in the upper 300 m of the ocean during the northeast monsoon is compared to the output of a high‐resolution, 3‐layer, nonlinear model forced by European Center for Medium Range Weather Forecasting (ECMWF) winds. The data identify several new features in the Bay of Bengal: a shelf‐break coastal current in the northeast corner, an eddy and subsurface jet near the South Preparis Channel, and an eastward countercurrent extending from 80°E to the eastern boundary. The countercurrent transports high‐salinity surface water from the northwest Indian Ocean into the bay, and separates the historically observed North Equatorial Current into two currents with separate sources and water properties. The data also detail the spatial structure of the South Equatorial Current and Countercurrent, and show the Equatorial Undercurrent in the eastern half of the Indian Ocean. The model compares well enough with the data to suggest that such realistic models may provide a useful temporal context for the WHP snapshot.
 Roger Lukas合作论文数Department of Oceanography, University of Hawaii at Manoa9
 Eric Firing合作论文数8
 Ming Feng合作论文数CSIRO Marine and Atmospheric Research5
 P. Michael Kosro合作论文数College of Oceanic|Atmospheric Sciences; Oregon State University4
 Adriana Huyer (Jane)合作论文数College of Earth, Ocean, and Atmospheric Sciences, Oregon State University4ef bradley合作论文数3
 Chris Fairall合作论文数Physical Science Division, Earth Systems Research Laboratory, National Oceanic and Atmospheric Administration;Physical Sciences Laboratory, National Oceanic and Atmospheric Administration3SE Wijffels合作论文数2
 Arnold L. Gordon合作论文数Department of Earth and Environmental Sciences, Columbia University;Lamont-Doherty Earth Observatory, Columbia University2
 Bo Qiu合作论文数Department of Oceanography, School of Ocean & Earth Science & Technology, University of Hawaii at Manoa2
 Yuji Kashino合作论文数Institute of Observational Research for Global Change, JAMSTEC2Shuiming Chen合作论文数Department of Oceanography, University of Hawaiʻi at Mānoa2
 Peter J. Webster合作论文数School of Earth and Atmospheric Sciences, Georgia Institute of Technology2
 Steven P. Anderson合作论文数GlaxoSmithKline Pharmaceuticals;Research Triangle Park;GlaxoSmithKline Pharmaceuticals2J Stuart Godfrey合作论文数2Margaret Beznák合作论文数2
 Lynne D. Talley合作论文数Scripps Institution of Oceanography, University of California, San Diego2
 Robert A. Weller合作论文数Woods Hole Oceanographic Institution2A. J. Plueddemann合作论文数2
 Charles Eriksen合作论文数School of Oceanography, College of the Environment, University of Washington2Ma Merrifield合作论文数1Wd Nowlin合作论文数1J Fleischbein合作论文数1R O'Malley合作论文数1
 Torres Daniel合作论文数Parc Cientific de Barcelona, Universitat de Barcelona1
 Mark R. Jury合作论文数Departamento de Fisica, Universidad de Puerto Rico1
 Robert A. Houze Jr合作论文数Department of Atmospheric Sciences, University of Washington;Pacific Northwest National Laboratory1Yukio Masumoto (升本順夫)合作论文数Department of Earth and Planetary Physics, Graduate School of Science, University of Tokyo;Department of Earth and Planetary Science, Graduate School of Science, University of Tokyo1S. Yoshida合作论文数1B. Qiu合作论文数1
 Terrence Joyce合作论文数1R. Molcard合作论文数1
 Michael Mcphaden合作论文数School of Oceanography, College of the Environment, University of Washington;Cooperative Institute for Climate, Ocean, and Ecosystem Studies, University of Washington;Cooperative Institute for Marine and Atmospheric Research, , University of Hawaii;Pacific Marine Environmental Laboratory, National Oceanic and Atmospheric Administration1
 Donald B. Olson合作论文数Department of Ocean Sciences, Rosenstiel School of Marine, Atmospheric, and Earth Science, University of Miami1John C. Kindle合作论文数1
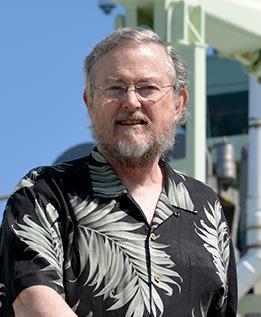 John M. Toole (John Toole)合作论文数Department Physical Oceanography, Woods Hole Oceanographic Institution1
 A. Sulaiman合作论文数Kompleks Puspiptek Serpong1
 Kamran Sahami合作论文数Department of Physics, Metropolitan State College of Denver1
 Jerome Vialard合作论文数Institute of Research for Development1Kathleen A. Donohue合作论文数Department of Health Behavior, Roswell Park Cancer Institute1
 Andrey Shcherbina合作论文数Scripps Institution of Oceanography, University of California1
 Piers Chapman合作论文数World Ocean Circulation Experiment Department of Oceanography, Texas A&M University College Station1V. S. N. Murty合作论文数1
 Doug Wilson合作论文数1Shu-Bin Ma合作论文数1
 Alexander Soloviev合作论文数1
 D. Randolph Watts合作论文数Graduate School of Oceanography, University of Rhode Island1Melinda M. Hall合作论文数1
 Molly Baringer合作论文数Atlantic Oceanographic and Meteorological Laboratory, National Oceanic and Atmospheric Administration1




