In this paper we present results on the time dynamics of the most used cellular bands, from the measurement campaign conducted in seven European cities. Special attention was given on acquiring comparable datasets between the different measurement locations. We provide detailed examples of how much variability there is in the measured activity and we also test the validity of common assumptions usually found in the literature. In particular, we show that the spectrum occupancy metrics exhibit significant degree of stationarity in all the measurement locations and in all of the frequency bands studied. We also characterize in detail the influence of the diurnal cycle, i.e., the differences in spectrum use during different times of day. In addition to raw spectrum occupancy metrics, we study the structure of the ON/OFF activity patterns for cellular bands. Our results show that the ON and OFF period durations in our data sets have significantly heavier tails than predicted by the commonly used Markov models.
We report initial results from 48 hour spectrum occupancy measurement campaign that was done in time-correlated fashion in seven different European locations. We give a description of the measurement campaign and provide results from our preliminary analysis of overall duty cycle in the frequency range 110-3000 MHz. The paper particularly focuses on traffic and duty cycle patterns in GSM 900 and GSM 1800 bands. For the sake of completeness, we also discuss ISMband utilization in two of our measurement sites. We show that spectrum utilization is generally low, but that variance between frequency bands and locations is significant, which means that any statistical claims on occupancy statistics need to be done carefully before regulatory claims are made.
 Van Wesemael, P.合作论文数2
 Janne Riihijärvi合作论文数Institute for Networked Systems, RWTH Aachen University2
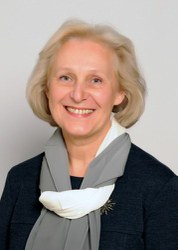 Liljana Gavrilovska合作论文数Faculty of electrical engineering and information technologies, Ss. Cyril and Methodius University in Skopje2
 Alexandros Palaios合作论文数2
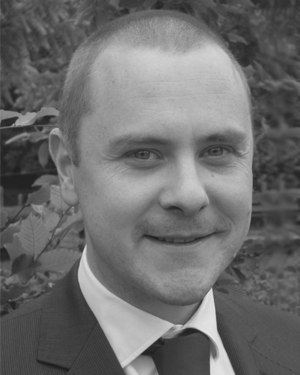 Antoine Dejonghe合作论文数2
 Vladimir Atanasovski合作论文数Faculty of Electrical Engineering and Information Technologies2
 Petri Mahonen合作论文数School of Electrical Engineering, Aalto University2




