Spatially synchronous extreme warm events can amplify environmental and societal impacts by affecting multiple regions simultaneously. However, previous studies have largely focused on June–August (JJA) events during the instrumental period, limiting understanding of their seasonal prevalence and long-term evolution. Here, we examine globally synchronous seasonal warm events (GSSWEs) using seasonal mean near-surface air temperature (SAT) and introduce an Extremity Index (EI) that combines normalized local land SAT anomaly intensity with the spatial extent of land areas exceeding a specified SAT threshold. Using instrumental observations, paleo-reanalysis products and climate model simulations, we assess changes in global-land GSSWE extremity since 850 Common Era (CE). We find that GSSWEs have intensified sharply since the 1970s across all four seasons, reaching levels not found earlier in the multi-dataset records. Detection and attribution analyses indicate that anthropogenic forcing, dominated by greenhouse-gas forcing, is the main contributor to this recent intensification. Spatially, the tropics contribute greatly to the recent extremity of GSSWEs due to their lower intrinsic variability. These findings highlight that climate-risk assessment and adaptation planning need to consider the growing spatial coherence and intensity of seasonal warm extremes. This study shows that the extremity of globally synchronized seasonal warm events has sharply intensified in recent decades, reaching unprecedented levels since 850 CE, largely driven by anthropogenic greenhouse gas forcing.
ABSTRACT Understanding the extent to which human activities have influenced regional climate is a key scientific and policy challenge. The UK is one of the world's best observed regions climatically, with a long and reliable temperature record that makes it an important test case for regional detection and attribution. Here, for the first time, we apply optimal fingerprinting to UK mean 2‐m air temperature changes using the Estimating Equations method, HadUK‐Grid observations, and CMIP6 simulations. We assess the extent to which observed UK temperature changes can be explained by natural internal variability, anthropogenic forcings, and natural external forcings. We detect a significant anthropogenic influence on warming in recent decades and identify greenhouse gases as the main driver. We also detect a cooling contribution from other anthropogenic influences in the mid‐twentieth century, likely dominated by sulphate aerosols. These results update earlier UK‐focused work and demonstrate that human influences, both warming and cooling, are detectable even at the national scale.
Urban flooding is one of the most damaging impacts of climate change. The two main causes of changes in rainfall-driven flooding are altered precipitation and changes in urbanisation. Yet attribution studies only focus on the former. Furthermore, very few event attribution studies examine subdaily rainfall extremes, the timescale at which such extremes are accelerating the most. Here, for the first time, we carry out an impact event attribution study examining the effects of both climate change and urbanisation on a flash-flooding event in the U.K. city of Leeds. By combining a convection-permitting climate model with a flood inundation model, we show that the extent of flooding in the urban area of Leeds was increased during this event in 2014 by 49% compared to the potential flooding that would have occurred if a similar rainfall event had taken place 30 years earlier. The increase from urbanisation (29%) is almost twice that from climate change (16%). Both factors combine nonlinearly to increase flood extent by more than the sum of their parts. Our results also show that urban flood risk could be significantly misrepresented if changes in rainfall intensity are used as a proxy for changes in pluvial flooding.
It will be important to know when global warming has reached 1.5°C, as this will be a key marker in global policy given the ambition to pursue efforts to limit warming to this level. But how should the temperature increase be defined in this context? The Global Stocktake agreed at COP28 in Dubai noted “global warming of about 1.1 °C” based on the IPCC 6th Assessment Report, but this number applies to the average of 2011-2020 and hence is already out of date. We propose that the metric for current global warming should allow immediate of identification of passing particular levels of global warming, such as 1.5°C, to avoid unnecessary delays in responding to the exceedance. We also propose that the metric should be consistent with the definition of future Global Warming Levels in the IPCC 6th Assessment Report, which uses 20-year means of projected temperature anomalies with an exceedance year defined as the mid-point of the 20-year period. Without this consistency, the apparent time of reaching 1.5°C could differ from the time previously projected by the IPCC merely because of differences in the definition, which could be misinterpreted as indicting that global warming had reached 1.5°C either earlier or later than projected. This could either undermine confidence in projections or misinform discussions on action to address climate change.While various indicators are already in use that provide a more instantaneous measure of global warming, none are consistent with the IPCC definition of future GWLs nor are suitable for use as a baseline for impacts assessments. To address this, we propose a new metric, the Current Global Warming Level (CGWL), which uses a 20-year average over the previous 10 years from observations and the next 10 years from a forecast or projections. Here we compare the CGWL with the various indicators currently in use for quantifying the current level of global mean temperature change, and compare their indications of global temperature change over recent decades and of the current level of global warming. We also compare the year of exceeding past global warming levels of 0.5°C, 1.0°C and 1.2°C for each indicator. We use a combined observational dataset following IPCC methods and process the indicators from this. For each indicator, we explain potential difficulties that could arise from its use to assess when global warming reaches 1.5°C relative to pre-industrial, and explain the rationale for our proposed indicator, the Current Global Warming Level.
In 2022 large parts of Pakistan suffered devastating flooding, with the southern provinces of Balochistan and Sindh particularly badly impacted. These regions received record-breaking rainfall totals during August, following a very wet July over the summer monsoon season. In this attribution study we combine the forecasting attribution technique developed by Leach et al. 2021 with flood inundation modelling to estimate the influence of anthropogenic climate change on the 2022 floods. This combined storyline and probabilistic approach uses the European Centre for Medium-Range Weather Forecasts (ECMWF) forecasts, and perturbed counterfactual forecasts with the same synoptic setup. These are fed into the 2D hydrodynamic flood inundation model LISFLOOD-FP over the worst affected regions to produce flood maps at 90m resolution.
It will be important to know when global warming has reached 1.5°C, as this will be a key marker in global policy given the ambition to pursue efforts to limit warming to this level. But how should the temperature increase be defined in this context? The Global Stocktake agreed at COP28 in Dubai noted “global warming of about 1.1 °C” based on the IPCC 6th Assessment Report, but this number applies to the average of 2011-2020 and hence is already out of date. We propose that the metric for current global warming should allow immediate of identification of passing particular levels of global warming, such as 1.5°C, to avoid unnecessary delays in responding to the exceedance. We also propose that the metric should be consistent with the definition of future Global Warming Levels in the IPCC 6th Assessment Report, which uses 20-year means of projected temperature anomalies with an exceedance year defined as the mid-point of the 20-year period. Without this consistency, the apparent time of reaching 1.5°C could differ from the time previously projected by the IPCC merely because of differences in the definition, which could be misinterpreted as indicting that global warming had reached 1.5°C either earlier or later than projected. This could either undermine confidence in projections or misinform discussions on action to address climate change. While various indicators are already in use that provide a more instantaneous measure of global warming, none are consistent with the IPCC definition of future GWLs nor are suitable for use as a baseline for impacts assessments. To address this, we propose a new metric, the Current Global Warming Level (CGWL), which uses a 20-year average over the previous 10 years from observations and the next 10 years from a forecast or projections. Here we compare the CGWL with the various indicators currently in use for quantifying the current level of global mean temperature change, and compare their indications of global temperature change over recent decades and of the current level of global warming. We also compare the year of exceeding past global warming levels of 0.5°C, 1.0°C and 1.2°C for each indicator. We use a combined observational dataset following IPCC methods and process the indicators from this. For each indicator, we explain potential difficulties that could arise from its use to assess when global warming reaches 1.5°C relative to pre-industrial, and explain the rationale for our proposed indicator, the Current Global Warming Level.
Achieving net-zero global emissions of carbon dioxide (CO2), with declining emissions of other greenhouse gases, is widely expected to halt global warming. CO2 emissions will continue to drive warming until fully balanced by active anthropogenic CO2 removals. For practical reasons, however, many greenhouse gas accounting systems allow some 'passive' CO2 uptake, such as enhanced vegetation growth owing to CO2 fertilization, to be included as removals in the definition of net anthropogenic emissions. By including passive CO2 uptake, nominal net-zero emissions would not halt global warming, undermining the Paris Agreement. Here we discuss measures to address this problem, to ensure residual fossil fuel use does not cause further global warming: land management categories should be disaggregated in emissions reporting and targets to better separate the role of passive CO2 uptake; where possible, claimed removals should be additional to passive uptake; and targets should acknowledge the need for Geological Net Zero, meaning one tonne of CO2 permanently restored to the solid Earth for every tonne still generated from fossil sources. We also argue that scientific understanding of Net Zero provides a basis for allocating responsibility for the protection of passive carbon sinks during and after the transition to Geological Net Zero.
In 2022 large parts of Pakistan suffered devastating flooding, with the southern provinces of Balochistan and Sindh particularly badly impacted. These regions received record-breaking rainfall totals during August, following a very wet July over the summer monsoon season. In this attribution study we combine the forecasting attribution technique developed by Leach et al. 2021 with flood inundation modelling to estimate the influence of anthropogenic climate change on the 2022 floods. This combined storyline and probabilistic approach uses the European Centre for Medium-Range Weather Forecasts (ECMWF) forecasts, and perturbed counterfactual forecasts with the same synoptic setup. These are fed into the 2D hydrodynamic flood inundation model LISFLOOD-FP over the worst affected regions to produce flood maps at 90m resolution.
AbstractThe UK contribution to the Detection and Attribution Model Intercomparison Project (DAMIP), part of the sixth phase of the Climate Model Intercomparison Project (CMIP6), is described. The lower atmosphere and ocean resolution configuration of the latest Hadley Centre global environmental model, HadGEM3‐GC3.1, is used to create simulations driven either with historical changes in anthropogenic well‐mixed greenhouse gases, anthropogenic aerosols, or natural climate factors. Global mean near‐surface air temperatures from the HadGEM3‐GC31‐LL simulations are consistent with CMIP6 model ensembles for the equivalent experiments. While the HadGEM3‐GC31‐LL simulations with anthropogenic and natural forcing factors capture the overall observed warming, the lack of marked simulated warming until the 1990s is diagnosed as due to aerosol cooling mostly offsetting the well‐mixed greenhouse gas warming until then. The model has unusual temperature variability over the Southern Ocean related to occasional deep convection bringing heat to the surface. This is most prominent in the model's aerosol only simulations, which have the curious feature of warming in the high southern latitudes, while the rest of the globe cools, a behavior not seen in other CMIP6 models. This has implications for studies that assume model responses, from different climate drivers, can be linearly combined. While DAMIP was predominantly designed for detection and attribution studies, the experiments are also very valuable for understanding how different climate drivers influence a model, and thus for interpretating the responses of combined anthropogenic and natural driven simulations. We recommend institutions provide model simulations for the high priority DAMIP experiments.
Phase 6 of the Coupled Model Intercomparison Project (CMIP6) simulations suggest that the extremely warm August over the Tibetan Plateau in 2022 could not occur without human influences, which corresponds to a new normal during 2070–2100.
Drama behind the scenes at the Kyoto Protocol negotiations is laid bare in a major theatrical production.
Three out of the five highest daily winter rainfall totals on record over Northern England have occurred from 2015 onwards. Heavy rainfall events in the winters of 2013-2014, 2015-2016 and 2019-2020 led to more than 2.8-billion-pounds of insurance losses from flooding in the UK. Has the frequency of these events been influenced by human-induced climate change? Winter rainfall in the UK is extremely variable year-to-year, which makes the attribution of rainfall extremes particularly challenging. To tackle this problem, we introduce an UNprecedented Simulated Extreme Ensemble (UNSEEN) approach for the attribution of such extremes, thereby increasing the data available, and apply this approach to five recent flooding events on a regional scale. Using this method, for all five events we found a significant climate signal in the extreme regional rainfall totals immediately preceding the flooding. Results were fairly similar for each-with the events being found to become from 1.4 to 2.6 times more likely. An alternative attribution method that uses a different model with substantially less data did not find significant increases, reinforcing the need for very large amounts of data to detect significant changes in extreme rainfall against a noisy background of natural variability. We also examine how extreme rainfall is changing more broadly across English regions in winter, finding that 1-in-10 to 1-in-90-year winter rainfall totals have changed significantly in Northern England. The high volume of data using UNSEEN has enabled us to examine the dynamics of these events, showing that daily extremes in winter are likely to have increased across all the circulation patterns responsible for high rainfall in English regions.
The science of event attribution has developed considerably in recent years. There is now a growing interest in making this science operational. This perspective considers the challenges involved in doing this and suggests some priorities for further developments. It concludes that there is a requirement to deepen understanding of user needs for operational attribution, that further research will be needed to enable attribution of a wider variety of extreme events and their impacts, that there will have to be a greater underpinning of operational capability for such activities to be achievable, and that improved strategies for communicating results are needed for successful uptake by users.
As the world warms, extremely hot days are becoming more frequent and intense, reaching unprecedented temperatures associated with excess mortality. Here, we assess how anthropogenic forcings affect the likelihood of maximum daily temperatures above 50 °C at 12 selected locations around the Mediterranean and the Middle East. We adopt a risk-based attribution methodology that utilises climate model simulations with and without human influence to estimate the probability of extremes. We find that at all locations, temperatures above 50 °C would have been extremely rare or impossible in the pre-industrial world, but under human-induced climate change their likelihood is rapidly increasing. At the hottest locations we estimate the likelihood has increased by a factor of 10–10 3 , whereas by the end of the century such extremes could occur every year. All selected locations may see 1–2 additional months with excess thermal deaths by 2100, which stresses the need for effective adaptation planning.
The risk of flash flooding is likely to increase with the intensification of short-duration rainfall extremes due to Climate Change. Using the latest convective-permitting resolution climate model data for the UK and the LISFLOOD-FP flood inundation model, we adopt a trend detection approach to attribute flash flooding impacts over the UK city, Leeds. Our study is based on an extreme rainfall event in August 2014, where over 400 properties were flooded after 80mm of rainfall fell in five hours in parts of the city. This research will be the first attribution study for UK pluvial flood impacts, using pure convective-permitting resolution climate model data. The flood inundation model simulates flood maps for over 12 000 events using soil moisture and rainfall data as inputs.
Assessing global mean temperature rise using the average warming over the previous one or two decades will delay formal recognition of when Earth breaches the Paris agreement’s 1.5 °C guard rail. Here is what’s needed to avoid the wait. Assessing global mean temperature rise using the average warming over the previous one or two decades will delay formal recognition of when Earth breaches the Paris agreement’s 1.5 °C guard rail. Here is what’s needed to avoid the wait.
We will present findings from a comprehensive review of the detection and attribution of climate change in the UK, including both recent and past events within the observation record. We will highlight where there are notable gaps, including those that can and cannot be closed with existing data and/or attribution techniques.This systematic review of detection and attribution literature will feed into a report, with a database of supporting evidence, to inform the Climate Change Committee’s upcoming UK Climate Change Risk Assessment. The first part of the review will cover the detection and attribution of weather and climate changes in the UK, relevant to specific Climate Impact Drivers, while the second will cover societal, infrastructural, economic, and biodiversity impacts associated with these. As part of this, we will identify variables which are key drivers of multiple impacts, and, importantly, where further attribution analysis is needed, especially when the impacts are critical for UK risk.
Operational attribution protocols ensure transparency of assessments; communication needs to include future changes in extremes and meteorological development of the event to add value in local decision making.
The response of precipitation to global warming is manifest in the strengthening of the hydrological cycle but can be complex on regional scales. Fingerprinting analyses have so far detected the effect of human influence on regional changes of precipitation extremes. Here we examine changes in seasonal precipitation in Europe since the beginning of the twentieth century and use an ensemble of new climate models to assess the role of different climatic forcings, both natural and anthropogenic. We find that human influence gives rise to a characteristic pattern of contrasting trends, with drier seasons in the Mediterranean basin and wetter over the rest of the continent. The trends are stronger in winter and weaker in summer, when drying is more spatially widespread. The anthropogenic signal is dominated by the response to greenhouse gas emissions, but is also weakened, to some extent, by the opposite effect of anthropogenic aerosols. Using a formal fingerprinting attribution methodology, we show here for the first time that the effects of the total anthropogenic forcing, and also of its greenhouse gas component, can be detected in observed changes of winter precipitation. Greenhouse gas emissions are also found to drive an increase in precipitation variability in all seasons. Moreover, the models suggest that human influence alters characteristics of seasonal extremes, with the frequency of high precipitation extremes increasing everywhere except the Mediterranean basin, where low precipitation extremes become more common. Regional attribution information contributes to the scientific basis that can help European citizens build their climate resilience.
Human influence and persistent low pressure are estimated to make extreme May rainfall in the United Kingdom, as in year 2021, about 1.5 and 3.5 times more likely, respectively.
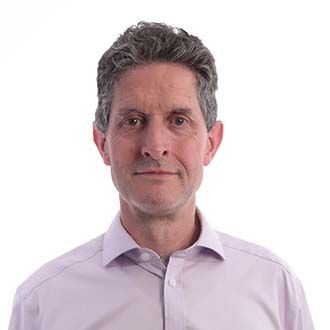 Myles Allen合作论文数Environmental Change Institute, School of Geography and the Environment, University of Oxford;Department of Physics, University of Oxford72
 Nikolaos Christidis合作论文数69
 Nathan Gillett合作论文数Department of Geography, Simon Fraser University;University of Victoria38
 Gareth S. Jones合作论文数Hadley Centre, Met Office36
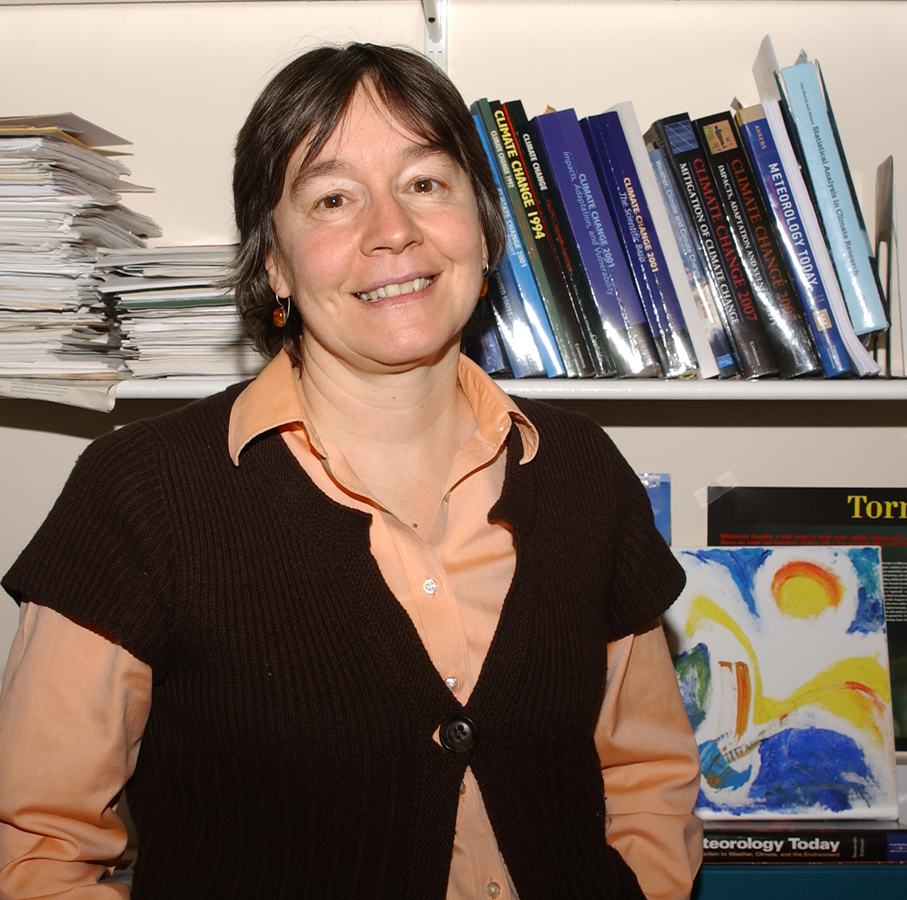 Gabriele Clarissa Hegerl合作论文数Global Change, School of GeoSciences, The University of Edinburgh35Andrew Ciavarella合作论文数23
 Francis Zwiers合作论文数Pacific Climate Impacts Consortium, University of Victoria23
 Michael F. Wehner合作论文数Applied Mathematics and Computational Research Division, Lawrence Berkeley National Laboratory23F. Lott合作论文数22
 Dáithí Stone合作论文数National Institute for Water and Atmospheric Research21
 Gerald Meehl合作论文数Climate and Global Dynamics Laboratory, National Center for Atmospheric Research19
 Karl E. Taylor合作论文数Program for Climate Model Diagnosis and Intercomparison, Lawrence Livermore National Laboratory18
 Geert Jan Van Oldenborgh合作论文数18
 Friederike Otto合作论文数The Grantham Institute for Climate Change, Faculty of Natural Sciences, Imperial College London17
 Benjamin David Santer (Benjamin D. Santer)合作论文数Lawrence Livermore National Laboratory, University of California16J. F. B. Mitchell合作论文数University of Reading;Met Office15David J. Karoly合作论文数15
 Chris Huntingford合作论文数UK Centre For Ecology and Hydrology15Stephanie C. Herring合作论文数14Jason Lowe合作论文数14
 Adam Scaife合作论文数Department of Mathematics and Statistics, University of Exeter;Met Office14
 Simon Tett合作论文数School of Geosciences, University of Edinburgh14Peter J. Gleckler合作论文数Program for Climate Model Diagnosis and Intercomparison;Livermore National Laboratory;Program for Climate Model Diagnosis and Intercomparison, Livermore National Laboratory14Dann Mitchell合作论文数13
 Richard Betts合作论文数Global Systems Institute, University of Exeter;Met Office Hadley Centre12
 Peter Thorne合作论文数National Oceanography Centre12Daniel Cotterill合作论文数11
 Frank Wentz合作论文数Microwave Climate Data Center, Remote Sensing Systems11
 Susan Solomon合作论文数Department of Earth, Atmospheric and Planetary Sciences, Massachusetts Institute of Technology;Department of Chemistry, Massachusetts Institute of Technology11
 Pierre Friedlingstein合作论文数Department of Mathematics and Statistics, University of Exeter;Global System Institute, University of Exeter11
 Jonathan Gregory合作论文数National Centre for Atmospheric Science,Department of Meteorology, University of Reading;Met Office Hadley Centre11
 Thomas C Peterson合作论文数National Climatic Data Center, National Oceanic and Atmospheric Administration11
 Xuebin Zhang合作论文数Pacific Climate Impacts Consortium, University of Victoria11
 Carl Mears合作论文数Remote Sensing Systems11
 John R. Lanzante合作论文数Geophysical Fluid Dynamics Laboratory, Princeton University11
 Martin P. Hoerling合作论文数Graduate School of Hydrosciences, University of Colorado Boulder11
 Ronald Stouffer合作论文数Department of Geosciences, College of Science, The University of Arizona11
 Andrew Hoell合作论文数Hydrology Applications Division, Physical Sciences Laboratory, National Oceanic and Atmospheric Administration11
 Ying Sun (孙颖)合作论文数Laboratory for Climate Studies, National Climate Centre10
 Reto Knutti合作论文数Institute for Atmospheric and Climate Science, Department of Environmental Systems Science, ETH Zurich10
 Matilde Rusticucci合作论文数Departamento de Ciencias de la Atmósfera y los Océanos, Facultad de Ciencias Exactas y Naturales, Universidad de Buenos Aires10
 Julie M. Arblaster合作论文数, PO Box 3000, Boulder, CO 80307, USA10Toru Nozawa合作论文数10
 Pardeep Pall合作论文数10
 T M L Wigley合作论文数School of Biological Sciences, University of Adelaide;National Center for Atmospheric Research9
 Robert Vautard合作论文数French National Centre for Scientific Research;Institut Pierre-Simon Laplace9
 Seung-Ki Min合作论文数Meteorological Institute;University of Bonn;Meteorological Institute, University of Bonn9J. A. Kettleborough合作论文数9
 James P. Kossin合作论文数Space Science and Engineering Center, University of Wisconsin - Madison9




